Research Article: 2024 Vol: 28 Issue: 2S
The Ease of Doing Business in the ESG Framework at World Level
Alberto Costantiello, LUM University Giuseppe Degennaro
Angelo Leogrande, LUM Enterprise s.r.l
Citation Information: Costantiello, A. & Leogrande, A.,(2024). The ease of doing business in the esg framework at world level. Academy of Accounting and Financial Studies Journal, 28(S2), 1-18.
Abstract
In this article, we estimate the variable Ease of Doing Business-EDB in the context of Environmental, Social and Governance-ESG model. We use data from ESG World Bank dataset. We have used data from 193 countries in the period 2011-2020. The level of EDB is positively associated, among others, to “Individuals Using the Internet”, “Government Effectiveness”, “Cooling Degree Days”, and negatively associated to “Agriculture, Forestry, and Fishing, Value Added”, “Forest Area” and “Strength of Legal Rights Index”. Furthermore, we have applied a cluster analysis with the application of the k-Means algorithm optimized with the Elbow Method and we have found the presence of four clusters. Finally, we have proposed a confrontation among eight different machine- learning algorithms to predict the future value of EDB. We have found that Linear Regression is the best algorithm and that the level of EDB is expected to improve of 1.66% for the analysed countries.
Keywords
Analysis of Collective Decision-Making, General, Political Processes: Rent-Seeking, Lobbying, Elections, Legislatures, and Voting Behaviour, Bureaucracy, Administrative Processes in Public Organizations, Corruption, Positive Analysis of Policy Formulation, Implementation.
Introduction
In the following article we analyzed the EDB value in the context of ESG variables of the World Bank database. The role of EDB value for the economic development of a country is well known in scientific literature, as we show in the second paragraph. In our analysis, the element of originality consists in connecting the evolutionary dynamic of EDB with respect to the essential determinants of the ESG model. Within the ESG model, the governance issue is relevant for the development of EDB. In fact, the ability of a government to be free from corruption, of being able to apply laws that favor the market, and to recognize private property rights, is essential both to attract Foreign Direct Investments-FDI and to stimulate the entrepreneurship of the population. The judicial question is particularly relevant. Entrepreneurs and investors, in fact, need to have certainties about the ability of the legal system to recognize and protect their investments without incurring in forms of nationalization, or without having to be forced to increase real costs due to the corruption of the institutions. Therefore, governance issues are certainly in the first place for the development of EDB.
However, environmental issues are also equally relevant especially for multinational companies that have stringent ethical criteria, and which are monitored in their investments by investors or stock exchange control companies. Finally, the social aspects are also of some relevance for the purposes of the EDB, such as in the case of the spread of the number of internet’s users.
Finally, it must be considered that at present all countries accept the idea that the maximization of EDB is a necessary and good policy for economic development at the country level. In the past, there was a debate relating to the optimal modalities for the production of goods and services i.e. the contraposition between market societies and socialists societies. Today this contraposition does not exist anymore. Even China, which is a State formally governed by a communist party, accepts the idea that economic development takes place through private companies and therefore tends to create a system oriented to promoting EDB. Obviously, this does not mean that there are identical conditions and visions between the countries relating to EDB's opportunity. And in fact, there is a certain degree of heterogeneity in terms of defense and protection of private property rights that contrasts the western world to the countries of new industrialization.
The article proceeds as follows below: the second paragraph contains the analysis of literature, the third paragraph presents the econometric model, the fourth paragraph shows the results of the cluster analysis, the fifth paragraph analyzes the prediction obtained with machine learning algorithms, the sixth paragraph concludes. The appendix has further graphic contents and metric results.
Literature Review
A part of the scientific literature relating to the role of EDB is reported below. The literature analyzes the role of EBD in promoting economic development, economic growth, FDI and good governance.
EDB and Economic Growth
There is a close relationship between the value of EDB and economic growth. In fact, countries that have a very high level of economic growth also have high levels of EDB. These are economies that host big corporations, multinational companies that combine billions of dollars and sometimes have a market value higher than the GDP of many countries worldwide. However, to reach this level of development of the private sector economy, it is necessary that institutional reforms are built. Among these reforms, those that facilitate EDB have a crucial role in allowing the settlement and development of new companies, which also in the presence of adequate financial markets and banking intermediaries, can become multinational companies and operate globally. Obviously, the value of EBD is high in western countries that in fact tend to have a high growth and economic development. However, also the countries of new industrialization, such as China, India, Indonesia, Pakistan, and Nigeria, are facing the theme of EDB to prepare themself to participate as protagonists in the future of global economic growth. The linkages between EDB and economic growth change over time: that’s the result of a comparison between 2008 and 2017 in a set of African Countries. It follows that it is not possible to set a unique and one for ever set of politics to promote the positive relationship between EDB and economic growth even if the quality of regulation seems to play a strategic role either for EDB either for the increase in GDP (Estevão et al., 2020). EDB is positively associated to capital market development and the diffusion of electricity in Economic Community of West Africa-ECOWAS countries in the period 2004-2017 (Nageri, 2020). EDB has a positive effect on economic growth in Indonesia (Nawawi et al., 2022).
EDB and Land Management
The possibility of increasing the EDB value also depends in some way on land management. Above all, the urban structure of the cities, the possibility of being able to establish in the cities of the production neighborhoods, which hosting companies, is an essential element for the development of EDB. In this sense, it is not possible for a country to obtain high levels of EDB without adequately investing in improving the tools of land and space management. The connection between the organization of the cities from an urban point of view, the transport system and also the sources of energy supply is also very relevant. Finally, the issue of pollution becomes increasingly relevant within the urban context and companies are looking for not only places equipped to establish their own offices as well as cities that are clean and that can respect the criteria of environmental sustainability These requests for adequate spaces for the settlement of companies become increasingly pressing with the growth of the quality of the human capital employed. There is a positive relationship between EDB and land and spatial management in the case of Indonesia (Indrajit et al., 2021). Indonesia is implementing a Rights, Restrictions, and Responsibilities-RRRs system to improve EDB through land management (Indrajit et al., 2020)
EDB and FDI
The role of FDI is important for new industrialized countries. In fact, the low-income income countries try to attract the investments of multinationals by focusing on the low labor cost and on the ability to offer public and financial incentives to the big corporations. However, the ability of a country to attract multinationals depends on the quality of its political institutions, its laws, on the safety of its judicial system and on its police system. In fact, international companies do not invest only for economic reasons, that is to reduce the price of raw materials, lower the cost of labor or approach the outlet markets or to optimize the supply chain. Multinational companies also invest considering international politics as demonstrated by the transition between off-shoring and friend- shoring. That is, companies try to invest in countries that also have common political values, namely the fact of sharing the ideal of democracy, economic freedoms, and a market system capable of protecting property rights. There is a positive relationship between EDB and FDI (Malik & Jyoti, 2018). There is a positive relationship between EDB and FDI in North Macedonia (Jusufi & Lubeniqi, 2019). EDB has a positive impact on moderating the negative effect of political risks on FDI for Thailand (Pertiwi et al., 2020). There is a positive connection between EDB and FDI in Indonesia (Fibra, 2018). There is a positive relationship between some sub-variable of EDB and FDI in 16 European transition countries i.e.: Starting a Business, Registering Property, Getting Electricity and Resolving Insolvency (Haliti et al., 2019). EDB is positively associated to FDI in a set of 166 countries in the period 2009-2018 (Anggraini & Inaba, 2020).
EDB and Governance
Finally, the issues related to governance are also very relevant for the development of EDB. In particular, the presence of corruption or terrorism do not facilitate the increase of EDB at country level. It follows that if a nation wants to improve its value in terms of EDB, it must necessarily try to modify its own governance. To improve public governance, it is necessary to eliminate corruption, to focus on political stability, to assert the rule of law, to increase the regulatory quality, to increase the degree of government effectiveness. It is also very important that the countries intervene on the structure of recognition and protection of private property rights and on the methods to solve disputes between creditors and debtors. In fact, either the possibility of attracting FDI, either the ability to help the population to take charge of the business risk, also depends on regulations that are in favour of risk takers and that do not get the debtors excessively if they are entrepreneurs. Corruption, inflation, and imports are negatively associated to EDB in a set of countries in the period 2014-2017 for West African Countries (Nageri & Gunu, 2020). The regulatory policy is an essential tool to promote EDB in India (Natarajan & Raza, 2017) and Oman (Bhandari & Mohite, 2022). There is a positive relationship between EDB and governance indicators for 188 countries (Handoyo, 2017). E-governance has a positive impact on EDB in India (Yadav et al., 2020). A reform of the legal protection of property rights, bankruptcy and civil disputes can help Indonesia to improve its EDB ranking (Asmara et al., 2019; Rumadan, 2020; Kawung et al., 2019). A better governance can improve the level of EDB in Pakistan (Lakhan et al., 2021).
The Econometric Model for the Estimation of the EDB
In the following part we present the results of the econometric estimate. The econometric model made estimates EDB's value based on a set of variables belonging to the ESG database of the World Bank. The data refer to the period between 2011 and 2020 for 193 countries. The econometric techniques used are: Panel Data with Fixed Effects, Panel Data with Random Effects, Weighted Least Squares- WLS and Poled Ordinary Least Squares-OLS. The choice to use panel models is almost obligatory. In fact, having available a set of data capable of giving a representation both in the sense of the historical series and in the sense of individual observations then it is advisable to use the panel data model. The WLS and Poled OLS models have been used with greater proof of the results obtained, that is, as “a fortiori” condition. In the analysis of the individual variables of the model and their relationships with EDB we did not highlight the presence of causal relationships. On the contrary, we only analysed associative relationships. In fact, having not applied any type of cause-effect analysis, we limited ourselves to verifying the presence of associations among the variables by evaluating them according to the fact that they are positive or negative and based on their statistical significance. The ESG database of the World Bank is made up of 67 variables. Among these, about 25 appeared to have a high statistical significance compared to EDB. However, by simplification we decided to use a model with a maximum of 10 variables, and effectively we ended with 9 variables, in order not to incur the problems of overfitting, endogeneity and excess value of the R-Squared. Specifically, we have estimated the following formula:

![]()
The value of EDB is positively associated to the following variables:
PO: It is a variable that considers the percentage of adults aged 18 or over whose body mass index (BMI) is greater than 25 kg/m2. Body mass index (BMI) is a simple index of weight times height, i.e. weight in kilograms divided by height in meters squared. There is a positive relationship between the EDB value and the PO value. Countries that have a high EDB value tend to have a positive amount of PO. Among the countries with a high percentage of overweight people in adulthood are the United States with a value of 67.9%, followed by New Zealand with 65.6%, Australia with 64.5%. Israel with 64.3%, Canada with 64.1% and the United Kingdom with 63.7%. The relationship can be understood considering that the countries that have a high level of EDB are also the countries that have a high per capita income. In countries with high per capita income, the population tends to develop forms of overweight, also creating significant problems for the financial sustainability of health care expenditure.
EI: is the ratio between the energy supply and the gross domestic product measured at purchasing power parity. Energy intensity is an indication of how much energy is used to produce an economic unit of production. A lower ratio indicates that less energy is used to produce one unit of output. There is a relationship between EI and EDB. Countries that have a high level of EDB also have highly developed industrial systems and a high level of energy intensity. However, the same countries are trying to reduce energy intensity through investment in environmental sustainability and through the increase of alternative forms of energy. The business creation activity turns out to be very expensive in terms of energy and in order to be attractive towards the industrial and entrepreneurial system, countries often tend to consume and waste a lot of energy, also increasing the value of CO2 emissions. A very serious condition that requires new economic policies based on sustainability and new renewable technologies.
IUI: These are individuals who have used the Internet (from anywhere) in the past 3 months. The Internet can be used through a computer, mobile phone, personal digital assistant, game console, digital TV, etc. There is a positive relationship between EDB and IUI value. The countries that have the highest level of EDB are also the countries that have the greatest diffusion of information technologies. The affirmation of the fourth industrial revolution has led to the development of technologies applied to business that require massive doses of digitization. Furthermore, the development of technologies is also necessary to increase the ability of companies to offer services to users and develop new business opportunities. The diffusion of internet users is therefore, on the one hand, a preliminary element to the development of startups and newcos and, on the other hand, a multiplier of the private sector to generate earnings.
GE: It captures perceptions of the quality of public services, the quality of the civil service and the degree of its independence from political pressures, the quality of policy formulation and implementation, and the credibility of government engagement against these policies. The estimate gives the country's score on the aggregate indicator, in units of a standard normal distribution, i.e. ranging from approximately -2.5 to 2.5. There is a positive relationship between EDB and GE. Countries that offer the best public services to the population are also the countries that have the greatest capacity to attract businesses and create a favourable economic climate for entrepreneurship. This positive relationship between the value of GE and EDB is also because in order to set up companies at the country level it is also necessary to offer a political and institutional framework favourably directed towards the protection of rights and freedoms. Indeed EDB is a variable that can also be considered as a representation of the high level of defence of private property rights and economic freedoms.
CDD: It is a measurement designed to track energy use. It is the number of degrees in which the average temperature of a day is above 18°C (65°F). The degree-days are accumulated to obtain the annual values. There is a positive relationship between CDD and EDB. CDD is a measurement of the advancement of global warming. The positive relationship between CDD and EDB shows that global warming has increased in countries that have high levels of EDB and which are generally northern hemisphere countries.
The value of EDB is negatively associated to the following variables:
AFF: It calculates the value added of agriculture, forestry and fishing. There is a negative relationship between AFF and EDB. Countries that have a high level of EDB also have a low AFF value. Countries that have high levels of AFF as a percentage of GDP are in fact low per capita income countries with low EDB levels. These countries have an economy that has not yet developed. Countries that have a developed economic system tend to have a breakdown of GDP by sector of economic activity centred on the service sector and in particular on advanced services. In these countries, the value of AFF is reduced in a range between 2 and 3%. Countries that have high levels of EDB are therefore countries that tend to develop the service sector with a reduced role of manufacturing, construction and AFF.
FA: This is land under natural woodland or planted trees of at least 5 meters in situ, whether productive or not, and excludes woodland in agricultural production systems (for example, fruit plantations and agroforestry systems) and trees in urban parks and gardens. There is a negative relationship between the FA and EDB. Countries that have high levels of AF also have low levels of EDB. In the top ten countries by FA value in 2020 we find Suriname with 97.41%, Guyana with 93.55%, Micronesia Fed Sts with 92.02%, Gabon with 91.32%, Solomon Islands with 90.13%, Palau with 90.02%, Equatorial Guinea with 87.28%, American Samoa with 85.65%, Papua New Guinea with 79.17%, and Liberia with 79.08%. These countries have low performance in terms of EDB.
SLRI: It measures the degree in which the guaranteed and bankruptcy laws protect the rights of mutuals and financiers and therefore facilitate loans. The index varies from 0 to 12, with higher scores indicating that these laws are better designed to expand access to credit. There is a negative relationship between the EDB value and the value of SLRI. This relationship is since to increase the ability of people to do business, legislation is needed that does not only facilitate the creditor and that it is in some way also in favour of the debtor. In fact, if we look at the SLRI ranking in 2020 we can see that the countries that have the maximum score, or 12, are Azerbaijan, Brunei Darussalam, Montenegro, New Zealand, and Puerto Rico. Except for New Zealand who has good values in terms of EDB, the other countries in the top SLRI have reduced EDB values. For example, Singapore, which is one of the leading countries in terms of EDB, has a value of slides of eight.
Finally, we can observe that the relationship between EDB and PD is weakly positive but close to zero. The population density is a mid -year population divided by the earth's surface into square kilometres. The population is based on the factual definition, which has all residents regardless of legal status or citizenship, except for refugees not permanently established in the country of asylum, which are generally considered part of the population of their country of origin. The weak positive relationship between PD and EDB is since many of the countries that have a high level of EDB are small countries with a significant population density. In fact, there are countries that have high levels of EDB and high levels of PD such as: Macao, Monaco, Singapore, Hong Kong and Gibraltar. However, many countries that have a medium-high level of EDB have reduced PD values. For example, the USA are among the last countries in the world in terms of PD also having very high EDB values (Table 1).
| Table 1 The Econometric Model for the Estimation of the Value of EDB | ||||
| VAR | Acronomyn | Definition | Average | Adjustment *(-1) |
| A15 | EDB | Ease of Doing Business | ||
| A6 | AFF | Agriculture, forestry, and fishing, value added (% of GDP) | 0,84 | -0,84 |
| A22 | FA | Forest area (% of land area) | 0,50 | -0,50 |
| A63 | SLRI | Strength of legal rights index (0=weak to 12=strong) | 0,04 | -0,04 |
| A49 | PD | Population density (people per sq. km of land area) | 0,00 | 0,00 |
| A51 | PO | Prevalence of overweight (% of adults) | -0,08 | 0,08 |
| A18 | EI | Energy intensity level of primary energy (MJ/$2011 PPP GDP) | -0,14 | 0,14 |
| A32 | IUI | Individuals using the Internet (% of population) | -0,30 | 0,30 |
| A27 | GE | Government Effectiveness: Estimated | -12,53 | 12,53 |
| A13 | CDD | Cooling Degree Days (projected change in number of degree Celsius) | -114,33 | 114,33 |
Clusterization with k-Means Algorithm
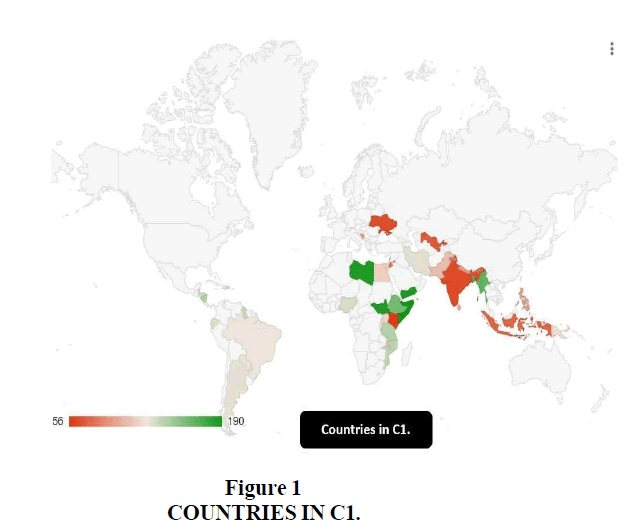
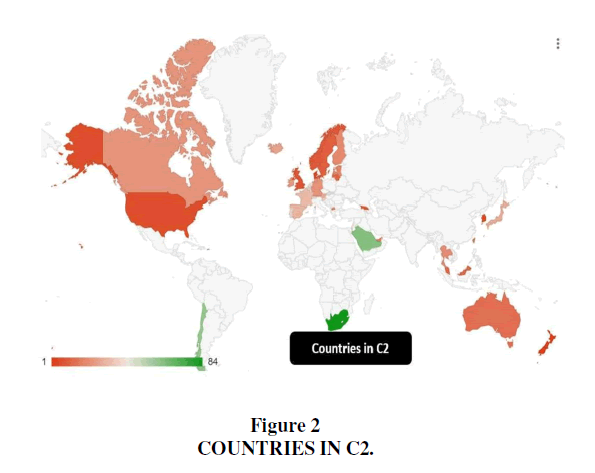
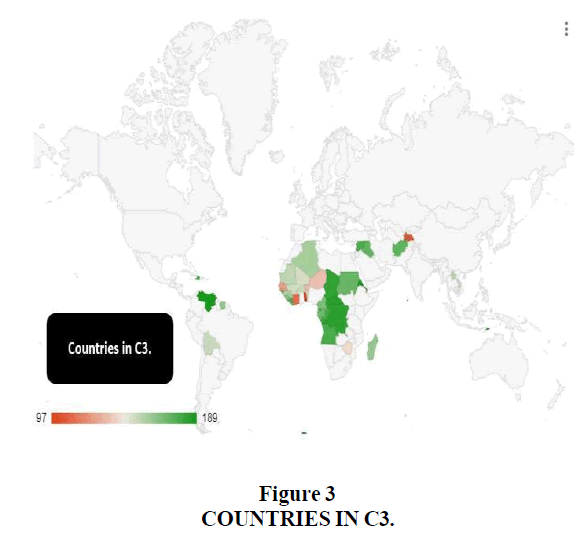
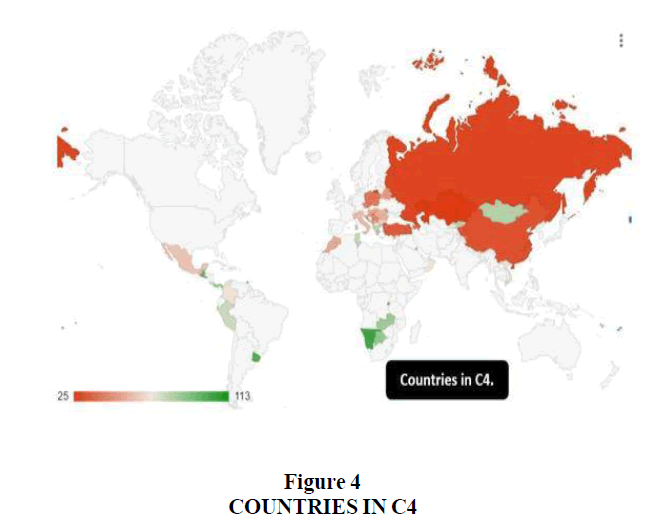
A clustering with k-Means algorithm optimized with the Elbow method is presented below. The clustering algorithm is applied to verify the presence of a series of clusters within the analyzed dataset. In this case we analyzed 191 countries. Since we are dealing with a very large set of countries, it is necessary to identify characteristics that can highlight the presence of heterogeneity in the data. Furthermore, clustering also serves to verify the presence of geographical connections in the area that can in some way determine the presence of common geo-political factors. Finally, through clustering we also want to highlight whether the countries within the same cluster also share common institutional elements such as, for example, the presence of a democratic system or an orientation towards the market society. The clustering process can be accomplished through a set of methodologies. Since the k-Means algorithm is an unsupervised algorithm, it is necessary to identify a criterion that can allow to identify the optimal number of k. We have tried using the Silhouette coefficient method with poor results. In fact, the Silhouette coefficient is a number that varies from - 1 to 1 which is assigned to each k. The value of k that has the highest Silhouette coefficient value is the optimal k. However, in the case analysed, the optimal value of k with the Silhouette coefficient is equal to 2. It follows that the 191 countries analyzed would have become part of only two clusters with a very low level of representation of heterogeneity between countries. For this reason, i.e. in order not to lose the ability to give a correct representation of the heterogeneity present among the countries analysed, we have chosen to use the alternative method to the Silouette coefficient or the Elbow method. Elbow's method is a graphical method for determining the number of optimal clusters of a given sample. Through the use of Elbow's method, the number of k=4 was chosen. The value of k=4 was considered sufficiently valid to give a representation of the heterogeneity present within the analyzed dataset. From a strictly quantitative point of view and with reference to the median of the clusters, it is possible to identify the following ordering: C2 = 21 > C4 = 72 > C1 = 128,5 > C3 = 164,5.
C1: Gambia, Mozambique, Tanzania, Nigeria, Malawi, Micronesia, Kenya, Uzbekistan, Sri Lanka, Iran, Libya, South Sudan, Bangladesh, Palestine, Barbados, Dominican Republic, Myanmar, Maldives, Belize, Yemen, Saint Kittis and Nevis, Somalia , Cape Verde, Bosnia and Herzegovina, Philippines, India, Ukraine, Ecuador, Egypt, Jordan, Bhutan, Ethiopia, Paraguay, Indonesia, Granada, Nepal, Papua New Guinea, Lesotho, Brazil, Honduras, Pakistan, Palau, Eswatini, Kiribati, Uganda, Guyana, Lebanon, Marshall Islands, Nicaragua, Argentina. C1 countries are among the bottom countries in terms of EDB. C1 is in fact the penultimate cluster before C3. These are African countries in South and Southeast Asia, Latin America and Eastern Europe. The reasons that push these countries to have a low performance in terms of EDB refer to the socio-economic, political and institutional dimension. In fact, these are countries that have fragile democracies, models of economic growth based on the fight against poverty and inequality, and a set of educational institutions and in the health sector that are quite fragile. However, among these countries we have to focus on India. Indeed, India will become one of the top economies in the world in terms of absolute gross domestic product. However, given the size of the population, per capita income will in any case remain low and will probably converge on the low-medium level per capita income. However, India's ability to develop depends on its ability to improve the EDB variable. India, unlike China, is a democracy, based on the principles of equality and with recognition of private property rights and economic freedoms. It follows that, also thanks to the growth of Foreign Direct Investments-FDI, India should be able to increase its positioning in terms of EDB by creating the conditions to grow the private economy and therefore promote economic growth. Similar considerations are also valid for Indonesia and Brazil. Indeed, Indonesia and Brazil will certainly be two leading economies in future economic growth with very high levels of absolute gross domestic product and average levels of per capita gross domestic product. In fact, the analysis of C1 shows that India is improving its position from the point of view of EDB, together with Indonesia and could probably move into the next cluster by value of EDB or C4. However, the same considerations cannot be made for Brazil, which still presents difficulties in terms of EDB. Furthermore, the condition of Thailand is also of particular interest, a country that could grow a lot especially as a manufacturing and production hub, and which together with Indonesia and India could become a medium-high level country in terms of EDB. Finally, some consideration is also necessary with reference to Egypt, a country that should become part of the Next Eleven-N11, i.e. a group of countries, for which significant growth is expected in terms of percentage contribution to GDP at global level (Figure 1).
C2: South Africa, Saudi Arabia, Slovenia, North Macedonia, Puerto Rico, United Arab Emirates, Chile, Armenia, Spain, Slovakia, Israel, Georgia, Taiwan, Portugal, Belgium, France, Thailand, Mauritius, Netherlands, Singapore, Austria, Japan, New Zealand, Switzerland, Hong Kong, South Korea, Denmark, United States, Lithuania, Latvia, United Kingdom, Norway, Canada, Malaysia, Estonia, Germany, Ireland, Australia, Sweden, Iceland, Finland. C2 is the best cluster in the sense of EDB. It is a cluster made up of countries from North America, Central-Northern Europe, South-East Asia, the Far East and Oceania. C2 represents a set of countries that refer to the Western world. The countries that have the best performances in terms of EDB value are countries of North America, Northern Europe, Oceania, the Far East with the addition of Malaysia and the United Arab Emirates. The countries that could instead leave the cluster are Chile, Saudi Arabia, South Africa and Puerto Rico. The value of EDB represents in some way the degree of diffusion of Western capitalism. Italy is one of the few European countries to be excluded from the leading cluster by EDB. Some separate considerations deserve South Africa. In fact, South Africa stands as the most westernized country in Africa and could lead an action of convergence towards South African levels in other countries of the continent. In fact, South Africa is a dynamic economy that is part of the BRICS. Saudi Arabia is a country that has a high level of EDB and that attracts FDI in an attempt to reduce the impact of the oil economy as a percentage of GDP. Chile is an economy that has suffered a lot from the charm of US liberalism-libertarianism and which has also been much oriented towards the market economy. Indeed, Chile has surpassed both Argentina and Brazil in terms of per capita income (Table 2). In fact, Chile's GDP per capita was $16,265.10, while Argentina's GDP per capita was $10,636.12 and Brazil's GDP per capita was $7,507.16 in 2021. A particularly interesting area in terms of EDB is that of South-East Asia and the Far East. These are countries such as Singapore, Hong Kong, Taiwan, Thailand, Japan, and South Korea, which have very high levels of development of socio-economic institutions capable of supporting the business sector. However, these economies are also at risk. The tension between USA and China is a threat towards the diffusion of FDI and the development of EDB in the area. Certainly, the situation in Hong Kong has changed following the Chinese aggression, and a similar fate appears to befall Taiwan. Japan and South Korea could also have negative effects from the growing tension between the US and China. Southeast Asia and the Far East represent the Western avant-garde in the Eastern world. The economic, human and social development of the countries of South East Asia and the Far East, and therefore the ability to attract companies to do business, depend on the presence of international relations of mutual interest between the USA and China. However, if China wants to establish itself as a local hegemonic power, then even the economies most connected to the Western world could experience a growth in systemic risks and a reduction in EBD (Figure 2).
| Table 2 List of Abbreviations | |
| Acronym | Variable |
| FDI | Foreign Direct Investments |
| ECOWAS | Economic Community of West Africa |
| ESG | Environmental, Social and Governance |
| WLS | Weighted Least Squares |
| OLS | Ordinary Least Squares |
| GDP | Gross Domestic Product |
| EDB | Ease of Doing Business |
| AFF | Agriculture, forestry, and fishing, value added (% of GDP) |
| FA | Forest area (% of land area) |
| SLRI | Strength of legal rights index (0=weak to 12=strong) |
| PD | Population density (people per sq. km of land area) |
| PO | Prevalence of overweight (% of adults) |
| EI | Energy intensity level of primary energy (MJ/$2011 PPP GDP) |
| IUI | Individuals using the Internet (% of population) |
| GE | Government Effectiveness: Estimated |
| CDD | Cooling Degree Days (projected change in number of degree Celsius) |
C3: Tajikistan, Cambodia, Liberia, Algeria, Djibouti, Suriname, Gabon, Comoros, Syria, Madagascar, Sierra Leone, Cote d’Ivoire, Mali, Bolivia, Burkina Faso, Equatorial Guinea, Sudan, Senegal, Laos, Togo, Iraq, Burundi, Haiti, Benin, Niger, Central African Republic, Eritrea, Democratic Republic of Congo, Chad, Venezuela, Mauritania, Zimbabwe, Afghanistan, Congo, Sao Tome and Principe, Guinea, Timor Leste, Angola, Cameroon. C3 is the last cluster in terms of EDB. It is a set of countries belonging mainly to the African and Latin America. There are also certain countries of the Middle-Orient and Asian. The countries that have the greatest difficulty in terms of EDB are the countries of Sub-Saharan Africa. The countries of sub-Saharan Africa among African countries are those that have the largest level of underdevelopment from an economic, political, and institutional point of view. They are also countries that live difficult conditions from the point of view of war and violence between ethnic and tribal groups. In addition, there are also other countries characterized by very high political instability which therefore also have very low levels in terms of EDB or Syria, Venezuela, Afghanistan, Iraq. Furthermore, it must be considered that many of the C3 countries suffer from the curse of raw materials, or these are countries that have a high endowment of raw materials and which unfortunately are unable to access either economic growth paths or social development path (Figure 3).
C4: Mexico, Hungary, Bulgaria, Salomon Islands, Poland, Colombia, Peru, Czech Republic, Saint Vincent and the Grenadines, Bahrain, Guatemala, Uruguay, Bahamas, Costa Rica, Zambia, El Salvador, Romania, Malta, Cyprus, Seychelles , Kazakhstan, Morocco, San Marino, Ghana, Botswana, Luxembourg, Saint Lucia, Oman, Kosovo, Russia, Montenegro, Vietnam, Dominica, Albania, Fiji, Rwanda, Antigua and Barbuda, Tonga, Trinidad and Tobago, Kuwait, Namibia, Azerbaijan , Brunei, Belarus, China, Samoa, Greece, Italy, Croatia, Mongolia, Turkey, Tunisia, Serbia, Jamaica, Vanuatu, Panama, Kyrgyzstan, Moldova. The C4 is the second cluster in the sense of EDB. From a geographical point of view we can see four macro-areas present in the C4 or: Asian countries, Eastern Europe countries, Central and Southern American countries and African countries. The group of leading countries is made up of China, Russia and Eastern Europe, Mexico and Colombia. On the contrary, Mongolia, some Balkan countries and the southern Africa countries are less efficient in terms of EDB. It is necessary to carry out some considerations as regards China and Russia. The data analysed refer to 2020 and therefore do not take into consideration the events that occurred in connections with the Russian-Ukraine war. In fact, at present, most likely, Russia is no longer considered as a nation in which the level of EDB is medium-high. And it is very likely that the economic sanctions against Russia that have been imposed by the international community further reduce the value of EDB in the country also in the future. Therefore, the map is not currently representative of what is the level of EDB in Russia above all considering that many western companies have decided to leave the country and to reduce the level of FDI following the military attack against Ukraine. However, the degree of EDB of China could also be reduced. In fact, on the one hand, the election of XI Jinping at the helm of the country and on the other hand the military tension and, on the other hand, the technological rivalry between China and the USA can have a negative impact in terms of EDB. If China is perceived in the future as a corrupt country, in which it is the communist party or political leadership that decides the value and methods of the FDI, then the value of EDB in the country will certainly to be reduced (Figure 4).
Machine Learning and Predictions for the Estimation of the Future value of EDB
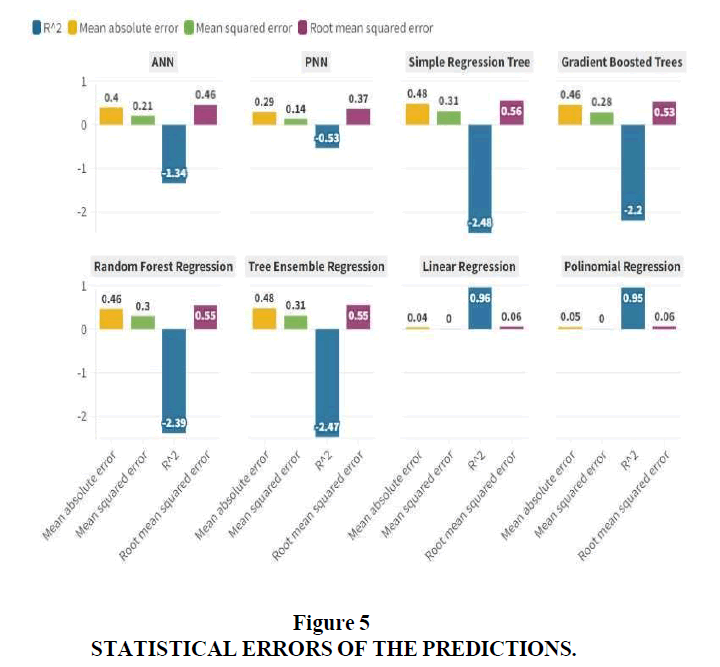
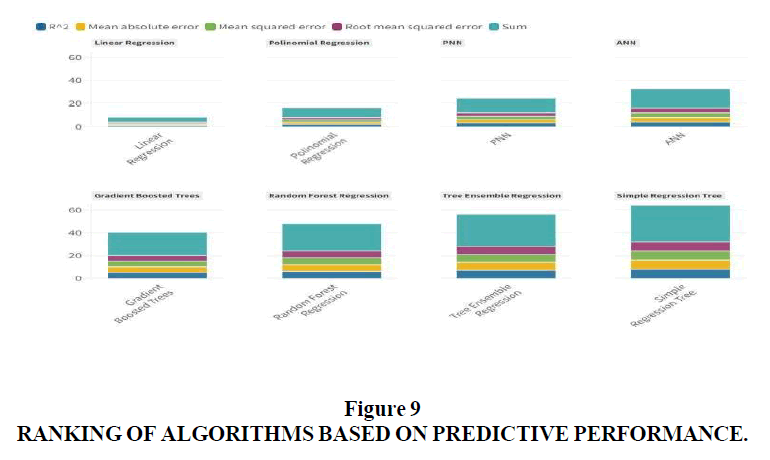
To predict the future value of the EDB variable, we analysed a set of machine learning algorithms compared to each other in terms of R-squared maximization and statistical error minimization. The statistical errors we used are Mean Absolute Error-MAE, Mean Squared Error-MSE, and Root Mean Squared Error-RMSE. The algorithms were trained with 70% of the available data while the remaining 30% was used for the actual prediction (Figure 5). Below is the classification of the best performing algorithms, namely:
a. Linear regression with a payoff value equal to 4;
b. Polynomial regression with a payoff value equal to 8;
c. PNN-Probabilistic Neural Network with a payoff value of 12;
d. ANN-Artificial Neural Network with a payoff value of 16;
e. Gradient Boosted Trees with a payoff value of 20;
f. Random Forest Regression with a payoff value of 24;
g. Tree Ensemble Regression with a payoff value of 28;
h. Simple regression tree with a payoff value of 32.
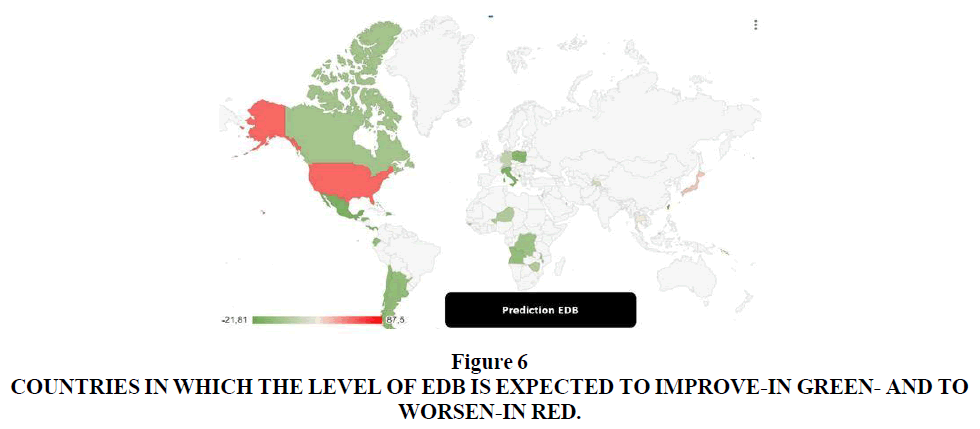
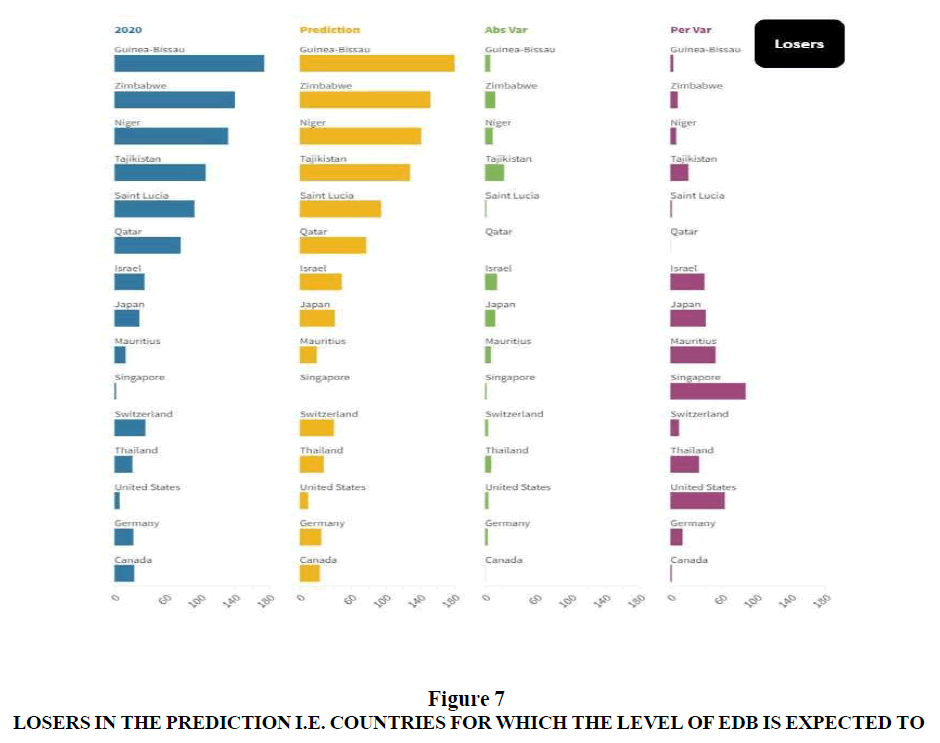
It follows that the best performing algorithm in terms of predictive capacity is the Linear Regression algorithm. By applying the Linear Regression algorithm, it is possible to verify that there are winners’ countries, i.e. countries for which the EDB value is expected to decrease and losers’ countries, i.e. countries for which the EDB value is expected to increase. Obviously, if the EDB value decreases, it means that there is an improvement. On the contrary, if the value of EDB increases, it means that there is a worsening of the country condition. Among the countries for the losers countries we find the following: Singapore with +87.5%, United States with +63.22%, Mauritius with +52.45%, Japan with +41.09%, Israel with +39.58%, Thailand with 33.2%, Tajikistan with +20.84%, Germany with 14.05%, Switzerland with +9.99%, Zimbabwe with 8.46%, Niger with 6.78%, Guinea-Bissau with 3, 39%, Saint Lucia with 1.65%, Canada with 1.48%, Qatar with 0.29% (Figure 6).
From a strictly geographical point of view, it appears that the EDB value is predicted to grow for almost all the countries for which the prediction was made. Conversely, there are only three countriesfor which the value of EDB is predicted to decrease and they are the USA, Japan and Thailand. As regards the countries for which a growth in the value of EDB is predicted, i.e. African countries, southern and Eastern Europe and the American continent, these are countries that have a low average level of EDB in the historical series and for which therefore a positive marginal change is predicted. Instead, with reference to the countries that have pejorative values, these are countries that start from very good positions in the EDB ranking and that undergo a downgrading for political-economic reasons (Figure 7).
Figure 7 Losers in the Prediction i.e. Countries for which the Level of EDB is Expected to Decrease.
Decrease
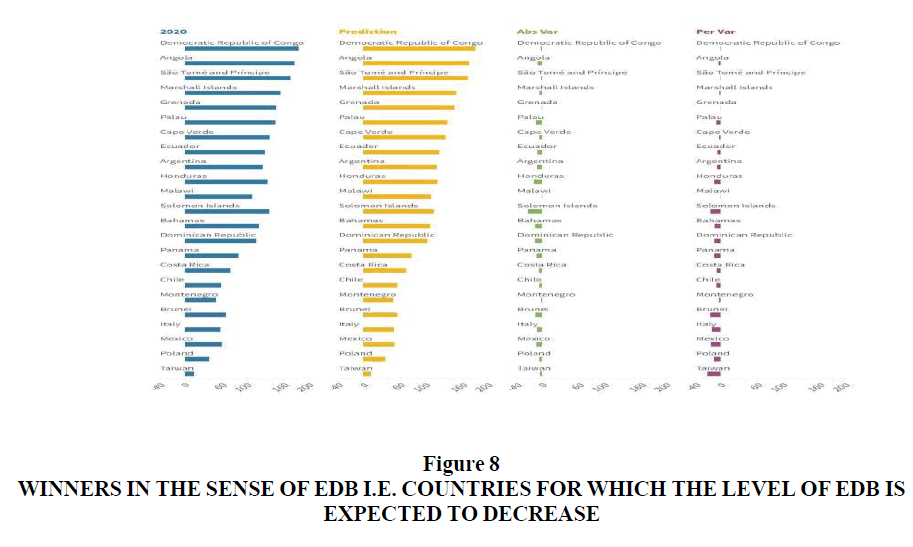
Among the winner countries, i.e. those countries for which the EDB value is expected to decrease, there are: Grenada with a value of -0.44%, Malawi with a value of -0.54%, Sao Tome and Principe with a value of -0.91%, Democratic Republic of Congo with a value of -1.03%, Marshall Islands with a value of -2.59%, Montenegro with a value of -3.04%, Cape Verde with a value of by -3.06%, Angola with -3.82%, Ecuador with -5.43%, Argentina with -5.94%, Costa Rica with -6.53%, Chile with - 7.05%, Palau with -7.16%, Bahamas with -9.7%, Dominican Republic with -10.2%, Honduras with - 10.23%, Panama with -10.31%, Poland with -10.64%, Italy with - 13.64%, Mexico with -15.56%, Solomon Islands with -16.28%, Brunei with -17.18%, Taiwan with -21.81% (Figure 8 & Figure 9).
Figure 8 Winners in the Sense of EDB i.e. Countries for which the level of EDB is Expected to Decrease
Conclusions
The originality of the article consists in the analysis of the EDB in the context of ESG. We have analysed the ESG dataset of the World Bank using different econometric techniques i.e. Panel Data with Fixed Effects, Panel Data with Random Effects, WLS and Pooled OLS. Results shows that EDB tends to be coherent in terms of ESG criteria. Furthermore we have applied a cluster analysis with the implementation of the k-Means algorithm optimized with the Elbow method. We have found the presence of four clusters. We found that the first cluster in terms of median value of EDB is made by western and pro-market society countries. But we also find that new countries are increasing their levels of EDB especially in the Asian continent i.e. China, Mongolia, Kyrgyzstan. Finally, we have made a confrontation among eight different machine learning algorithms to predict the future value of EDB and we found that the variable is linear with an expected increase of 1.66% on average for the analysed countries. Under a political point of view, we must note that all countries accept the idea that the maximization of EDB is a necessity to achieve higher levels of economic growth and development. There is not any kind of contraposition between market-based societies and non- market-based societies. In effect, even China, that is a State governed by a communist party, tries to improve EDB to attract FDI.
Declarations
Data Availability Statement
The data presented in this study are available on request from the corresponding author.
Funding
The authors received no financial support for the research, authorship, and/or publication of this article.
Declaration of Competing Interest
The authors declare that there is no conflict of interests regarding the publication of this manuscript. In addition, the ethical issues, including plagiarism, informed consent, misconduct, data fabrication and/or falsification, double publication.
Software
The authors have used the following software: Gretl for the econometric models, Orange for clusterization and network analysis, and KNIME for machine learning and predictions. They are all free version without licenses.
Acknowledgements
We are grateful to the teaching staff of the LUM University “Giuseppe Degennaro” and to the management of the LUM Enterprise s.r.l. for the constant inspiration to continue our scientific research work undeterred.
References
Anggraini, R. F., & Inaba, K. (2020). The impact of the ease of doing business on foreign direct investment. The Ritsumeikan economic review: the bi-monthly journal of Ritsumeikan University, 69(3), 393-421.
Asmara, T. T. P., Ikhwansyah, I., & Afriana, A. (2019). Ease of Doing Business: Gagasan Pembaruan Hukum Penyelesaian Sengketa Investasi di Indonesia. University Of Bengkulu Law Journal, 4(2), 118-136.
Indexed at, Google Scholar, Cross Ref
Bhandari, V., & Mohite, V. (2022). Entrepreneurship Ecosystem: An Appraisal for Sultanate of Oman Using the Ease of Doing Business Index.
Indexed at, Google Scholar, Cross Ref
Estevão, J., Lopes, J. D., Penela, D., & Soares, J. M. (2020). The doing business ranking and the GDP. A qualitative study. Journal of Business Research, 115, 435-442.
Indexed at, Google Scholar, Cross Ref
Fibra, A. (2018). The Ease of Doing Business in Indonesia. Journal of Business Strategy and Execution, 10(1), 32-51.
Haliti, B., Merovci, S., SHERPA, S., & Hetemi, A. (2019). The impact of the ease doing business indicators on foreign direct investment in the European transition economies. Ekonomika, 98(2), 19-32.
Indexed at, Google Scholar, Cross Ref
Handoyo, S. (2017). An exploratory study on the relationship of public governance and ease of doing business. APMBA (Asia Pacific Management and Business Application), 6(2), 75-88.
Indexed at, Google Scholar, Cross Ref
Indrajit, A. G. U. N. G., Jaya, V. E., van Loenen, B. A. S. T. I. A. A. N., Lemmen, C. H. R. I. S. T. I. A. A. N., van Oosterom, P. E. T. E. R., Ploeger, H. E. N. D. R. I. K., & Theodore, R. O. B. E. R. T. U. S. (2020). The role of the revised land administration domain model and spatial data infrastructure in improving ease of doing business in Indonesia. In Proceeding of the 2020 World Bank Conference On Land And Poverty. Washington DC.
Indrajit, A., Van Loenen, B., Jaya, V. E., Ploeger, H., Lemmen, C., & van Oosterom, P. (2021). Implementation of the spatial plan information package for improving ease of doing business in Indonesian cities. Land use policy, 105, 105338.
Indexed at, Google Scholar, Cross Ref
Jusufi, G., & Lubeniqi, G. (2019). An overview of Doing business in Western Balkan: The analysis of advantages of Doing Business in Kosovo and North Macedonia. ILIRIA International Review, 9(2), 168-169.
Indexed at, Google Scholar, Cross Ref
Kawung, G. M., Mintardjo, C. M., Rompas, W. I., Kojo, C., & Ogi, I. J. (2019, February). Ease of Doing Business in East Indonesian Region: Starting a Business Study in North Sulawesi Province SMEs. In 5th Annual International Conference on Accounting Research (AICAR 2018) (pp. 197-201). Atlantis Press.
Indexed at, Google Scholar, Cross Ref
Lakhan, A. B., Mumtaz, J., Keeryo, Z. A., & Dayo, S. A. (2021). Ease of Doing Business in Pakistan. PalArch's Journal of Archaeology of Egypt/Egyptology, 18(08), 4928-4934.
Malik, S., & Jyoti, S. (2018). Ease of doing business and foreign direct investment: A review paper. Pacific Business Review International, 10(12), 76-84.
Nageri, K. I. (2020). Ease of doing business and capital market development in a demand following hypothesis: Evidence from ECOWAS. Studia Universitatis Vasile Goldiş, Arad-Seria Ştiinţe Economice, 30(4), 24-54.
Indexed at, Google Scholar, Cross Ref
Nageri, K. I., & Gunu, U. (2020). Corruption and ease of doing business: Evidence from ECOWAS. Acta Universitatis Sapientiae, Economics and Business, 8(1), 19-37.
Indexed at, Google Scholar, Cross Ref
Natarajan, P., & Raza, M. (2017). An analytical investigation on ease of doing business in India. Journal of Smart Economic Growth Issn.
Nawawi, C. H., Hanif, A. V., & Sholihah, F. D. (2022). The effect of human development index, ease of doing Business, corruption, and distribution of ZIS funds on Indonesia's economic growth. Indonesian Economic Review, 2(2), 70-80.
Indexed at, Google Scholar, Cross Ref
Pertiwi, N., Ratnawati, K., & Aisjah, S. (2020). Understanding Country Risk Toward Foreign Direct Investment Moderated By Ease Of Doing Business Ranking (Study in ASEAN (Indonesia, Malaysia, Thailand, Philippines, and Vietnam)). Jurnal Aplikasi Manajemen, 18(2), 269-276.
Indexed at, Google Scholar, Cross Ref
Rumadan, I. (2020). Enforcement of Court Decision Regarding Payment of a Sum of Money in Civil Disputes to Support the Ease of Doing Business in Indonesia.
Yadav, R. K., Bagga, T., & Johar, S. (2020). E–governance impact on ease of doing business in india. PalArch's Journal of Archaeology of Egypt/Egyptology, 17(7), 6188-6203.
Received: 01-Nov-2023 Manuscript No. AAFSJ-23-14137; Editor assigned: 04-Nov-2023, PreQC No. AAFSJ-23-14137(PQ); Reviewed: 16-Dec-2023, QC No. AAFSJ-23-14137; Revised: 20-Nov-2023, Manuscript No. AAFSJ-23-14137(R); Published:28-Nov- 2023
