Research Article: 2020 Vol: 24 Issue: 5
The Economic Diversification in Saudi Arabia Under the Strategic Vision 2030
Abdelkrim A. Guendouz, Arab Monetary Fund
Saidi M. Ouassaf, King Faisal University
Abstract
The purpose of this paper is to investigate the major macroeconomic factors affecting economic diversification in Saudi Arabia, and to investigate and analyze the strategies engaged in diversifying Saudi Arabia's economy as well as to adjudge the level of success that has been achieved away from the export of oil. The empirical study carried out to analyze the diversification of the Saudi Arabian economy, using multiple regression analysis for the period 1991-2016. The results suggest a direct correlation between the economic diversification index and The Gross Domestic Product (GDP), The Gross Fixed Capital Formation (GFCF), and the percentage contribution of Foreign Direct Investment to the GDP (FDI). The non-oil GDP to GDP (NOGDP/GDP), the percentage contribution of Non-Oil Government Revenues as a proportion of total government revenues (NOGOV), and the percentage contribution of the private sector to GDP (PRIV) indicated a negative correlation with the diversification. We believe that the findings could provide a metric that policymakers can use to establish the necessary strategies to gauge the targeted economic diversity as a pillar of the Vision 2030, and to ensure a strong and sustainable economy.
Keywords
Diversification, Economic Diversity, Saudi Arabia, 2030 Vision, Economic Development, Herfindahl Hirschman Index.
Introduction
Although considered as the largest economy in the Middle East region and a member of the Group of Twenty (G20), the Saudi economy still encounters many challenges in a turbulent regional economic environment. Its dependence on a limited source of income amongst which oil is the ranked the highest is one of the most severe challenges facing her economy. The export of energy products constitutes over 90% of all Saudi exports. A situation that puts the economy into dilemma: maintaining and diversifying its economy and its export markets while countering an increasing competitor in the energy markets. Although, the increase of oil prices and revenue (the period of 2003-2013) enhanced the creditworthiness of the Saudi economy and improved the welfare of its people, it impact have not created an economy that is resilient to economic and financial shocks. Thus, in the long term, the Kingdom’s economy cannot increase beyond the revenues from it oil.
To overcome this vulnerable economic situation, the 2030 vision was adopted, and it emphasized on economic diversification as a vital step towards ensuring economic sustainability in Saudi Arabia. Even though, the nine-quintal programs tend to diversify the economy, none of them better established the pillars of such shift as done in the vision 2030, as mentioned clearly in its goals: “To raise the share of non-oil exports in non-oil GDP from 16% to 50%” (Vision 2030 kingdom of Saudi Arabia). With almost four years of the vision already gone, and more than one decade still at the hand, there is need for the policymakers to reassess the goals of the vision 2030, and to decide the achievability within the period, or make further adjustments and correction to the initial target.
There are only a few researches that has used quantitative models to analyze the diversity of the Saudi economy, especially after the adoption of the 2030 Vision. This paper makes a detailed contribution for understanding the current and future trends and the shifts of the Saudi economy in several ways. First, we measured and analyzed the diversification of the Saudi’s economy and integrated the vision 2030 as a road map towards the new economy. Secondly, we used the results of the analysis to propose a framework for injecting new dynamism into the economy.
The paper is structured as follows: the next session discusses the theoretical background of economic diversification with emphasis on its interrelation with economic growth. Section 3 reviews the recent literature of economic diversification in Saudi Arabia especially in empirical studies. Section 4 presents an overview of the data collection, the variables and the empirical model including the main discussion of the results. Section 5 concludes and reveals some of the policy implications.
Theoretical Background
Economic Diversification, Source Curse, and Economic Growth
Depending on the context, economic diversification can be used in several perspectives. From an income perspective, it means the diversity of income sources. In production, it shows the production process of a growing range of economic outputs. It also refers to the complexity and diversity of markets for exports when used with respect to foreign trades. In this paper, by using the term economic diversification, we mean first, income diversity, which can be expressed as the variation of income across different income sources, and that a country should not depend upon a unique or a small number of sources for its income. Secondly, a country that has a strong manufacturing base, a vibrant services sector, a burgeoning natural resource sector, and a welldeveloped agricultural sector that is quite diverse.
According to literatures, there are two types of diversification: the vertical and the Horizontal diversification. From a corporate view, horizontal diversification is the same as Integration, in which two similar or dissimilar businesses are merged together. It enlarges the scope of operations and, thus, provides economies of scale. In vertical diversification, the same business line joins with its backward or forward linkages. New products are complementary to the existing products, and although, it enlarges the operations at different stages of production, it does not provide economies of scale, however, it leads to specialization in production and sales. In macroeconomics, the vertical and horizontal diversification is expressed as the extensive and the intensive margin. The former means diversifying the range of traded goods; in the latter, traded volumes of old goods are increased (Persson, 2013; Persson et al., 2016).
According to (Gylfason, 2017), the benefits of economic diversification on efficiency and growth can be viewed through the widely observed inverse relationship between heavy dependence on a few natural resources and the long-run economic growth of some countries, sometimes referred to as ‘resource curse’. This relationship is consistent with the view that economic diversification is good for long-run growth.
In the economic literatures, it is expected that the more economically complex a country, the more likely that it will have a low level of volatility in its GDP. This is not so far from the idea of diversification in financial theory (Portfolio theory), in which unsystematic risk is reduced or eliminated by diversification of assets within the portfolio. This will end up reducing the overall volatility of the portfolio.
Having a diverse economy has long been thought to play a key role in sustainable economies, and accordingly has enhanced the nation’s standard of living by creating wealth and jobs, encouraging the development of new knowledge and technology, and helping to ensure a stable political climate. For these reasons, a diverse economy is the goal of every nation in the world.
Saudi Economy in Light of 2030 Vision: What Can Policymakers Do?
With its $684 Billion USD Gross Domestic Products by the end of 2017, Saudi Arabian economy is the largest in the MENA region and one of the largest economies in the world. However, some economic factors had made the Saudi economy to be ranked among developing economies of the world, among these factors is it dependence on oil, and the strong government control over major economic activities. Given the importance of the oil sector and the uncertainty in the oil markets, fluctuations in the oil price will continuously impact seasonal disturbance to the Saudi’s economy. The main cause of such fluctuation which also faces other oil-exporting countries, is their lack of price control, which thus, represents a major threat to sustained economic growth. Therefore, economic diversification is crucially important for these countries in ensuring their achievement of sustainable economic growth. In fact, there is an increasing number of empirical studies supporting undesirable effects of oil fluctuations on macroeconomic variables (Mehrara, 2008)
Lately the Saudi government has acknowledged that the objective of long-term economic sustainability is difficult to attain with dependence on a single or limited source of revenue. Therefore, a long-term economic restructuring had been started with the aim to overcome the dependence on oil exports and to accelerate structural diversification.
In fact, since the first development plan in 1970, economic diversification has always been a dominant objective of all the development plans; however, the dependence on oil had remained critical, and as a result, the decline in oil prices in the last few years has significantly affected the government’s budget. For instance, there was a significant reduction in fuel subsidy, salaries of government employees and scholarship programs, etc.
Specificity of Economic Diversification for Saudi Economy
When the Saudi Arabian’s government unveiled the Saudi Vision 2030, it was considered as a long-term economic blueprint of Saudi Arabia. The Vision is a package of social and economic policies that are designed to free the kingdom from its dependence on oil exports and to build a prosperous and sustainable economic future by focusing on the country’s strength and policies (Vision 2030 kingdom of Saudi Arabia).
The Vision is built around three themes: a vibrant society, a thriving economy and an ambitious nation. By 2030, the SMEs is estimated to account for 35% of GDP from the current 20%, and the private sectors will contribute 65% of the GDP from its present 40%. Also, the vision targets to increase foreign direct investment from 3.8% to the international level of 5.7% of GDP.
A very important economic goal in direct relation with this study is raising the share of non-oil exports in non-oil GDP from 16% to 50% and increasing the non-oil government revenues from USD 45 Billion to USD 267 Billion. These propositions if achieved would advance Saudi Arabia’s economy from currently the 19th largest economy in the world into the top 15.
The Saudi economy has huge potentials to achieve the goals for vision 2030. According to (McKinsey 2015), by 2030 the GDP could double again after its first jump during the period from 2003-2013. It is estimated that eight sectors other than the oil sector will generate more than 60% of the growth and create jobs; these sectors are Mining and Metals, Petrochemicals, Manufacturing, Retail and wholesale trade, Tourism and hospitality, Finance, Construction, Health Care. The important factors that the policymakers should take into consideration are: First, the diversification must be outside oil, that is, the expansion requires activities outside the oil sector. Besides this, it is necessary to spend more on human capital, education, training and health to the extent that they should contribute to higher output and productivity. Secondly and most importantly, the diversification should be regarded as a dynamic concept, which means the process should cover both the short- and long-term objectives of economic diversification (i.e. In the long run the share of oil revenues in GDP should not decrease because of the depletion of oil; but more importantly because of the growth in non-oil GDP). Thirdly, the Gross Domestic Product (GDP) should be distributed across a wide variety of economic sectors, such as agriculture or manufacturing, service.
Literature Review
The determinants of economic diversification and the interrelationships between economic diversification and macroeconomic variables (e.g. economic growth) are discussed in different ways in literatures.
Economic diversification is critical for the creation of a sustainable economy (Sohail, 2012). Having a diverse economy based on an array of sectors plays a key role in the sustainability of an economy. According to (Gozgor & Can, 2016); increasing the product diversity of export will help to stabilize the export revenues and to spur earnings from exports. In short, the product diversification of exports really matters in other to avoid external shocks and to sustain economic growth.
One of the well-researched area of diversification is the relation of diversification with economic growth. A trend of research in this field is in testing the export-led growth hypothesis. According to the export-led growth hypothesis, an expansion in exports leads to an increase in output, and this will result in a multiplier effect to promote economic growth. Therefore, some researchers empirically tested whether such mechanism exists in a country with respect to the relationship between the diversification of exports and the real income growth. (Abosedra & Tang, 2018; Ali & Li, 2018; Konstantakopoulou, 2017; Kristjanpoller et al., 2016; Salam & Egeli, 2017)
According (Aker & Aghaei 2019), there is a strong association between economic diversification and development and export diversification is a by-product of economic diversification.
Another important trend in relation to diversification in literatures is the “Resource Curse”. According to this viewpoint, although natural resources are a blessing to any country, it can become a curse when solely relied on as the main sources of income. (Elheddad, 2016) examined whether the presence of natural resources discouraged foreign direct investment (FDI) or not in GCC countries, using panel data analysis for six oil dependent countries during 1980-2013 and applying several econometrics techniques. He suggests that natural resources measured by oil rents have a negative association with FDI inflows; this negative impact is even more robust when other determinants of FDI are included.
In an unprecedented study led by (Abouchakra et al., 2008) in GCC countries, G7, and some established economies, the study identified a clear link between economic diversification and sustainable growth. It also showed that diversification could reduce the economic volatility by increasing real activity performance, and due to this association between the level of diversification and economic growth, it is beneficial to investigate the factors influencing economic growth as potential elements that affect the level of economic diversification.
With regards to Saudi Arabia, there are a few papers that have used quantitative models to analyze the economic diversification. In a recent research to study economic diversification in Saudi Arabia by (Yamada, 2018), he researcher argued that diversification in Saudi Arabia to date has largely involved "production with rentier characteristics" - a mode of production that relies on oil-driven advantages such as energy- and capital-abundance and foreign labor. The kingdom's previous attempts to invest in human capital development in order to create labor-intensive sectors for local citizens were hampered by institutional fragmentation in the education sector and the legacy of rentierism. While the current government is integrating the school system and training programs, capacity building remains the major challenge in the workforce of Saudi Arabia.
(Banafea & Ibnrubbian, 2018) in their work emphasized the efforts of the Saudi government to diversify the economy using a descriptive analysis through nine development plans covering 45 years period (from 1970 to 2014). The relationship between Instability of private gross domestic product and oil price variance, and the relative contribution of private and public sectors to GDP were used as economic diversity measures. The investigated concluded that only in the last two development plans has the Saudi government achieved some success in moving towards diversification, although the process of diversification was slow?paced. The research suggested there should be improvements in the legislative framework to stimulate the private sector as the main pillar of economic diversification. According to (Albassam, 2015), even though the Saudi governments have issued ten development plans since 1970, with the view of economic diversification; oil is still the main revenue driving the economy. The study examines the government's efforts to diversify the economy using four variables: oil share of gross domestic product (GDP), share of private sector in GDP, oil exports as a percentage of the country's exports, and oil revenues as a percentage of total revenues. The results showed there is an urgent need to fully consider pursuit of economic diversification as a tool for better governance. Furthermore, (Algowear Almestneer, 2018) investigated the several factors that might enhance Saudi Arabia’s independence from Crude oil as the only source of income and thus, engender economic diversity of its sources of revenue. The study also constructed a tailored diversification model of the Saudi Economy. The model provides a better rationale in designing the Kingdom’s trade policies and one-step forward to diversify the Saudi’s economy by stimulating non-oil sectors through trade openness.
Study by (Alghamedi, 2014 discusses the heavy dependence of Saudi Arabia on oil revenue. Heavy dependence on oil income at the exclusion of developing other sector that could boost national revenue is a risk, and threatens not only Saudi Arabia's economy, but also that of other Gulf countries. Although there have been several attempts in the last three decades to diversify the sources of revenue, there seem to be no significant changes. The main reasons contributing to the lack of diversification are; high entrance barriers for new businesses, government bureaucracy, and lack of commitment by the government; as a result high unemployment rate has pervaded Saudi Arabia.
According to (Khorsheed, 2015), Saudi Arabia represents a rare case in which capital factor formation does not impose any constraint on development. The kingdom has focused on technology transfer to compensate for a paucity of indigenous technological capabilities. Since mid-2003, Saudi Arabia has experienced a strong economic performance which is primarily due to a combination of high oil prices, increased oil production and earning from oil-based export. Increasing demand for oil in addition to the structural reforms and stable macroeconomic policymaking, has enabled a sustained growth momentum. However, despite the several attempts at economic diversification, the Saudi economy still remain heavily dependent on oil and petroleum-related industries including petrochemicals and petroleum refining.
Data and Methodology
Variables and Data
Although diversification measures have evolved over the years and economists have developed many indexes for measuring Economic Diversification, there is no consensus among them on which is the most adequate, since each index has its strengths and weaknesses. Economic diversity measures include the Herfindahl-Hirschman Index (HHI), the Coefficient of variation of sector shares, the max-min spread, the log-variance of sector shares (LOG-VAR), and the Gini coefficient for the inequality of sector shares.
To measure the level of economic diversification in Saudi Arabia, we used the Normalized Hirschman Index. This is done using the following formula:
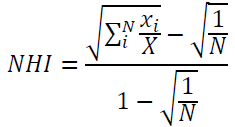
Where: (xi) is the added value of the ith sector. The sectors that are included to construct the index are (Agriculture, Forestry & Fishing), (Mining & Quarrying-Other than Petroleum & Natural Gas), (Manufacturing-Other than Petroleum Refining), (Electricity, Gas and Water), (Construction), (Wholesale & Retail Trade, Restaurants & hotels), (Transport, Storage & Communication), (Finance, Insurance, Real Estate & Business Services, Ownership of Dwellings), (Community, Social & Personal Services), (Producers of Government Services), (OIL and related sectors).
(X) is the GDP of Saudi Arabia. Therefore, xi/X is the ith sector’s value-added share of the country’s total added value of all sectors. N is the total number of economic sectors. The value of the index ranges between zero and one. As the value of the index approaches to one, the economy of the country becomes less diversified.
The NHI is a used as a measure of concentration, where larger values typically indicate more concentration, which means maximum diversification in the NHI exists when revenues are evenly distributed among each revenue source.
We chose the dependent variables in a manner that we believe it applied to the Saudi Arabian economy. Table 1 shows the variables of the study and its description.
| Table 1 Definition and Measurement of Variables | ||
| Variables | Definition | Measurement |
| Dependent Variable | ||
| The Economic Diversification Index (Normalized Herfinadhl-Heirscman Index) | Measures the concentration of the economy toward a sector | 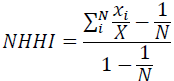 |
| Independent Variables | ||
| The Gross Domestic Product (GDP) | Indicates the size of the economy. | The natural logarithm of GDP: Ln (GDP) |
| The non-oil GDP to GDP (NOGDP/GDP) | The Percentage contribution of non-oil sector to GDP. | 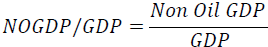 |
| the percentage contribution of non-oil export-to-total exports (NOExp/Exp) | which indicates diversi?cation when non-oil exports increase | 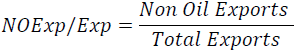 |
| The Total Imports to GDP (IMP) | Imports of goods and services as a percentage of GDP. | 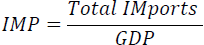 |
| The percentage contribution of Non-Oil Government Revenues as a proportion of total government revenues (NOGOV) | Indicates the degree of government revenues dependency on oil. | 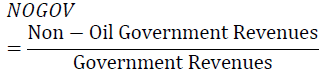 |
| The Gross Fixed Capital Formation (GFCF) | a measure of gross net investment (acquisitions less disposals) in fixed capital assets by enterprises, government and households within the domestic economy, during an accounting period such as a quarter or a year | The natural logarithm of GFCF: Ln (GFCF) |
| The percentage contribution of Foreign Direct Investment to the GDP (FDI) | Measures the total level of direct investment at a given point in time, usually the end of a quarter or end of a year. | 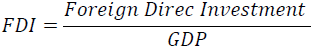 |
| The GDP Growth at constant prices (2010=100) | It shows how fast the country’s economy is growing. It compares real GDP from one year to the next. | The growth Rate of GDP |
| The percentage contribution of the private sector to GDP (PRIV) | Measures the Private Sector's Contribution as a percent of GDP | 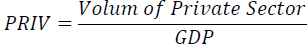 |
To achieve the objective of the study, secondary time series data from the period of 1996 to 2016 was obtained from the General Authority for Statistics. The next part of this section shows the results of this study and discussion.
Findings and Discussions
The Concentration of The Saudi Economy Toward A Sector: Using the Economic
Diversification Index (NHHI)
The NHHI of each Saudi economy under study, was drawn up during the period from 1991- 2016 Table 2 & Figure 1.
| Table 2 The Descriptive Statistics for NHHI | |||||
| Variable | Minimum | Maximum | Mean | Std. Deviation | c.v. % |
| NHHI | 0.05260 | 0.23640 | 0.1177577 | 0.05131694 | 43.5784 |

Figure 1 The NHHI of each Saudi Economy Under Study from the Period of 1991-2016
Clustering the Observations of NHHI
We used clustering or classification to decide which two or more populations an observation or set of observations belongs to. Many clustering algorithms can be used for the classification, here we used the K- Means Clustering and obtained the following Table 3 results:
| Table 3 Classifications of the Type of the Economy’s Concentration in Saudi | |||
| The concentration | Frequency | Percent | Mean of NHHI |
| high | 19 | 73.1 | 0.09095 |
| middle | 7 | 26.9 | 0.19053 |
| Total | 26 | 100.0 | 0.1177 |
The Predictive Variables
Ratios provide a relatively simple means of examining the concentration of the Saudi’s economy. The predictive variables are the financial ratios for concentration of the Saudi economy, and are defined as follows Table 4:
| Table 4 The Descriptive Statistics for Predictive Variables | |||||
| Variable | Minimum | Maximum | Mean | Std. Deviation | c.v. % |
| Ln (GDP) | 11.79 | 13.54 | 12.5658 | 0.65592 | 5.21988 |
| NOGDP/GDP | 45.03 | 75.38 | 59.9346 | 7.92009 | 13.2146 |
| NOExp/Exp | 6.60 | 25.81 | 12.9935 | 4.43228 | 34.1116 |
| IMP | 14.60 | 26.70 | 19.1501 | 3.24966 | 16.9694 |
| NOGOV | 7.44 | 43.51 | 19.5661 | 9.04606 | 46.2333 |
| Ln (GFCF) | 10.03 | 12.34 | 11.0969 | 0.83299 | 7.50651 |
| FDI | 0.03 | 8.50 | 1.8477 | 2.51796 | 136.279 |
| (GRGDP) | -3.76 | 15.01 | 3.4258 | 4.38362 | 127.96 |
| PRIV | 31.40 | 50.76 | 39.1117 | 4.60617 | 11.7769 |
The correlation between the concentration of the Saudi economy index (NHHI) and the predictive variables in the study Table 5:
| Table 5 The Correlation Coefficient Matrix Between NHHI and Other Variables | |||||||||
| Ln(GDP) | NOGDP/ GDP |
NOExp/ Exp |
IMP | NOGOV | Ln (GFCF) | FDI | (GRGDP) | PRIV | |
| NHHI | 0.577** | -0.970** | -0.261 | 0.243 | -0.865** | 0.513** | 0.656** | 0.339 | -0.863** |
| Ln(GDP) | -0.435* | 0.556** | 0.682** | -0.560** | 0.991** | 0.521** | 0.167 | -0.125 | |
| NOGDP/GDP | 0.435* | -0.118 | 0.906** | -0.362 | -0.593** | -0.333 | 0.940** | ||
| NOExp/Exp | 0.452* | 0.274 | 0.602** | 0.032 | -0.119 | 0.673** | |||
| IMP | -0.199 | 0.732** | 0.401* | 0.092 | 0.112 | ||||
| NOGOV | -0.492* | -0.549** | -0.294 | 0.787** | |||||
| Ln (GFCF) | 0.545** | 0.110 | -0.044 | ||||||
| FDI | -0.007 | -0.431* | |||||||
| (GRGDP) | -0.381 | ||||||||
*. Correlation is significant at the 0.05 level (2-tailed).
There is a direct correlation between the NHHI and each of the following variables: The Gross Domestic Product (GDP); the Gross Fixed Capital Formation (GFCF); and the percentage contribution of Foreign Direct Investment to the GDP (FDI). These results are consistent with the theory as well as with the findings in literatures, as the GDP growth means the growth and expansion of most, if not all the sectors, and hence more economic diversification. In addition, an increase in expenditure on capital goods, construction and infrastructure in the Kingdom means that there is a revenue mobility in most sectors of the country, leading to greater economic diversification. Finally, the growth of foreign direct investment in sectors such as real estate, chemicals, coal, oil, natural gas and tourism has positive impacted these sectors leading to greater economic diversification diversification (The Arab Investment and Export Credit Guarantee Corporation (Dhaman, 2018).
There is an inverse correlation between the NHHI and the non-oil GDP to GDP (NOGDP/GDP), the percentage contribution of Non-Oil Government Revenues as a proportion of total government revenues (NOGOV), and the percentage contribution of the private sector to GDP (PRIV). The inverse relationship between the index of diversity and the ratio of non-oil GDP to non-oil revenues, and the contribution of the private sector to the GDP indicates that the private sector does not contribute much to the GDP due to its orientation towards the commercial sector. The reason for the lack of growth in the non-oil GDP and non-oil revenues in the Kingdom is that the government had taken some measures that have had a negative impact on the non-oil sectors in the Kingdom.
There is no relationship between the NHHI and the percentage contribution of non-oil export-to-total exports (NOExp/Exp), the Total Imports to GDP (IMP), and the GDP Growth at constant prices (2010=100) (GRGDP). These results are due to the large proportion of consumption goods imported into the Kingdom (e.g., More than 25% of importations are food commodities).
To test of the effect of concentration of the type of economy (high – middle) on the efficiency of financial performance for the predicative variables, we must test the following hypothesis:
H0: There is no difference between the mean of the predicative variables and concentration in the types of economy in Saudi Arabia
H1: There is a difference in H0
We got the following results:
From Table 6, we concluded that there is a significant difference between the mean for predictive variables in the concentration of the types of economy in Saudi for the following variables in which the p-value is less than 0.05:
| Table 6 The Results of T- Test for Concentration of the Types of Economy in Saudi for the Predicative Variables | ||||
| Classification the concentration of the Saudi economy | Mean | t | sig | |
| Ln (GDP) | high | 12.3485 | -3.28100 | 0.00300 |
| middle | 13.1554 | |||
| NOGDP/GDP | high | 63.6858 | 6.43700 | 0.00000 |
| middle | 49.7526 | |||
| NOExp/Exp | high | 13.3595 | 0.68600 | 0.49900 |
| middle | 12.0000 | |||
| IMP | high | 18.5132 | -1.709 | 0.10000 |
| middle | 20.8789 | |||
| NOGOV | high | 23.0960 | 4.25300 | 0.00000 |
| middle | 9.9851 | |||
| Ln (GFCF) | high | 10.8507 | -2.80400 | 0.01000 |
| middle | 11.7654 | |||
| FDI | high | 1.0937 | -2.85200 | 0.00900 |
| middle | 3.8941 | |||
| (GRGDP) | high | 2.8679 | -1.07200 | 0.29400 |
| middle | 4.9400 | |||
| PRIV | high | 41.0262 | 4.77900 | 0.00000 |
| middle | 33.9154 | |||
1. The Gross Domestic Product (GDP)
2. The non-oil GDP to GDP (NOGDP/GDP)
3. The percentage contribution of Non-Oil Government Revenues as a proportion of total government revenues (NOGOV)
4. The percentage contribution of Foreign Direct Investment to the GDP (FDI)
5. The percentage contribution of the private sector to GDP (PRIV)
Factor Analysis
The principle application of factor analytic techniques is to reduce the number of variables and to detect the structure in the relationships between the variables; that is to classify the variables. Therefore, we applied factor analysis as a data reduction or structure detection method.
Using the SPSS statistical package, we performed the factor analysis for the data predictive variables for the concentration of Saudi economy which consists of nine ratios, and the following results were obtained:
The data can be reduced to two factors when we apply the extraction method of the principle component analysis and Varimax with Kaiser Normalization rotation method, which is the most popular orthogonal technique as shown below.
The following Table 7 shows us the rotated component and the Component score coefficient for each variable with related factor and the percent of variance.
| Table 7 The Rotated Component and Component score Coefficient for each Variable with Related Factor | ||||
| Factor | % of Variance | Variable | Rotated Component | Component Score Coefficient |
| F1 | 39.89 | NOGDP/GDP | 0.971 | 0.270 |
| NOGOV | 0.883 | 0.238 | ||
| FDI | -0.540 | -0.129 | ||
| (GRGDP) | -0.411 | -0.116 | ||
| PRIV | 0.975 | 0.287 | ||
| F2 | 38.05 | Ln(GDP) | 0.934 | 0.267 |
| NOExp/Exp | 0.732 | 0.246 | ||
| IMP | 0.818 | -0.136 | ||
| Ln (GFCF) | 0.965 | 0.0.281 | ||
From the above Table 7, we can conclude:
The first factor (F1) is composed of 5 predictive variables which can interpret 39.89% of the variance while the second factor (F2) is composed of 4 predictive variables which can interpret 38.05% of the variance
To test the effect of the concentration of the types of economy in Saudi (high – middle) on the efficiency of factors for predicative variables, we will test the following hypothesis:
H0: There is no difference between the mean of the factors in the concentration of the types of economy in Saudi
H1: There is difference in H0
The following results were obtained:
From Table 8, we concluded that there is a significant difference between the mean of the factors in the concentration of the types of economy in Saudi for which the p-value is less than 0.05
| Table 8 The Results of the T- Test for the Concentration of the types of Economy in Saudi for the Factors | ||||
| Classification of the concentration of the types of economy in Saudi. | Mean | t | sig | |
| f1 | high | 0.4149162 | 4.763 | 0.000 |
| middle | -1.1262011 | |||
| f2 | high | -0.2173105 | -2.699 | 0.013 |
| middle | 0.5898428 | |||
Application of the Discriminant Analysis
Our dependent variable is categorical "Clustering the observations of NHHI". We have two clusters (high middle).
We have two cases for the independent variables for examining the concentration of the Saudi economy.
1. The nine predictive variables
2. The two factors
Therefore, the discriminant function for concentration of the Saudi economy in each case is:
A goodness of fit for discriminant analysis model:
Many analytic measures can be used to determine the efficiency of the discriminant analysis model as follows:
1. Wilk's Lambda: The value of Wilk's Lambda statistic for the discriminant functions is 0.136 and 0.381 respectively, indicating differences among groups of the clusters for concentration of the Saudi economy.
2. Chi- Square test: This was used to test the significance of the discriminant analysis model, and the following results were obtained Table 9:
| Table 9 Chi- Square Test | |||
| Discriminant Analysis Model | Chi-Square Value | df | Sig. |
| DF1 | 38.854 | 9 | 0.000 |
| DF2 | 222.211 | 2 | 0.000 |
The Sig. of x2 test is 0.000 that is less than 0.05, indicating a significance of the discriminant analysis model and that it depends on it to predict the classification for concentration of the Saudi economy.
1. Canonical Correlation: Canonical correlation analysis is used to identify and measure the associations between two sets of variables. It results showed that the correlation between the value of the discriminant function and the independent variables in the function is 0.929 and 0.787 respectively. Indicating a strong relationship between them.
2. Percent of correctly Classification: The ability of discriminant functions in our discriminant analysis model to correctly Classification the economy according to measures the concentration of the economy toward a sector (high – middle) are 100% and 88.5% respectively.
Therefore, the discriminant analysis model has significant statistical ability to predict with economic situation of the concentration for the Saudi economy.
Prediction of the dependent variable NHHI:
We applied the stepwise regression model to predict the dependent variable for NHHI in many cases for the concentration of Saudi economy; therefore, we have the following models:
Model I: the concentration of Saudi economy (high)
Model (Ia): the predicative variables are the financial ratios
Model (Ib): the predicative variables are factors
Model II: the concentration of Saudi economy (middle)
Model (IIa): the predicative variables are the financial ratios
Model (IIb): the predicative variables are factors
Model III: the concentration of Saudi economy (general)
Model (IIIa): the predicative variables are the financial ratios
Model (IIIb): the predicative variables are factors
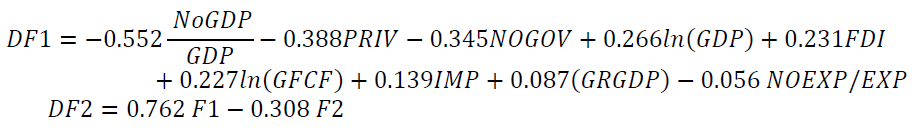
Model (Ia): the concentration of Saudi economy (high) and the predicative variables are the financial ratios
The results as shown in Appendix 2-a indicate that the value of the F test is 536.842 with a sig. of 0.000, which is less than 0.05 indicating the significance of the model as given below:
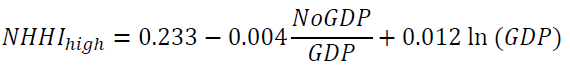
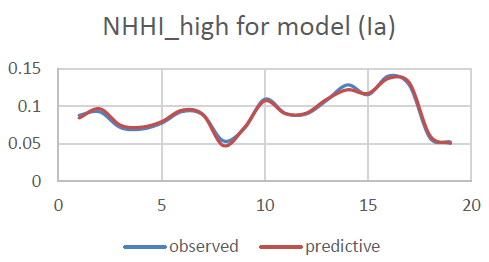
Where the value of the R-square is 0.985 indicating that this model can interpret 98.5% of the change in the value of the NHHI_high. NoGDP/GDP can interpret 90.8% and ln(GDP) 7.7%. Model (Ib): the concentration of Saudi economy (high) and the predicative variables are the factors:
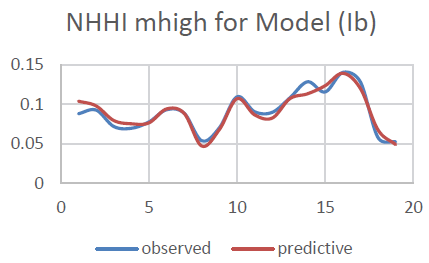
The results as shown in Appendix 3-a indicate that the value of the F test is 90.445 with a sig. of 0.000, which is less than 0.05 indicating the significance of the model as given below:

Where the value of the R-square is 0.919 indicating that this model can interpret 91.9% of the changes in the value of the NHHI_high. F1 can interpret 74.9% and F2 17%.
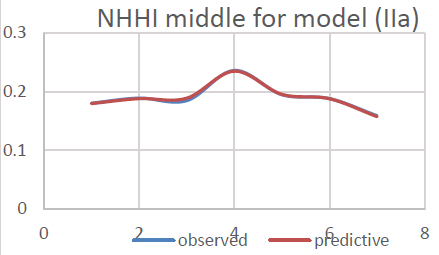
Model (IIa): the concentration of Saudi economy (middle) and the predicative variables are the financial ratios
The results as shown in Appendix 4-a indicate that the value of the F test is 278.707 with a sig. of 0.000, which is less than 0.05 indicating the significance of the model as given below:
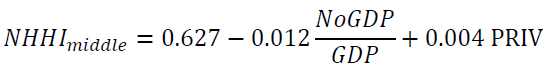
Where the value of the R-square is 0.993 indicating that this model can interpret 99.3% of the changes in the value of the NHHI_middle. NoGDP/GDP can interpret 96.8% and PRIV 2%.
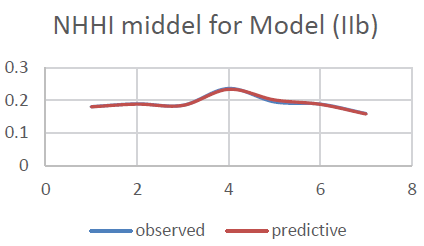
Model (IIb): the concentration of Saudi economy (middle) and the predicative variables are the factors:
The results as shown in Appendix 5-a indicate that the value of the F test is 129.657 with sig. of 0.000, which is less than 0.05 indicating the significance of the model as given below:

Where the value of the R-square is 0.985 indicating that this model can interpret 98.5% of the changes in the value of the NHHI_middle. F1 can interpret 85.2% and F2 is 13.3%.
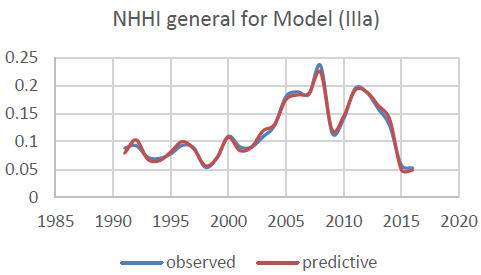
Model (IIIa): the concentration of Saudi economy (general) and the predicative variables are the financial ratios.
The results as shown in Appendix 6-a indicate that the value of the F test is 496.287 with a sig. of 0.000, which is less than 0.05, indicating the significance of the model as given below:

Where the value of the R-square is 0.985, indicating that this model can interpret 98.5% of the changes in the value of the NHHI_general. NoGDP/GDP can interpret 94.1%, NoGov 4%and ln(GDP) 0.4%.
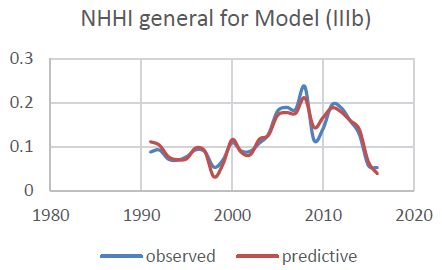
Model (IIIb): the concentration of Saudi economy (general) and the predicative variables are the factors:
The results as shown in Appendix 7-a indicate that the value of the F test is 158.742 with a sig. of 0.000, which is less than 0.05, indicating the significance of the model as given below:

Where the value of the R-square is 0.932, indicating that this model can interpret 93.29% of the changes in the value of the NHHI_general. F1 can interpret 81.9% and F2 is 11.3%.
Conclusion and Policy Implications
In this study we used the Normalized Herfindahl Hirschman Index (NHHI) as a proxy for economic diversification to analyze the extent of diverseness of the Saudi economy. The main aim of the study is to measure and define the determinants of the Saudi Economy diversity, using a multiple regression analysis for the period 1991-2016. The results suggest a direct correlation between the economic diversification index and the Gross Domestic Product (GDP), the Gross Fixed Capital Formation (GFCF), and the percentage contribution of Foreign Direct Investment to the GDP (FDI). Theoretically, it is supposed that the growth of those indicators, leads to more diversification in the economy. This appears relatively true in the case of Saudi economy.
Also, the non-oil GDP to GDP (NOGDP/GDP), the percentage contribution of Non-Oil Government Revenues as a proportion of total government revenues (NOGOV), and the percentage contribution of the private sector to GDP (PRIV) showed negative correlations with the diversification.
We believe these findings could provide a metric that policymakers can use to gauge the targeted economic diversity as a main pillar for Vision 2030 and ensure a strong and sustainable economy.
This evidence clearly shows that policymakers must focus on some specific strategies, which among them is reduced reliance on government spending, as well as rationalizing government spending using efficiency and performance indicators, foster the private sector, as well as encourage foreign direct investment.
Other strategies to promote diversification should contain encouraging exportations beside oil, especially high-value-added goods and services, enhancing productivity and competitiveness of the economic base. In addition, the economic shift will consist on more productive workforce by increasing employment and eliminating the mismatch between skills and the needs of the labor market, boosting competition and openness to foreign investment and trade with the support of the private sector.
Even though these findings could provide a firm reminder to Saudi policymakers on essential keys to build a strong, diversified, and sustainable economy, there are other issued that we think need to be handled in future researches, such as:
1. The relationship between economic diversity and sustainability.
2. How to adopt effective strategies that contribute to the transition from an oil-based economy to an economy based on diversified sources of income.
3. How to achieve vertical and horizontal integration of the oil sector and other industrial sectors to create added value especially for the manufacturing sector.
4. Improving the business environment within the Kingdom (investment climate) to attract foreign investments.
5. Encouraging partnerships between research centers and the economic sector.
It is very important to acquire information on the experiences of other countries with sustainable economy; the core ingredients of successful economic diversification strategies include infrastructure and human capital investments, environment and policies conducive to private sector growth and the development of sophisticated non-oil export industries.
Appendices
| Appendix 1 Predictive Performance of Models | |
| Model (Ia) | Model (Ib) |
 |
 |
| Model (IIa) | Model (IIb) |
 |
 |
| Model (IIIa) | Model (IIIb) |
 |
 |
| Appendix 2 Model (Ia): The Concentration of Saudi Economy High and the Predicative Variables are the Financial Ratios | |||||||||||||||||||||
| Variables Entered/Removeda,b | |||||||||||||||||||||
| Model | Variables Entered | Variables Removed | Method | ||||||||||||||||||
| 1 | NOGDP/GDP | . | Stepwise (Criteria: Probability-of-F-to-enter <= 0.050, Probability-of-F-to-remove >= 0.100). | ||||||||||||||||||
| 2 | Ln(GDP) | . | Stepwise (Criteria: Probability-of-F-to-enter <= .050, Probability-of-F-to-remove >= 0.100). | ||||||||||||||||||
| a. classification the concentration of the Saudi economy = high b. Dependent Variable: NHHI |
|||||||||||||||||||||
| Model Summaryc,d | |||||||||||||||||||||
| Model | R | R Square | Adjusted R Square | Std. Error of the Estimate | |||||||||||||||||
| 1 | 0.953a | 0.908 | 0.903 | 0.00800494 | |||||||||||||||||
| 2 | 0.993b | 0.985 | 0.983 | 0.00329967 | |||||||||||||||||
| a. Predictors: (Constant), NOGDP/GDP b. Predictors: (Constant), NOGDP/GDP, Ln(GDP) c. classification the concentration of the Saudi economy = high d. Dependent Variable: NHHI |
|||||||||||||||||||||
| ANOVAc,d | |||||||||||||||||||||
| Model | Sum of Squares | df | Mean Square | F | Sig. | ||||||||||||||||
| 1 | Regression | 0.011 | 1 | 0.011 | 168.151 | 0.000a | |||||||||||||||
| Residual | 0.001 | 17 | 0.000 | ||||||||||||||||||
| Total | 0.012 | 18 | |||||||||||||||||||
| 2 | Regression | 0.012 | 2 | 0.006 | 536.842 | 0.000b | |||||||||||||||
| Residual | 0.000 | 16 | 0.000 | ||||||||||||||||||
| Total | 0.012 | 18 | |||||||||||||||||||
| a. | |||||||||||||||||||||
| Coefficientsa,b | |||||||||||||||||||||
| Model | Unstandardized Coefficients | Standardized Coefficients | T | Sig. | |||||||||||||||||
| B | Std. Error | Beta | |||||||||||||||||||
| 1 | (Constant) | 0.377 | 0.022 | 17.034 | 0.000 | ||||||||||||||||
| NOGDP/GDP | -0.004 | 0.000 | -0.953 | -12.967 | 0.000 | ||||||||||||||||
| 2 | (Constant) | 0.233 | 0.018 | 12.804 | 0.000 | ||||||||||||||||
| NOGDP/GDP | -.004- | .000 | -.952- | -31.429- | .000 | ||||||||||||||||
| Ln(GDP) | .012 | .001 | .278 | 9.168 | .000 | ||||||||||||||||
| a. classification the concentration of the Saudi economy = high b. Dependent Variable: NHHI |
|||||||||||||||||||||
| Excluded Variablesc,d | |||||||||||||||||||||
| Model | Beta In | t | Sig. | Partial Correlation | Collinearity Statistics | ||||||||||||||||
| Tolerance | |||||||||||||||||||||
| 1 | Ln(GDP) | 0.278a | 9.168 | 0.000 | 0.917 | 1.000 | |||||||||||||||
| NOExp/Exp | 0.324a | 8.448 | 0.000 | 0.904 | 0.715 | ||||||||||||||||
| IMP | 0.156a | 2.293 | 0.036 | 0.497 | 0.937 | ||||||||||||||||
| NOGOV | -0.307a | -2.195 | 0.043 | -0.481 | 0.225 | ||||||||||||||||
| Ln (GFCF) | 0.273a | 8.273 | 0.000 | 0.900 | 0.997 | ||||||||||||||||
| FDI | 0.165a | 2.413 | 0.028 | 0.516 | 0.901 | ||||||||||||||||
| (GRGDP) | 0.063a | 0.817 | 0.426 | 0.200 | 0.930 | ||||||||||||||||
| PRIV | 0.520a | 5.426 | 0.000 | 0.805 | 0.220 | ||||||||||||||||
| 2 | NOExp/Exp | 0.139b | 1.554 | 0.141 | 0.372 | 0.105 | |||||||||||||||
| IMP | -0.059b | -1.475 | 0.161 | -0.356 | 0.530 | ||||||||||||||||
| NOGOV | 0.111b | 1.372 | 0.190 | 0.334 | 0.134 | ||||||||||||||||
| Ln (GFCF) | -0.206b | -0.803 | 0.434 | -0.203 | 0.014 | ||||||||||||||||
| FDI | 0.002b | 0.050 | 0.961 | 0.013 | 0.620 | ||||||||||||||||
| (GRGDP) | 0.053b | 1.817 | 0.089 | 0.425 | 0.929 | ||||||||||||||||
| PRIV | -0.244b | -1.406 | 0.180 | -0.341 | 0.029 | ||||||||||||||||
| a. Predictors in the Model: (Constant), NOGDP/GDP b. Predictors in the Model: (Constant), NOGDP/GDP, Ln(GDP) c. classification the concentration of the Saudi economy = high d. Dependent Variable: NHHI |
|||||||||||||||||||||
| Appendix 3 Model (Ib): The Concentration of Saudi Economy High and the Predicative Variables are Factors | ||||||||||||||||||||
| Variables Entered/Removeda,b | ||||||||||||||||||||
| Model | Variables Entered | Variables Removed | Method | |||||||||||||||||
| 1 | REGR factor score 1 for analysis 1 | . | Stepwise (Criteria: Probability-of-F-to-enter <= 0.050, Probability-of-F-to-remove >= 0.100). | |||||||||||||||||
| 2 | REGR factor score 2 for analysis 1 | . | Stepwise (Criteria: Probability-of-F-to-enter <= 0.050, Probability-of-F-to-remove >= 0.100). | |||||||||||||||||
| a. classification the concentration of the Saudi economy = high b. Dependent Variable: NHHI |
||||||||||||||||||||
| Model Summaryc,d | ||||||||||||||||||||
| Model | R | R Square | Adjusted R Square | Std. Error of the Estimate | ||||||||||||||||
| 1 | 0.866a | 0.749 | 0.735 | 0.01322568 | ||||||||||||||||
| 2 | 0.959b | 0.919 | 0.909 | 0.00776265 | ||||||||||||||||
| a. Predictors: (Constant), REGR factor score 1 for analysis 1 b. Predictors: (Constant), REGR factor score 1 for analysis 1, REGR factor score 2 for analysis 1 c. classification the concentration of the Saudi economy = high d. Dependent Variable: NHHI |
||||||||||||||||||||
| ANOVAc,d | ||||||||||||||||||||
| Model | Sum of Squares | df | Mean Square | F | Sig. | |||||||||||||||
| 1 | Regression | 0.009 | 1 | 0.009 | 50.828 | 0.000a | ||||||||||||||
| Residual | 0.003 | 17 | 0.000 | |||||||||||||||||
| Total | 0.012 | 18 | ||||||||||||||||||
| 2 | Regression | 0.011 | 2 | 0.005 | 90.445 | 0.000b | ||||||||||||||
| Residual | 0.001 | 16 | 0.000 | |||||||||||||||||
| Total | 0.012 | 18 | ||||||||||||||||||
| Coefficientsa,b | ||||||||||||||||||||
| Model | Unstandardized Coefficients | Standardized Coefficients | t | Sig. | ||||||||||||||||
| B | Std. Error | Beta | ||||||||||||||||||
| 1 | (Constant) | 0.102 | 0.003 | 29.864 | 0.000 | |||||||||||||||
| REGR factor score 1 for analysis 1 | -0.027 | 0.004 | -0.866 | -7.129 | 0.000 | |||||||||||||||
| 2 | (Constant) | 0.107 | 0.002 | 49.513 | 0.000 | |||||||||||||||
| REGR factor score 1 for analysis 1 | -0.033 | 0.002 | -1.033 | -13.427 | 0.000 | |||||||||||||||
| REGR factor score 2 for analysis 1 | 0.011 | 0.002 | 0.444 | 5.775 | 0.000 | |||||||||||||||
| a. classification the concentration of the Saudi economy = high b. Dependent Variable: NHHI |
||||||||||||||||||||
| Excluded Variablesb,c | ||||||||||||||||||||
| Model | Beta In | t | Sig. | Partial Correlation | Collinearity Statistics | |||||||||||||||
| Tolerance | ||||||||||||||||||||
| 1 | REGR factor score 2 for analysis 1 | 0.444a | 5.775 | 0.000 | 0.822 | 0.858 | ||||||||||||||
| a. Predictors in the Model: (Constant), REGR factor score 1 for analysis 1 b. classification the concentration of the Saudi economy = high c. Dependent Variable: NHHI |
||||||||||||||||||||
| Appendix 4 Model (IIA): The Concentration of Saudi Economy Middle and the Predicative Variables are the Financial Ratios | ||||||||||||||||||||||
| Variables Entered/Removeda,b | ||||||||||||||||||||||
| Model | Variables Entered | Variables Removed | Method | |||||||||||||||||||
| 1 | NOGDP/GDP | . | Stepwise (Criteria: Probability-of-F-to-enter <= 0.050, Probability-of-F-to-remove >= 0.100). | |||||||||||||||||||
| 2 | PRIV | . | Stepwise (Criteria: Probability-of-F-to-enter <= 0.050, Probability-of-F-to-remove >= 0.100). | |||||||||||||||||||
| a. classification the concentration of the Saudi economy = middel b. Dependent Variable: NHHI |
||||||||||||||||||||||
| Model Summaryc,d | ||||||||||||||||||||||
| Model | R | R Square | Adjusted R Square | Std. Error of the Estimate | ||||||||||||||||||
| 1 | 0.986a | 0.973 | 0.968 | 0.00418997 | ||||||||||||||||||
| 2 | 0.996b | 0.993 | 0.989 | 0.00240423 | ||||||||||||||||||
| a. Predictors: (Constant), NOGDP/GDP b. Predictors: (Constant), NOGDP/GDP, PRIV c. classification the concentration of the Saudi economy = middel d. Dependent Variable: NHHI |
||||||||||||||||||||||
| ANOVAc,d | ||||||||||||||||||||||
| Model | Sum of Squares | df | Mean Square | F | Sig. | |||||||||||||||||
| 1 | Regression | 0.003 | 1 | 0.003 | 179.845 | 0.000a | ||||||||||||||||
| Residual | 0.000 | 5 | 0.000 | |||||||||||||||||||
| Total | 0.003 | 6 | ||||||||||||||||||||
| 2 | Regression | 0.003 | 2 | 0.002 | 278.704 | 0.000b | ||||||||||||||||
| Residual | 0.000 | 4 | 0.000 | |||||||||||||||||||
| Total | 0.003 | 6 | ||||||||||||||||||||
| a. Predictors: (Constant), NOGDP/GDP b. Predictors: (Constant), NOGDP/GDP, PRIV c. classification the concentration of the Saudi economy = middel d. Dependent Variable: NHHI |
||||||||||||||||||||||
| Coefficientsa,b | ||||||||||||||||||||||
| Model | Unstandardized Coefficients | Standardized Coefficients | t | Sig. | ||||||||||||||||||
| B | Std. Error | Beta | ||||||||||||||||||||
| 1 | (Constant) | 0.630 | 0.033 | 19.199 | 0.000 | |||||||||||||||||
| NOGDP/GDP | -0.009 | 0.001 | -0.986 | -13.411 | 0.000 | |||||||||||||||||
| 2 | (Constant) | 0.627 | 0.019 | 33.250 | 0.000 | |||||||||||||||||
| NOGDP/GDP | -0.012 | 0.001 | -1.311 | -12.386 | 0.000 | |||||||||||||||||
| PRIV | 0.004 | 0.001 | 0.354 | 3.345 | 0.029 | |||||||||||||||||
| a. classification the concentration of the Saudi economy = middel b. Dependent Variable: NHHI |
||||||||||||||||||||||
| Excluded Variablesc,d | ||||||||||||||||||||||
| Model | Beta In | t | Sig. | Partial Correlation | Collinearity Statistics | |||||||||||||||||
| Tolerance | ||||||||||||||||||||||
| 1 | Ln (GDP) | 0.140a | 2.965 | 0.041 | 0.829 | 0.945 | ||||||||||||||||
| NOExp/Exp | 0.150a | 1.390 | 0.237 | 0.571 | 0.389 | |||||||||||||||||
| IMP | 0.141a | 2.885 | 0.045 | 0.822 | 0.921 | |||||||||||||||||
| NOGOV | -0.051a | -0.649 | 0.552 | -0.309 | 0.999 | |||||||||||||||||
| Ln (GFCF) | 0.136a | 2.852 | 0.046 | 0.819 | 0.982 | |||||||||||||||||
| FDI | -0.095a | -0.761 | 0.489 | -0.356 | 0.380 | |||||||||||||||||
| (GRGDP) | 0.036a | 0.408 | 0.704 | 0.200 | 0.839 | |||||||||||||||||
| PRIV | 0.354a | 3.345 | 0.029 | 0.858 | 0.159 | |||||||||||||||||
| 2 | Ln (GDP) | 0.063b | 0.756 | 0.505 | 0.400 | 0.288 | ||||||||||||||||
| NOExp/Exp | -0.039b | -0.341 | 0.755 | -0.193 | 0.175 | |||||||||||||||||
| IMP | 0.036b | 0.286 | 0.794 | 0.163 | 0.143 | |||||||||||||||||
| NOGOV | -0.033b | -0.721 | 0.523 | -0.384 | 0.981 | |||||||||||||||||
| Ln (GFCF) | 0.044b | 0.416 | 0.705 | 0.234 | 0.204 | |||||||||||||||||
| FDI | -0.054b | -0.728 | 0.519 | -0.387 | 0.367 | |||||||||||||||||
| (GRGDP) | 0.020b | 0.379 | 0.730 | 0.214 | 0.829 | |||||||||||||||||
| a. Predictors in the Model: (Constant), NOGDP/GDP b. Predictors in the Model: (Constant), NOGDP/GDP, PRIV c. classification the concentration of the Saudi economy = middel d. Dependent Variable: NHHI |
||||||||||||||||||||||
| Appendix 5 Model IIB: The Concentration of Saudi Economy Middle and the Predicative Variables are the Factors | |||||||||||||||||||
| Variables Entered/Removeda,b | |||||||||||||||||||
| Model | Variables Entered | Variables Removed | Method | ||||||||||||||||
| 1 | REGR factor score 1 for analysis 1 | . | Stepwise (Criteria: Probability-of-F-to-enter <=0.050, Probability-of-F-to-remove >= 0.100). | ||||||||||||||||
| 2 | REGR factor score 2 for analysis 1 | . | Stepwise (Criteria: Probability-of-F-to-enter <=0.050, Probability-of-F-to-remove >= 0.100). | ||||||||||||||||
| a. classification the concentration of the Saudi economy = middle b. Dependent Variable: NHHI |
|||||||||||||||||||
| Model Summaryc,d | |||||||||||||||||||
| Model | R | R Square | Adjusted R Square | Std. Error of the Estimate | |||||||||||||||
| 1 | 0.923a | 0.852 | 0.822 | 0.00980141 | |||||||||||||||
| 2 | 0.992b | 0.985 | 0.977 | 0.00351057 | |||||||||||||||
| a. Predictors: (Constant), REGR factor score 1 for analysis 1 b. Predictors: (Constant), REGR factor score 1 for analysis 1, REGR factor score 2 for analysis 1 c. classification the concentration of the Saudi economy = middel d. Dependent Variable: NHHI |
|||||||||||||||||||
| ANOVAc,d | |||||||||||||||||||
| Model | Sum of Squares | df | Mean Square | F | Sig. | ||||||||||||||
| 1 | Regression | 0.003 | 1 | 0.003 | 28.779 | 0.003a | |||||||||||||
| Residual | 0.000 | 5 | 0.000 | ||||||||||||||||
| Total | 0.003 | 6 | |||||||||||||||||
| 2 | Regression | 0.003 | 2 | 0.002 | 129.657 | 0.000b | |||||||||||||
| Residual | 0.000 | 4 | 0.000 | ||||||||||||||||
| Total | 0.003 | 6 | |||||||||||||||||
| a. Predictors: | |||||||||||||||||||
| Coefficientsa,b | |||||||||||||||||||
| Model | Unstandardized Coefficients | Standardized Coefficients | t | Sig. | |||||||||||||||
| B | Std. Error | Beta | |||||||||||||||||
| 1 | (Constant) | 0.128 | 0.012 | 10.515 | 0.000 | ||||||||||||||
| REGR factor score 1 for analysis 1 | -0.055 | 0.010 | -0.923 | -5.365 | 0.003 | ||||||||||||||
| 2 | (Constant) | 0.103 | 0.006 | 17.070 | 0.000 | ||||||||||||||
| REGR factor score 1 for analysis 1 | -0.066 | 0.004 | -1.109 | -16.031 | 0.000 | ||||||||||||||
| REGR factor score 2 for analysis 1 | 0.021 | 0.004 | 0.409 | 5.914 | 0.004 | ||||||||||||||
| a. classification the concentration of the Saudi economy = middel b. Dependent Variable: NHHI |
|||||||||||||||||||
| Excluded Variablesb,c | |||||||||||||||||||
| Model | Beta In | t | Sig. | Partial Correlation | Collinearity Statistics | ||||||||||||||
| Tolerance | |||||||||||||||||||
| 1 | REGR factor score 2 for analysis 1 | 0.409a | 5.914 | 0.004 | 0.947 | 0.794 | |||||||||||||
| a. Predictors in the Model: (Constant), REGR factor score 1 for analysis 1 b. classification the concentration of the Saudi economy = middel c. Dependent Variable: NHHI |
|||||||||||||||||||
| Appendix 6 Model (IIIA): The Concentration of Saudi Economy General and the Predicative Variables are the Financial Ratios | ||||||||||||||||||||||||
| Variables Entered/Removeda | ||||||||||||||||||||||||
| Model | Variables Entered | Variables Removed | Method | |||||||||||||||||||||
| 1 | NOGDP/GDP | . | Stepwise (Criteria: Probability-of-F-to-enter <= 0.050, Probability-of-F-to-remove >= 0.100). | |||||||||||||||||||||
| 2 | NOExp/Exp | . | Stepwise (Criteria: Probability-of-F-to-enter <= 0.050, Probability-of-F-to-remove >= 0.100). | |||||||||||||||||||||
| 3 | NOGOV | . | Stepwise (Criteria: Probability-of-F-to-enter <= 0.050, Probability-of-F-to-remove >= 0.100). | |||||||||||||||||||||
| 4 | Ln(GDP) | . | Stepwise (Criteria: Probability-of-F-to-enter <= 0.050, Probability-of-F-to-remove >= 0.100). | |||||||||||||||||||||
| 5 | . | NOExp/Exp | Stepwise (Criteria: Probability-of-F-to-enter <= 0.050, Probability-of-F-to-remove >= 0.100). | |||||||||||||||||||||
| a. Dependent Variable: NHHI | ||||||||||||||||||||||||
| Model Summaryf | ||||||||||||||||||||||||
| Model | R | R Square | Adjusted R Square | Std. Error of the Estimate | ||||||||||||||||||||
| 1 | 0.970a | 0.941 | 0.938 | 0.01275314 | ||||||||||||||||||||
| 2 | 0.986b | 0.972 | 0.970 | 0.00889792 | ||||||||||||||||||||
| 3 | 0.991c | 0.981 | 0.979 | 0.00746760 | ||||||||||||||||||||
| 4 | 0.993d | 0.986 | 0.983 | 0.00666783 | ||||||||||||||||||||
| 5 | 0.993e | 0.985 | 0.983 | 0.00660113 | ||||||||||||||||||||
| a. Predictors: (Constant), NOGDP/GDP b. Predictors: (Constant), NOGDP/GDP, NOExp/Exp c. Predictors: (Constant), NOGDP/GDP, NOExp/Exp, NOGOV d. Predictors: (Constant), NOGDP/GDP, NOExp/Exp, NOGOV, Ln(GDP) e. Predictors: (Constant), NOGDP/GDP, NOGOV, Ln(GDP) f. Dependent Variable: NHHI |
||||||||||||||||||||||||
| ANOVAf | ||||||||||||||||||||||||
| Model | Sum of Squares | df | Mean Square | F | Sig. | |||||||||||||||||||
| 1 | Regression | 0.062 | 1 | 0.062 | 380.787 | 0.000a | ||||||||||||||||||
| Residual | 0.004 | 24 | 0.000 | |||||||||||||||||||||
| Total | 0.066 | 25 | ||||||||||||||||||||||
| 2 | Regression | 0.064 | 2 | 0.032 | 404.271 | 0.000b | ||||||||||||||||||
| Residual | 0.002 | 23 | 0.000 | |||||||||||||||||||||
| Total | 0.066 | 25 | ||||||||||||||||||||||
| 3 | Regression | 0.065 | 3 | 0.022 | 386.197 | 0.000c | ||||||||||||||||||
| Residual | 0.001 | 22 | 0.000 | |||||||||||||||||||||
| Total | 0.066 | 25 | ||||||||||||||||||||||
| 4 | Regression | 0.065 | 4 | 0.016 | 364.947 | 0.000d | ||||||||||||||||||
| Residual | 0.001 | 21 | 0.000 | |||||||||||||||||||||
| Total | 0.066 | 25 | ||||||||||||||||||||||
| 5 | Regression | 0.065 | 3 | 0.022 | 496.287 | 0.000e | ||||||||||||||||||
| Residual | 0.001 | 22 | 0.000 | |||||||||||||||||||||
| Total | 0.066 | 25 | ||||||||||||||||||||||
| a. Predictors: (Constant), NOGDP/GDP b. Predictors: (Constant), NOGDP/GDP, NOExp/Exp c. Predictors: (Constant), NOGDP/GDP, NOExp/Exp, NOGOV d. Predictors: (Constant), NOGDP/GDP, NOExp/Exp, NOGOV, Ln(GDP) e. Predictors: (Constant), NOGDP/GDP, NOGOV, Ln(GDP) f. Dependent Variable: NHHI |
||||||||||||||||||||||||
| Coefficientsa | ||||||||||||||||||||||||
| Model | Unstandardized Coefficients | Standardized Coefficients | t | Sig. | ||||||||||||||||||||
| B | Std. Error | Beta | ||||||||||||||||||||||
| 1 | (Constant) | 0.494 | 0.019 | 25.402 | 0.000 | |||||||||||||||||||
| NOGDP/GDP | -0.006 | 0.000 | -0.970 | -19.514 | 0.000 | |||||||||||||||||||
| 2 | (Constant) | 0.498 | 0.014 | 36.626 | 0.000 | |||||||||||||||||||
| NOGDP/GDP | -0.007 | 0.000 | -1.056 | -27.417 | 0.000 | |||||||||||||||||||
| NOExp/Exp | 0.002 | 0.000 | 0.197 | 5.129 | 0.000 | |||||||||||||||||||
| 3 | (Constant) | 0.556 | 0.021 | 26.403 | 0.000 | |||||||||||||||||||
| NOGDP/GDP | -0.008 | 0.001 | -1.286 | -16.589 | 0.000 | |||||||||||||||||||
| NOExp/Exp | 0.003 | 0.000 | 0.232 | 6.828 | 0.000 | |||||||||||||||||||
| NOGOV | 0.001 | 0.000 | 0.237 | 3.264 | 0.004 | |||||||||||||||||||
| 4 | (Constant) | 0.335 | 0.088 | 3.818 | 0.001 | |||||||||||||||||||
| NOGDP/GDP | -0.008 | 0.001 | -1.185 | -14.911 | 0.000 | |||||||||||||||||||
| NOExp/Exp | 0.001 | 0.001 | 0.056 | 0.750 | 0.462 | |||||||||||||||||||
| NOGOV | 0.002 | 0.000 | 0.308 | 4.371 | 0.000 | |||||||||||||||||||
| Ln(GDP) | 0.016 | 0.006 | 0.203 | 2.568 | 0.018 | |||||||||||||||||||
| 5 | (Constant) | 0.275 | 0.034 | 7.987 | 0.000 | |||||||||||||||||||
| NOGDP/GDP | -0.007 | 0.000 | -1.149 | -18.449 | 0.000 | |||||||||||||||||||
| NOGOV | 0.002 | 0.000 | 0.321 | 4.741 | 0.000 | |||||||||||||||||||
| Ln(GDP) | 0.020 | 0.002 | 0.258 | 8.113 | 0.000 | |||||||||||||||||||
| a. Dependent Variable: NHHI | ||||||||||||||||||||||||
| Excluded Variablesf | ||||||||||||||||||||||||
| Model | Beta In | t | Sig. | Partial Correlation | Collinearity Statistics | |||||||||||||||||||
| Tolerance | ||||||||||||||||||||||||
| 1 | Ln(GDP) | 0.192a | 4.829 | 0.000 | 0.710 | 0.811 | ||||||||||||||||||
| NOExp/Exp | 0.197a | 5.129 | 0.000 | 0.730 | 0.811 | |||||||||||||||||||
| IMP | 0.130a | 3.007 | 0.006 | 0.531 | 0.986 | |||||||||||||||||||
| NOGOV | 0.081a | 0.680 | 0.503 | 0.140 | 0.178 | |||||||||||||||||||
| Ln (GFCF) | 0.186a | 4.864 | 0.000 | 0.712 | 0.869 | |||||||||||||||||||
| FDI | 0.125a | 2.185 | 0.039 | 0.415 | 0.649 | |||||||||||||||||||
| (GRGDP) | 0.018a | 0.339 | 0.737 | 0.071 | 0.889 | |||||||||||||||||||
| PRIV | 0.414a | 3.424 | 0.002 | 0.581 | 0.117 | |||||||||||||||||||
| 2 | Ln(GDP) | 0.067b | 0.682 | 0.502 | 0.144 | 0.127 | ||||||||||||||||||
| IMP | 0.043b | 1.019 | 0.319 | 0.212 | 0.673 | |||||||||||||||||||
| NOGOV | 0.237b | 3.264 | 0.004 | 0.571 | 0.161 | |||||||||||||||||||
| Ln (GFCF) | 0.074b | 0.843 | 0.408 | 0.177 | 0.158 | |||||||||||||||||||
| FDI | 0.044b | 0.941 | 0.357 | 0.197 | 0.545 | |||||||||||||||||||
| (GRGDP) | 0.012b | 0.333 | 0.742 | 0.071 | 0.888 | |||||||||||||||||||
| PRIV | -0.123-b | -0.614 | 0.545 | -0.130 | 0.031 | |||||||||||||||||||
| 3 | Ln(GDP) | 0.203c | 2.568 | 0.018 | 0.489 | 0.108 | ||||||||||||||||||
| IMP | 0.050c | 1.430 | 0.168 | 0.298 | 0.671 | |||||||||||||||||||
| Ln (GFCF) | 0.168c | 2.399 | 0.026 | 0.464 | 0.142 | |||||||||||||||||||
| FDI | 0.031c | 0.783 | 0.442 | 0.169 | 0.539 | |||||||||||||||||||
| (GRGDP) | 0.010c | 0.302 | 0.766 | 0.066 | 0.888 | |||||||||||||||||||
| PRIV | 0.083c | 0.461 | 0.649 | 0.100 | 0.027 | |||||||||||||||||||
| 4 | IMP | 0.001d | 0.017 | 0.987 | 0.004 | 0.426 | ||||||||||||||||||
| Ln (GFCF) | -0.016-d | -0.064 | 0.949 | -0.014 | 0.012 | |||||||||||||||||||
| FDI | 0.028d | 0.787 | 0.441 | 0.173 | 0.539 | |||||||||||||||||||
| (GRGDP) | 0.009d | 0.317 | 0.755 | 0.071 | 0.888 | |||||||||||||||||||
| PRIV | -0.241d | -1.242 | 0.228 | -0.268 | 0.017 | |||||||||||||||||||
| 5 | NOExp/Exp | 0.056e | 0.750 | 0.462 | 0.161 | 0.120 | ||||||||||||||||||
| IMP | -0.009e | -0.243 | 0.810 | -0.053 | 0.486 | |||||||||||||||||||
| Ln (GFCF) | -0.048e | -0.206 | 0.839 | -0.045 | 0.013 | |||||||||||||||||||
| FDI | 0.031e | 0.901 | 0.378 | 0.193 | 0.551 | |||||||||||||||||||
| (GRGDP) | 0.009e | 0.326 | 0.748 | 0.071 | 0.888 | |||||||||||||||||||
| PRIV | -0.220e | -1.145 | 0.265 | -0.242 | 0.018 | |||||||||||||||||||
| a. Predictors in the Model: (Constant), NOGDP/GDP b. Predictors in the Model: (Constant), NOGDP/GDP, NOExp/Exp c. Predictors in the Model: (Constant), NOGDP/GDP, NOExp/Exp, NOGOV d. Predictors in the Model: (Constant), NOGDP/GDP, NOExp/Exp, NOGOV, Ln(GDP) e. Predictors in the Model: (Constant), NOGDP/GDP, NOGOV, Ln(GDP) f. Dependent Variable: NHHI |
||||||||||||||||||||||||
| Appendix 7 Model (IIIB): The Concentration Of Saudi Economy General and The Predicative Variables are The Factors | ||||||||||||||||||
| Variables Entered/Removeda | ||||||||||||||||||
| Model | Variables Entered | Variables Removed | Method | |||||||||||||||
| 1 | REGR factor score 1 for analysis 1 | . | Stepwise (Criteria: Probability-of-F-to-enter <= 0.050, Probability-of-F-to-remove >= 0.100). | |||||||||||||||
| 2 | REGR factor score 2 for analysis 1 | . | Stepwise (Criteria: Probability-of-F-to-enter <= 0.050, Probability-of-F-to-remove >= 0.100). | |||||||||||||||
| a. Dependent Variable: NHHI | ||||||||||||||||||
| Model Summaryc | ||||||||||||||||||
| Model | R | R Square | Adjusted R Square | Std. Error of the Estimate | ||||||||||||||
| 1 | 0.905a | 0.819 | 0.811 | 0.02229155 | ||||||||||||||
| 2 | 0.966b | 0.932 | 0.927 | 0.01390536 | ||||||||||||||
| a. Predictors: (Constant), REGR factor score 1 for analysis 1 b. Predictors: (Constant), REGR factor score 1 for analysis 1, REGR factor score 2 for analysis 1 c. Dependent Variable: NHHI |
||||||||||||||||||
| Coefficientsa | ||||||||||||||||||
| Model | Unstandardized Coefficients | Standardized Coefficients | t | Sig. | ||||||||||||||
| B | Std. Error | Beta | ||||||||||||||||
| 1 | (Constant) | 0.118 | 0.004 | 26.936 | 0.000 | |||||||||||||
| REGR factor score 1 for analysis 1 | -0.046 | 0.004 | -0.905 | -10.416 | 0.000 | |||||||||||||
| 2 | (Constant) | 0.118 | 0.003 | 43.181 | 0.000 | |||||||||||||
| REGR factor score 1 for analysis 1 | -0.046- | 0.003 | -0.905 | -16.698 | 0.000 | |||||||||||||
| REGR factor score 2 for analysis 1 | 0.017 | 0.003 | 0.337 | 6.219 | 0.000 | |||||||||||||
| a. Dependent Variable: NHHI | ||||||||||||||||||
| Excluded Variablesb | ||||||||||||||||||
| Model | Beta In | t | Sig. | Partial Correlation | Collinearity Statistics | |||||||||||||
| Tolerance | ||||||||||||||||||
| 1 | REGR factor score 2 for analysis 1 | 0.337a | 6.219 | 0.000 | 0.792 | 1.000 | ||||||||||||
| a. Predictors in the Model: (Constant), REGR factor score 1 for analysis 1 b. Dependent Variable: NHHI |
||||||||||||||||||
Acknowledgement
The authors gratefully acknowledge the financial support from the Chair Sheikh Mohammad Al-Fawzan to the Expectations of Macroeconomic Saudi at Imam University, Saudi Arabia.
References
- Abosedra, S., & Tang, C.F. (2018). Are exports a reliable source of economic growth in MENA countries? new evidence from the rolling granger causality method. Empirical Economics, 1-11.
- Abouchakra, R., Moujaes, C., & Najjar, M.R. (2008). Economic diversification: The road to sustainable development. USA: Booz Allen Hamilton.
- Aker, ?., & Iman, A. (2019). Comparison of Business Environments in Oil-Rich MENA Countries: A Clustering Analysis of Economic Diversification and Performance. Emerging Markets Finance and Trade, 55(12), 2871-2885.
- Albassam, B.A. (2015). Economic diversification in Saudi Arabia: Myth or reality? Resources Policy, 44, 112-117.
- Alghamedi, A. (2014). Lack of diversification is a challenge facing Saudi Arabia. Journal of Global Business Issues, 8(2), 57.
- Algowear Almestneer, R.A. (2018). Economic diversification: The case of Saudi Arabia with reference to rich natural resource countries
- Ali, G., & Li, Z. (2018). Exports-led growth or growth-led exports in the case of china and Pakistan: An empirical investigation from the ARDL and granger causality approach. The International Trade Journal, 32(3), 293-314.
- Banafea, W., & Ibnrubbian, A. (2018). Assessment of economic diversification in Saudi Arabia through nine development plans. OPEC Energy Review, 42(1), 42-54.
- Elheddad, M.M. (2016). Natural resources and FDI in GCC countries. International Journal of Business and Social Research, 6(7), 12-22.
- Gozgor, G., & Can, M. (2016). Effects of the product diversification of exports on income at different stages of economic development. Eurasian Business Review, 6(2), 215.
- Gylfason, T. (2017). From double diversification to efficiency and growth. Comparative Economic Studies, 59(2), 149.
- Khorsheed, M.S. (2015). Saudi Arabia: From oil kingdom to Knowledge?Based economy. Middle East Policy, 22(3), 147-157.
- Konstantakopoulou, I. (2017). The aggregate exports-GDP relation under the prism of infrequent trend breaks and multi-horizon causality. International Economics and Economic Policy, 14(4), 661-689.
- Kristjanpoller, W., Olson, J.E., & Salazar, R.I. (2016). Does the commodities boom support the export led growth hypothesis? evidence from Latin American countries. Latin American Economic Review, 25(1), 1-13.
- Mehrara, M. (2008). The asymmetric relationship between oil revenues and economic activities: The case of oil-exporting countries. Energy Policy, 36(3), 1164-1168.
- Persson, M. (2013). Trade facilitation and the extensive margin. The Journal of International Trade & Economic Development, 22(5), 658-693.
- Persson, M., Wilhelmsson, F., Department of Economics, Lund University, Nationalekonomiska institutionen, Swedish Institute for Food and Agricultural Economics, Institutet för livsmedelsekonomisk analys, A. (2016). EU trade preferences and export diversification. The World Economy, 39(1), 16-53.
- Salam, Y., & Egeli, H.A. (2017). Empirical analysis of export-led growth and domestic demand-led growth hypotheses in east Asia.Uluslararas Ktisadi VeDari Ncelemeler Dergisi, 10(19), 211-226.
- Sohail, M.S. (2012). Economic diversification in Saudi Arabia: The need for improving competitiveness for sustainable development. 2012th ed., 147-156. New York, NY: Springer New York.
- The Arab Investment and Export Credit Guarantee Corporation (Dhaman). (2018). Investment climate in Arab countries (dhaman investment attractiveness index 2018). Kuwait: The Arab Investment and Export Credit Guarantee Corporation. Retrieved from http://dhaman.net/en/wp-content/uploads/sites/3/2018/11/ClimateReport2018-En.pdf
- Vision 2030 kingdom of Saudi Arabia, Retrieved from http://www.vision2030.gov.sa
- Yamada, M. (2018). Can Saudi Arabia move beyond "production with rentier characteristics"? human capital development in the transitional oil economy. The Middle East Journal, 72(4), 587-609.