Research Article: 2018 Vol: 22 Issue: 4
The Effect of Contagion on Stock Market Development in the ASEAN-5: A Seemingly Unrelated Regression Analysis
Mohd Yushairi Mat Yusoff, Universiti Utara Malaysia
Sallahuddin Hassan, Universiti Utara Malaysia
Abstract
The aim of this paper is to empirically examine the effect of contagion from the United States stock market on stock market development in ASEAN-5 countries. By using data from 1990-2014, Seemingly Unrelated Regression estimation results show that the contagion effect from the United States was displayed by considering interaction term which also support Thornton’s Contagion Theory. Thus, prudential initiatives such as government support, trading supervision, trade openness and the inspiration towards an integrated stock market are recommended.
Keywords
Stock Market Development, ASEAN-5 Country.
Introduction
The improvement in the ability of stock market to satisfy the needs of financial players in the traditional sub-sector including the capital markets is the general definition of the Stock Market Development (SMD). This definition also shared by Balogun et al. (2016); Capasso, (2006); Nowbutsing and Odit, (2009); and Sezgin and Atakan, (2015). In the study of SMD, various determinants have been well documented. However, there are least attention have been paid on the effects of contagion on SMD.
In understanding its mechanism from the theoretical perspective, the Thornton’s Contagion Theory which was cited in Garcia, (1989); Moser, (2003); and Werner, (2014) is referred. Based on this theory, contagion can be defined as the transmission of crisis from a country to another country or region. However, this theory is primarily focus on the banking sectors. Therefore, the contagion effects explained by Forbes and Rigobon (2002) is considered. According to Forbes and Rigobon, the contagion is occurring if there is a significant increase in the cross market interaction after a crisis period. Otherwise, if there is a high interaction between the market in the pre and post crisis, it will constitute interdependence. Based on the definition, countries that share the same geographical characteristic, structure, history and have a strong direct linkage in term of trade and finance might be closely connected even in a stable period. Therefore, any crisis occurs in any of the country would possibly spread to its counterparts.
In particular, this paper aims to measure the contagion effects on SMD between the United States (US) stock market and the stock market in the Association of South East Asian Nation 5 (ASEAN-5) comprises of Malaysia, Indonesia, Thailand, The Philippines and Singapore. To do so, the inclusion of market interaction terms as specific indicators of interest has been incorporated into estimable SMD models which also could be found in previous studies such as Dornbusch et al. (2000); Claessens and Forbes (2004); and Serwa (2005). For a clearer perspective, the pattern of market index movements for both the ASEAN-5 and the US within the 1990-2014 timeframe is illustrated in Figure 1.
In the beginning, all ASEAN-5 countries posted a relatively similar pattern in their market indexes between 1990 and 2003. Interestingly, in later years, it is worth to highlight from Figure 1 that there is clear evidence on the positively established relationship between the stock market movements for the ASEAN-5 and the US particularly in the 2007-2008 period. Therefore, there is a possibility of market interaction at a certain degree to be prevailed between the stock markets for the ASEAN-5 and the US. Given by this market interaction, any changes in the US stock market could affect the stock market in the ASEAN- 5.
Therefore, the price of the stocks in the ASEAN-5 would be reflected by the contagion effect of the US stock market. More or so, traders which possess some information on capital markets would initiate an order to sell their stocks subsequently render to the possibility of yielding price depreciation. The rest of this paper is structured as follows. Next section would discuss on the methodology followed by discussion of results. Then, to wrap up, conclusion and policy implications and/or recommendations are provided in the last section.
Methodology
This section provides the details regarding data, estimation procedure and estimable models.
Data
This paper investigates the contagion effects of the US on the ASEAN-5’s SMD by utilizing data of ASEAN–5’s market indexes which are Bursa Malaysia (BM), The Indonesia Stock Exchange (IDX), Stock Exchange of Thailand (SET), The Philippine Stock Exchange (PSE) and The Singapore Exchange (SGX) the year 1990-2014. For the US index, Dow Jones Index is used because it quoted the most highly capitalized and influential companies in the US market (Grimaldi, 2010).
Estimation Procedure
For the estimation purpose, market interaction terms used in the Seemingly Unrelated Regression (SUR) models. Zellner’s SUR model which is an interchangeably known as contemporaneous correlation analysis between error terms between the models is. This approach is appropriate as each of the country shares the analogous economic hinges. Also, it could capture the efficiency due to the correlation of the disturbances across equations. Generally, there are three stages included in the SUR estimation. In the first stage, the contemporaneous correlation between the models is tested by using the residual covariance; 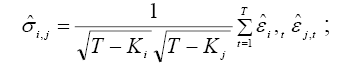 residual correlation of
 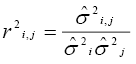 and Langrange Multiplier Test (LM) given by
  .
.
These tests provide the evidences that the error terms between the models are correlated by using the assumption of 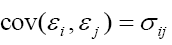 if, t = s and
  if, t ≠ s . The null hypothesis of
  are verified using the LM test. By using number of equation as the degree of freedom for χ2 critical value, if the null hypothesis is fail to be rejected, then it suggested that SUR would be more accurate than separate least square estimation.
Estimable Model
In the second stage, Equation [1] is estimated using SUR as follows:
SMDit=φ0+ φ1MRIit+ φ2MRIUSt+ φ3MRIit*MRIUS + φ4LIQit+ φ5CRTit+ φ6SAVit+ φ7DUMit+?it [1]
where i represents ASEAN–5 countries which are Malaysia, Indonesia, Thailand, The Philippines and Singapore, respectively. MRI is the market index in ASEAN–5 , MRIUS is Dow Jones Index which also represent the market index for the US and MRIit*MRIUS is the interaction term between the ASEAN-5 countries and US stock market, LIQ is stock market liquidity, SAV is total saving, CRT is credit to private sector by bank, θ is the coefficient, while ε is the error term. The error is considered as white noise where the mean is equal zero and variance is constant,  . Prior to the estimation of Equation [1], the interaction variables should be obtained to get the value of MRIit *MRIUS by estimating following equation:

Where, γ is the coefficient value for each variable and ε represents the error term. After the interaction terms have been estimated, the residual series are created and substituted into the Equation [1]. Given this, the measurement of total effect of MRIit and MRIUSt on SMD are given as ![]() , respectively.
, respectively.
In the last stage, the equality of the coefficients in the SUR models is examined by using Wald Test. While using this test, the null hypotheses of equal coefficient for each variable are tested as  for MRI,
 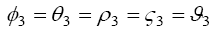 for MRIUS and
 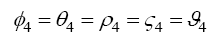 for MRI *MRIUS . Where Φ,θ ,ρ,ς ,and ϑ is the coefficient for each country.
Based on the F-statistic and χ2 values, if the null hypothesis is rejected, it signifies that the coefficients for each variable across countries are not equal and SUR is more appropriate to be applied rather than Ordinary Least Square (OLS).
Results Discussion
Table 1 reports the residual covariance, correlation matrix and LM test. Based on the LM test values, LM between the countries illustrates value greater than LM critical value. Based on the result, the null hypothesis of no correlation between the errors terms in the models are rejected at 95%confidence level and signifies that SUR models are more efficient OLS.
| Table 1 Residual Covariance Matrix, Correlation Matrix and Lm Test |
|||||
| Residual Covariance Matrix | |||||
| Country | Malaysia | Indonesia | Thailand | Philippines | Singapore |
| Malaysia | 703.07 | ||||
| Indonesia | 92.90 | 35.95 | |||
| Thailand | 88.15 | 21.27 | 123.60 | ||
| Philippines | 209.34 | 54.77 | 42.99 | 185.38 | |
| Singapore | 202.77 | 48.08 | 149.55 | 85.82 | 457.78 |
| Residual Correlation Matrix | |||||
| Country | Malaysia | Indonesia | Thailand | Philippines | Singapore |
| Malaysia | 1.00 | - | - | - | - |
| - | - | - | - | - | |
| Indonesia | 0.58 | 1.00 | - | - | - |
| [14.61]* | - | - | - | - | |
| Thailand | 0.30 | 0.32 | 1.00 | - | - |
| [7.48]* | [7.98] * | - | - | - | |
| Philippines | 0.58 | 0.67 | 0.28 | 1.00 | - |
| [14.50]* | [16.77] * | [7.10] * | - | - | |
| Singapore | 0.36 | 0.37 | 0.63 | 0.29 | 1.00 |
| [8.94]* | [9.37] * | [15.72]* | [7.37] * | - | |
Note: Chi-square critical values at 5% and 10% confidence level are 1.15 and 1.61, respectively.
* and ** indicate significant variables at the 5% and 10% significance levels, respectively.
Figures in parenthesis are the LM values
Second stage is the estimation of SUR, the results are displayed in Table 2. For all ASEAN-5 countries, the coefficients of interaction terms; MRIit *MRIUS are found to be statistically significant at the 5% and 10%significance levels, accordingly. Therefore, the effects of market interaction to the ASEAN-5’s SMD can be possibly explained through both total effects of MRIit and MRIUS.
| Table 2 Sur Estimation Results |
||||||
| Country | Variable | Coefficient | Total Effect | Std. Err | t- Stat | Prob. |
| C | 128.97 | 40.03 | 3.22 | 0.00* | ||
| MRI | 0.50 |  |
0.09 | 5.54 | 0.00* | |
| MRIUS | 0.32 |  |
0.10 | 3.2 | 0.00* | |
| Malaysia | MRI * MRIUS | 0.67 | 0.38 | 1.76 | 0.08** | |
| LIQ | 0.23 | 0.08 | 2.85 | 0.01* | ||
| CRT | -0.10 | 0.38 | -0.25 | 0.80 | ||
| SAV | -185.60 | 158.78 | -1.17 | 0.25 | ||
| DUM | -26.45 | 20.71 | -1.28 | 0.20 | ||
| C | 14.25 | 10.70 | 1.33 | 0.19 | ||
| MRI | 0.02 |  |
0.00 | 6.93 | 0.00* | |
| MRIUS | -0.03 | 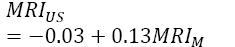 |
0.03 | -0.92 | 0.36 | |
| Indonesia | MRI * MRIUS | 0.13 | 0.08 | 1.67 | 0.10** | |
| LIQ | 0.20 | 2.22 | 0.09 | 0.93 | ||
| CRT | 0.33 | 0.17 | 1.91 | 0.06* | ||
| SAV | -24.98 | 5.11 | -4.89 | 0.00* | ||
| DUM | -13.46 | 4.74 | -2.84 | 0.01* | ||
| C | 30.68 | 12.70 | 2.42 | 0.02* | ||
| MRI | 0.17 |  |
0.03 | 6.36 | 0.00* | |
| MRIUS | 0.56 |  |
0.33 | 1.71 | 0.09** | |
| Thailand | MRI * MRIUS | 0.30 | 0.17 | 1.76 | 0.08** | |
| LIQ | 0.02 | 0.01 | 1.69 | 0.09** | ||
| CRT | -0.18 | 0.11 | -1.64 | 0.11 | ||
| SAV | -66.94 | 34.63 | -1.93 | 0.06** | ||
| DUM | -5.14 | 6.97 | -0.74 | 0.46 | ||
| C | 22.94 | 11.17 | 2.05 | 0.04* | ||
| MRI | 0.05 |  |
0.02 | 3.02 | 0.00* | |
| MRIUS | -0.46 | 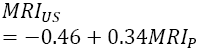 |
0.38 | -1.20 | 0.23 | |
| Philippines | MRI * MRIUS | 0.34 | 0.18 | 1.89 | 0.06** | |
| LIQ | 0.20 | 0.20 | 1.02 | 0.31 | ||
| CRT | 0.09 | 0.46 | 0.19 | 0.85 | ||
| SAV | 24.47 | 17.95 | 1.36 | 0.18 | ||
| DUM | -9.54 | 8.74 | -1.09 | 0.28 | ||
| C | 41.67 | 48.67 | 0.86 | 0.39 | ||
| MRI | 0.14 |  |
0.02 | 7.27 | 0.00* | |
| MRIUS | 0.23 |  |
0.08 | 2.77 | 0.01* | |
| Singapore | MRI * MRIUS | 0.60 | 0.34 | 1.76 | 0.08** | |
| LIQ | 0.11 | 0.20 | 0.56 | 0.57 | ||
| CRT | -0.44 | 0.52 | -0.83 | 0.41 | ||
| SAV | -9.07 | 33.75 | -0.27 | 0.79 | ||
| DUM | -32.24 | 11.14 | -2.89 | 0.00* | ||
| Diagnostic Test | Value | |||||
| R2 | 0.86 | |||||
| Adjusted R2 | 0.84 | |||||
| S.E. of regression | 1.19 | |||||
| F-statistic | 47.26 | |||||
| Prob (F-statistic) | 0.00* | |||||
Note: * and ** indicate significant variables at 5% and 10% significance levels, respectively.
Among others, the coefficients of it MRIit are significantly different from zero at the 5 and 10% significance levels for the ASEAN-5 countries, respectively. Given the positive coefficient values of MRIs, any increase of one point in MRIUS would further stimulate the SMD. Moreover, statistically significant at 5% confidence level the effects of MRIUS to SMD can be empirically observed in Malaysia and Singapore but statistically significant at 5% in Thailand. Based on the positive coefficients of interaction terms, that any increase in one point of MRI would stimulate the effect of MRIUS to SMD of these countries.
These empirical results was also supported by the studies conducted by Chow et al. (2013); and Liu (2007) which found a strong statistical evidences of the contagion effects of US market particularly due to the volatility of the market index to the ASEAN-5 countries. Also, Trivedi and Bir?u, (1999) found a highly reliance of the emerging markets on the index movement in the developed countries particularly the US which then provide a significant implications for the investment process and management of risk toward a financial liberalization. According to Bagliano and Morana (2012), the key transmission of the effects of US stock market to the other region is through the currency which then transmitted through trade channel besides the excess liquidity creation and stock price dynamic. These transmission channels support the Contagion Theory which related to the crises transmission.
On the overall goodness of the model, 84% of the variation in the SMD of the ASEAN-5’s for the 1990-2014 periods can be explained by explanatory variables within the SUR models. Also, the F-statistic value of 48.26% indicates a strong evidence of the joint statistical influence between the variables in the model at the 5% significance level. The last stage for SUR analysis is Wald test which reported in Table 3. Based on the results, the Fstatistic and Chi–square values signify that at 5% confidence level, null hypotheses of equal coefficient for LIQ, MRI, MRIUS and MRI *MRIUS are rejected. Therefore, SUR model is more efficient than separate models.
| Table 3 Wald Test for Seemingly Unrelated Regression Models |
|||
| Test Statistic | Value | df | p-value |
| F-statistic | 8.94 | (20, 85) | 0.00* |
| Chi-square | 178.79 | 20 | 0.00* |
Note: * and ** indicate significant variables at 5 and 10%significance levels, respectively.
Conclusion
This paper examines the effects of contagion on SMD in the ASEAN-5 countries. By utilizing the data of 1990-2014, the effect of US market to the ASEAN-5 stock market was considered. Results suggested that MRI for all countries is statistically significant in determining the changes of SMD in the ASEAN-5. Meanwhile, MRIUS have significantly contributed to the changes in SMD in Malaysia, Thailand and Singapore. Although there is insignificant effect of MRIUS to Indonesia and the Philippines, effect of MRIUS still exist by considering the interaction term. Thus, the consideration of interaction term is important in explaining the contagion effect outside the region. Based on the results, policymakers should focus on preparing prudential initiatives to protect the domestic stock market against contagion effects. Such initiatives include the government support, trading supervision, trade openness and the inspiration towards an integrated stock market. As this paper serves an initial step to disclose the effects of contagion, the extensions from this study would be proposed to focus on the effects of other developed markets to the ASEAN-5. Moreover, a comparative study with the other emerging marker also worth to provide the evidence regarding the position of ASEAN stock market relative to the other emerging market around the world.
References
- Bagliano, F.C., & Morana, C. (2012). The great recession: US dynamics and spillovers to the world economy. Journal of Banking and Finance, 36(1), 1-13.
- Balogun, W.O., Dahalan, J., & Hassan, S. (2016). Long term effect of liquidity on stock market development. Journal of Economics and Sustainable Development, 7(4), 40-46.
- Capasso, S. (2011). Stock market development and economic growth. International Business and Economics Research Journal, 8(2), 205-219.
- Chow, G.C., Huang, S., & Niu, L. (2013). Econometric Analysis of stock price co-movement in the economic integration of East Asia. Retrieved from: http://dspace.xmu.edu.cn.
- Claessens, S., & Forbes, K. (2004). International financial contagion: The Theory, evidence, and policy implications. The IMF’s Role in Emerging Market Economies: Reassessing the Adequacy of Its Resources. Retrieved from http://web.mit.edu
- Clapham, J.H., Thornton, H., & Von Hayek, F.A. (1941). An enquiry into the nature and effects of the paper credit of Great Britain (1802). Economica, 8(30), 210.
- Dornbusch, R., Park, Y.C., & Claessens, S. (2000). Contagion: Understanding how it spreads. The World Bank Research Observer, 15(2), 177-197.
- Forbes, K.J., & Rigobon, R. (2002). No contagion, only interdependence: Measuring Stock market comovements. The Journal of Finance, 57(5), 2223-2261.
- Garcia, G. (1989). The lender of last resort in the wake of the crash. The American Economic Review, 79(2), 151-155.
- Grimaldi, B. (2010). Detecting and Interpreting Financial Stress in the Euro Area. ECB Working Paper, (1214).
- Liu, L. (2007). Volatility and Mean Spillover from US and China to ASEAN. Retrieved from: http://lup.lub.lu.se.
- Moser, T. (2003). What is international financial contagion? International Finance, 6(2), 157-178.
- Nowbutsing, B.M., & Odit, M.P. (2009). Stock market development and economic growth: The case of Mauritius. International Business & Economics Research Journal (IBER), 8(2), 77-88.
- Serwa, D. (2005). Empirical Evidence on Financial Spillovers and Contagion to International Stock Markets(Ph.D Dissertation). Retrieved from: https://www.deutsche-digitale-bibliothek.de.
- Sezgin, F., & Atakan, T. (2015). The role of the Calderon-Rossell Model on determining the developments of equity capital markets: A study of fragile five countries. Istanbul University Journal of the School of Business Administration, 44(1), 2-11.
- Trivedi, J., & Bir?u, R. (1999). Analysis of international contagion in emerging stock markets in terms of global financial crisis. Advances in Accounting, Auditing and Risk Management, 120-125.
- Werner, R.A. (2014). Can banks individually create money out of nothing? The theories and the empirical evidence. International Review of Financial Analysis, 36(C), 1-19.