Research Article: 2022 Vol: 26 Issue: 3S
The Effect of Covid-19 on Stock Market Returns: Evidence from Italy and China
Mubashir Ali Khan, University of Lahore
Citation Information: Khan, M.A. (2022). The effect of covid-19 on stock market returns: evidence from italy and china. Academy of Accounting and Financial Studies Journal, 26(S3), 1-11.
Abstract
This study investigates the relationship between novel coronavirus COVID-19 confirmed cases and deaths on stock market return in China and Italy. The study is unique in the context of China and Italy, as these two countries suffered badly at the start of this pandemic. This study empirically analyzes the daily confirmed cases and deaths for the period from February 15, 2020, to March 2020. This study uses data from FTSE (Milano Italia Borsa) and Shanghai Stock Exchange of top 40 and 50 companies, respectively, for stock returns. The COVID-19 data is collected daily by World meter. Using panel data on Chinese and Italian stocks, it was found that there is a negative association between stock returns and the total number of confirmed cases and deaths. This study will allow financial policymakers to assess the financial crisis in this COVID-19. Additionally, this study highlights the economic impact of COVID-19 by analyzing its impact on stock returns.
Keywords
COVID-19, Stock Return, Panel Data Analysis, Italian Stock Market.
Introduction
A Global Risk Report 2020 (WEF 2020, published on January 15, 2020) ranks the novel coronavirus (Covid-19) infectious disease in 10th place in terms of its impact on the global stock market. World history has seen several deaths from infectious diseases, including the plague outbreak of 1347-1351, the bleeding fever of 1545 and 1548, and the cholera epidemic of 1899 and 1923. Yang et al. (2020) suggested that the COVID-19 virus has its place in the order of nidovirales in the Coronaviridae family. This coronavirus family consists of four coronaviruses, named Alpha, Beta, Gamma and Delta, as described in previous literature. The Middle East Respiratory Syndrome and Extreme Acute Respiratory Syndrome of these coronaviruses, according to Shereen et al. (2020), while ARDS (acute respiratory distress syndrome) caused severe lung damage resulting in death. Stock market returns are responsive to these epidemics, pandemics, and other major global events. Ebola virus disease outbreak, severe acute respiratory syndrome, and other events including political (Shanaev & Ghimire, 2019; Bash & Alsaifi, 2019), news (Li, 2018), sports (Buhagiar et al., 2018), and environmental (Guo et al., 2020; Alsaifi et al., 2020) influence stock market returns as indicated in the earlier literature.
There are numerous studies in the recent literature that have examined the effects of this extraordinary outbreak on the behavior of financial markets. In a study on Bitcoin and COVID-19 in China and S&P 500, no significant correlation is found between Covid-19 and investments in Bitcoin. Another study found that while the impact of COVID-19 on oil prices in the US is negative, it has a significant impact on stock returns and political uncertainty. Taken together, these studies suggest that the impact of this outbreak on the oil price, stock market behavior, economic policy uncertainty, emerging markets, and currency are significant. However, there are no studies that have looked at the impact of COVID-19 confirmed cases and deaths on stock returns. The aim of this study is therefore to examine the impact of COVID-19 on stock market returns.
Figure 1 summarizes the most important events in connection with the novel outbreak of the Chinese Wuhan Corona-Covid-19 virus. According to Sohrabi et al. (2020) is believed to be the main explanation for the recent COVID-19 outbreak in China related to maritime goods. This virus killed first person on January 11, 2020, in Wuhan in the Chinese province of Hubei. The Chinese government's preventive measures have greatly reduced the number of cases and deaths. The number of new cases fell to below 100 in early March.

Figure 1: Key Events Of Covid-19 In China.
Figure 2 summarizes the main incidents related to the COVID-19 outbreak in Italy. On January 31, 2020, the EU member state was added to its list of countries affected by the coronavirus when the first two cases of the novel coronavirus were confirmed in two Chinese tourists. Italy is a popular travel destination. The first coronavirus death in Italy on February 21, 2020 has been confirmed by Pharmaceutical Technology (2020). Italy's outbreak outside of Asia after Wuhan is considered the world’s largest with a total of 59,318 confirmed cases on March 23, 2020. Coronavirus in Italy grew from hundreds of thousands to thousands in 4 weeks from mid-February to March 10 (Pharmaceutical Science, 2020).

Figure 2: Key Events Of Covid-19 In Italy.
Zach (2003) notes that significant events have a direct impact on stock returns. As the coronavirus (COVID-19) has increased and the index has decreased since 1998 (as of February 2020), it is the largest business in Italy. This is the worst day in stock market history, the index of the Italian stock market lost 16.92 percent on March 12, 2020. The same applies to China's Shanghai Composite Index, while the Composite Index of Shenzhen fell by 7.7% and 8.7%, respectively. The losses wiped out a total market value of $ 445 billion. The novelty of these study studies is to examine the unprecedented response to stock market returns from the infectious disease Covid-19. This outbreak began in Italy on January 31, 2020, with two confirmed cases. Details of the reported number of cases and reported deaths are posted daily by World Meter. This research uses a two-meter panel regression method to analyze the impact of the unprecedented Covid-19 infectious disease response and loss of capital stock. (1) The daily growth rate for all reported cases (2) the daily growth rate of all-cause mortality from this COVID-19 pandemic. This study chooses China and Italy as the focus of this study as these two countries suffered badly at the start of this outbreak. At the time, most cases were reported from China and Italy, with Italy recording the most deaths. Hence, it is interesting to examine the impact of this breakout on equity market returns in China and Italy over this period. To the best of the author's knowledge, there is no other study that has examined this relationship. For this purpose, this study collected data from the FTSE (Milano Italia Borsa) and Shanghai Stock Exchange of the top 40 and 50 companies, respectively, for stock returns. The COVID-19 data (confirmed cases and deaths) is collected on daily basis by Worldometer. We find a significant negative association between COVID-19 and stock market returns in both China and Italy. This effect is more pronounced in Italy than in China.
This paper is divided into different parts as follows. Study methodology is covered in Section 2, while data and samples and conclusions are presented in Sections 3 and 4, respectively.
Data and Methodology
We used Daily data sets for this analysis covering the period from February 15th to March 2020. The data includes companies listed in the FTSE MIB (Milano Italia Borsa) Index, which is a global stock market index monitoring the performance of 40 leading and most liquid companies and companies listed in the Borsa Italiana & SSE 50 index (Shanghai stock exchange composite index) reflecting the top 50 companies by "float-adjusted" capitalization. Italian stock exchange ranks as the world's 108th stock market and has been a London stock exchange affiliate since 2007. The full summary of the data used in our analysis is set out in Table 1.
| Table 1 Description Of The Sample |
||||
|---|---|---|---|---|
| Country | Sample | Variables | Database | Period |
| Italy and China | FTSE MIB (40 Stock) SSE 50 |
Daily Stock Returns(SR) Daily Confirmed Cases(CC) Total Daily Deaths(TDC) Market Capitalization(MCAP) Market to book ratio(MTB) |
Bloomberg Worldometer |
Feb 15 to March 30 2020 |
Sources: Author’s own work.
This research uses Static Panel data analysis, which is a highly efficient econometric method for Kao (1999) prediction. Three models (OLS pooled, Fixed and Random Effects) are available in the Panel Results. The Cluster Robust estimators are used in this analysis. Baltagi suggests that the FE model is a suitable model in which to evaluate how the sample size focuses on a certain number of N companies (for example, where the sample contains all shares exchanged on a particular exchange). In addition, the FE model is used to evaluate the impacts over Baltagi of variables that differ in time. The Model of Fixed Effects is then used to evaluate stock output due to COVID-19.
Model Specification
The stock return is estimated as follows:
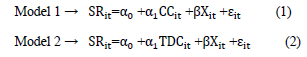
Where,
 denotes daily stock return at day , regressed on the values of firm return predictors, which are
  daily confirmed cases and
 dailydeath cases caused by COVID-19.
 is a vector of firm-specific characteristics and
 Consists of natural logarithm of daily market capitalization (MCAP) and daily market-to-book ratio (MTB).
Results and Discussion
The pandemic originated in Asia, China and spread throughout the rest of the continent. The largest growing economy and product exporters in the world are China. China. A major outbreak was announced in Italy later in February. In Europe as well as part of China, Italy actually had the highest number of Covid-19 events. Italy has a fantastic tourist destination and is a member state of the European Union. Figure 3A and Figure 3B show reported regular deaths in Italy and China from nCOV. The Chinese Covid-19 estimates that on 31 March 2020 81,554 cases were reached. Most confirmed deaths and deaths of death have been recorded across the whole continent in China.

Figure 3a:Daily Active Confirmed Covid-19 Cases In Italy.
Likewise, according to the information provided, on 23 March Italy's COVID-19 cases exceeded 59,138, marking the largest outbreak of Covid-19 outside Asia. Figure 3A and Figure 3B show that the highest increase in confirmed cases is recorded in Italy and China. Italy is the world's second most infected country after China with a rate that is higher than any other nation (Duddu. P (MARCH 23, 2020).

Figure 3b:Daily Active Confirmed Covid-19 Cases In China.
Figure 4A and Figure 4B show confirming cases in Italy and China every day for Covid-19. In fact, Wuhan was the epicenter of the pandemic in China, with 83% of all the cases and 95% of the deaths in February 21, according with the World Health Organization (WHO). In all 31 provinces of mainland China, between June and February, there was a COVID-19 outbreak. Similarly, in Italy 5,476 death cases, which rose sharply in March. On 21 March, almost 800 deaths in a single day were announced by the government.

Figure 4a:Daily Active Confirmed Cases Of Death Due To Covid-19 In Italy.

Figure 4b:Daily Active Confirmed Cases Of Death Due To Covid-19 In China.
Figure 5A and Figure 5B presents the daily stock returns of Italy and China included in our study. Due to outbreak the Stock Market is also affected.

Figure 5a:Daily Stock Returns During Covid-19 In Italy.

Figure 5b:Daily Stock Returns During Covid-19 In China.
The figures indicated that the Stock Performance are negatively related to Confirmed Cases and Death Cases due to Covid-19 in Italy and China both.
Summary Statistics
Table 2 below also depicts descriptive analysis of Italian and Chinese details. Table 2A reveals that Italy's average daily stock return during the period is 10.9 and the minimum is -9.1. The highest increase in confirmed cases per day is 4.25, while in overall reported cases of death caused by COVID-19, the highest increase is 2.694. Likewise in Table 2B, the average daily stock return of China over the period is -36.98 and 43. The highest rise in total daily reported cases is .024and the highest increase in total daily deaths caused by COVID-19 is .136.
| Table 2A Descriptive Statistics Of Italy |
|||||
|---|---|---|---|---|---|
| Variable | Obs | Mean | Std. Dev. | Min | Max |
| SR | 1263 | -.115 | .998 | -9.1 | 10.9 |
| CC | 1263 | .472 | .869 | -1 | 4.25 |
| TCD | 1263 | .257 | .642 | -.995 | 2.694 |
| MCAP | 1263 | 8.888 | .931 | 6.931 | 11.375 |
| MTB | 1263 | -.018 | .201 | -2.543 | 1.83 |
Sources: Stata Output.
Correlation matrix
The data correlation matrix is shown in Table 3. The Table 3A and Table 3B show that daily stocks are negative with daily growth in total reported cases and with the regular growth in total cases of COVID-19 deaths (Al-Awadhi et al., 2020). Due to Covid-19, stock performance in both countries has been negatively linked to the confirmed cases and death cases.
| Table 2B Descriptive Statistics Of Chinese Market |
|||||
|---|---|---|---|---|---|
| Variable | Obs | Mean | Std.Dev. | Min | Max |
| SR | 1600 | .096 | 2.86 | -36.98 | 43 |
| CC | 1600 | .0003 | .0206 | -.112 | .024 |
| TDC | 1600 | .005 | .083 | -.436 | .136 |
| MCAP | 1600 | 12.474 | 1.285 | 9.687 | 17.188 |
| MTB | 1600 | 10.119 | 295.878 | -4003.898 | 4655.695 |
Sources: Stata Output
The findings of our panel data checks, Table 4A and Table 4B, evaluated all the stocks found in the Italian stock market and in China during the COVID-19 outbreak. In total COVID-19 cases in Italy and China, the findings indicate a major negative association with the daily reported cases and the average tests. Investors are skeptical of investment opportunities and sell stocks in stock markets Bai (2014) and Baker et al. (2012) for communicable diseases.
| Table 3A Matrix Of Correlations Of Italian Market |
|||||
|---|---|---|---|---|---|
| Variables | -1 | -2 | -3 | -4 | -5 |
| (1) SR | 1 | ||||
| (2) CC | -0.053 | 1 | |||
| (3) TDC | -0.062 | 0.148 | 1 | ||
| (4) MCAP | 0.016 | 0.053 | 0.032 | 1 | |
| (5) MTB | 0.668 | -0.036 | 0.072 | 0.038 | 1 |
Sources: Stata Output
| Table 3B Matrix Of Correlations Of Chinese Market |
|||||
|---|---|---|---|---|---|
| Variables | -1 | -2 | -3 | ||
| (1) SR | 1 | ||||
| (2) CC | -0.032 | 1 | |||
| (3) TDC | -0.036 | 0.986 | 1 | ||
| (4) MCAP | 0.042 | -0.003 | -0.001 | 1 | |
| (5) MTB | 0.964 | -0.013 | -0.017 | 0.045 | 1 |
Sources: Stata Output
Both the Models for Market Capitalization (MCAP) in Italy and China are substantially negative in terms of daily stock returns, as other factors influence the market value of companies: gross domestic product, currency levels, interest rates, current account, and money supply. Because of outbreaks, the companies' net worth is also impaired so that the ties between MCAP and SR are adversely impaired (Ologunde et al., 2006).
The book-to - market (MRB) ratio is significantly linked to Italy and China's daily stock return. The average growth prospects for MTB ratios are increasing. A high MTB ratio is usually predictive of a substantial potential income growth on the sector as a whole (Gottwald, 2012). The share price is affected during the outbreak, which means that MTB is linked positively to SR.
Tables 4A and Table 4B presents a comprehensive synopsis of the 25 selected articles based on the topic, objective, findings, and recommendation. The data presented was critical for the eligibility assessment of each article.
| Table 4A Static Panel Estimation Of Italian Market |
||
|---|---|---|
| Dep Var: SR VARIABLES |
(1) MODEL 1 |
(2) MODEL 2 |
| CC | -0.0428** | |
| (0.0191) | ||
| MCAP | -0.0533** | -0.0897* |
| (0.0246) | (0.0504) | |
| MTB | 3.299** | 3.068** |
| (1.392) | (1.343) | |
| TDC | -0.128** | |
| (0.0630) | ||
| Constant | 0.440** | -0.837* |
| (0.217) | (0.450) | |
| Observations | 1263 | 1263 |
| R-squared | 0.463 | 0.451 |
| Number of Companies | 40 | 40 |
Sources: Stata Output
Robust standard errors in parentheses
*** p<0.01, ** p<0.05, * p<0.1
| Table 4B Static Panel Estimation Of Chinese Market |
||
|---|---|---|
| Dep Var: SR VARIABLES |
(1) Model 1 |
(2) Model 2 |
| CC | -2.538*** | |
| (0.751) | ||
| MCAP | -2.525*** | -2.548*** |
| (0.454) | (0.457) | |
| MTB | 0.00930*** | 0.00930*** |
| (9.08e-05) | (9.06e-05) | |
| TDC | -0.709*** | |
| (0.191) | ||
| Constant | -31.49*** | -31.78*** |
| (5.661) | (5.695) | |
| Observations | 1,600 | 1,600 |
| R-squared | 0.931 | 0.931 |
| Number of Companies | 50 | 50 |
Sources: Stata Output
Robust standard errors in parentheses
*** p<0.01, ** p<0.05, * p<0.1
Conclusion
In the sense of COVID-19, it has been shown to have a negative impact on stock returns by examining both the stocks of the Italian stock market and the Chinese stock market. The findings are therefore considered to be negative. In the daily reported cases as well as in the daily cases of death caused by the virus, stock findings are significantly negative. The proliferation of the virus has caused worldwide panic and destroyed investor trust.
As consumers demand most important items in both countries due to lockdown, SMEs are engines for business in most countries worldwide. As the findings also show that market capitalization is negatively connected to stock returns, small businesses play a key role in crises in the economy.
Stock prices represent future sales; expenditure is concerned about future sales and the outbreak is perceived as damping economic activity. This study will allow financial policymakers to evaluate the financial crisis in this COVID-19 pandemic. In this pandemic, lawmakers will help to assess the ever fall in the stock market. It will help them to quantify this catastrophe.
References
Al-Awadhi, A.M., Alsaifi, K., Al-Awadhi, A., & Alhammadi, S. (2020). Death and contagious infectious diseases: Impact of the COVID-19 virus on stock market returns. Journal of Behavioral and Experimental Finance, 27, 100326.
Indexed at, Google Scholar, Cross Ref
Alsaifi, K., Elnahass, M., & Salama, A. (2020). Market responses to firms’ voluntary carbon disclosure: Empirical evidence from the United Kingdom. Journal of Cleaner Production, 262, 121377.
Indexed at, Google Scholar, Cross Ref
Bai, Y. (2014). Cross-border sentiment: an empirical analysis on EU stock markets. Applied Financial Economics, 24(4), 259-290.
Indexed at, Google Scholar, Cross Ref
Baker, M., Wurgler, J., & Yuan, Y. (2012). Global, local, and contagious investor sentiment. Journal of Financial Economics, 104(2), 272-287.
Bash, A., & Alsaifi, K. (2019). Fear from uncertainty: An event study of Khashoggi and stock market returns. Journal of Behavioral and Experimental Finance, 23, 54-58.
Indexed at, Google Scholar, Cross Ref
Buhagiar, R., Cortis, D., & Newall, P.W. (2018). Why do some soccer bettors lose more money than others?. Journal of Behavioral and Experimental Finance, 18, 85-93.
Indexed at, Google Scholar, Cross Ref
Duddu.P (2020). Coronavirus in Italy: Outbreak, measures and impact.
Gottwald, R. (2012). The use of the P/E ratio to stock valuation. European Grants Projects Journals, 2012, 21-24.
Guo, M., Kuai, Y., & Liu, X. (2020). Stock market response to environmental policies: Evidence from heavily polluting firms in China. Economic Modelling, 86, 306-316.
Indexed at, Google Scholar, Cross Ref
Kao, C. (1999). Spurious regression and residual-based tests for cointegration in panel data. Journal of Econometrics, 90(1), 1-44.
Indexed at, Google Scholar, Cross Ref
Li, K. (2018). Reaction to news in the Chinese stock market: A study on Xiong’an New Area Strategy. Journal of Behavioral and Experimental Finance, 19, 36-38.
Indexed at, Google Scholar, Cross Ref
Ologunde, A.O., Elumilade, D.O., & Asaolu, T.O. (2007). Stock market capitalisation and interest rate in Nigeria: A time series analysis. Economic and Policy Review, 13(2), 154-166.
Indexed at, Google Scholar, Cross Ref
Pharmaceutical Technology, (2020) Coronavirus: A timeline of how the deadly Covid-19 outbreak is evolving.
Sohrabi, C., Alsafi, Z., O'neill, N., Khan, M., Kerwan, A., Al-Jabir, A., & Agha, R. (2020). World Health Organization declares global emergency: A review of the 2019 novel coronavirus (COVID-19). International Journal of Surgery, 76, 71-76.
Indexed at, Google Scholar, Cross Ref
Shanaev, S., & Ghimire, B. (2019). Is all politics local? Regional political risk in Russia and the panel of stock returns. Journal of Behavioral and Experimental Finance, 21, 70-82.
Indexed at, Google Scholar, Cross Ref
Shereen, M.A., Khan, S., Kazmi, A., Bashir, N., & Siddique, R. (2020). COVID-19 infection: Emergence, transmission, and characteristics of human coronaviruses. Journal of Advanced Research, 24, 91-98.
WEF (2020). World Economic Forum, the Global Risks Report 2020.
Yang, Y., Peng, F., Wang, R., Guan, K., Jiang, T., Xu, G., & Chang, C. (2020). The deadly coronaviruses: The 2003 SARS pandemic and the 2020 novel coronavirus epidemic in China. Journal of Autoimmunity, 109, 102434.
Indexed at, Google Scholar, Cross Ref
Zach, T. (2003). Political events and the stock market: Evidence from Israel. International Journal of Business, 8(3).
Indexed at, Google Scholar, Cross Ref
Received: 16-Dec-2021, Manuscript No. AAFSJ-21-10513; Editor assigned: 18-Dec-2021, PreQC No. AAFSJ-21-10513(PQ); Reviewed: 03-Jan-2022, QC No. AAFSJ-21-10513; Revised: 17-Jan-2022, Manuscript No. AAFSJ-21-10513(R); Published: 24-Jan-2022