Research Article: 2018 Vol: 22 Issue: 2
The Effect of Dividend Policy on Stock Price Volatility: Empirical Evidence from Amman Stock Exchange
Muhannad Akram Ahmad, Al-Bayat University
Ashraf Mohammad Salem Alrjoub, Al-Balqa Applied University
Hussein Mohammed Alrabba, Yarmouk University
Keywords
Dividend Policy, Stock Price, Volatility, Emerging Market.
JEL Code: C23, E31, G1
Introduction
Different issues relating to dividend policy have been studied by past studies (e.g. Black, 1976; DeAngelo et al., 1996; Miller & Modigiliani, 1961). Except for the theories on dividend payment (such as stakeholders, pecking order, agency cost, signalling, bird-in-hand fallacy and clientele effect), some of the major issues these past studies examined are related to the insignificance of dividend policy (Miller & Modigiliani, 1961), the puzzle in dividend payment (Black, 1976), as well as the relevance of dividend policy (DeAngelo et al., 1996). However, the popularity of dividend policy in recent studies is due to other issues which are related to separation of ownership and control and information asymmetry (Al-Malkawi, 2007; Al-Najjar & Hussainey, 2009; Hussainey et al., 2011).
On the other hand, the systemic risk facing investors that hold ordinary shares investments is known as stock price volatility (Guo, 2002). Since investors are risk averse by nature, their investments volatility is imperative to them as it measures the level of their risk exposure (Hussainey et al., 2011). The Amman stock exchange market, which is an emerging market, still shows some features of an immature market, with weak regulations in compare to developed markets in Europe and America. Investors in this type of market concentrate more on their dividend returns due to the substantial market risk and undiversified volatility, which in the long run, may have effect on the firm’s shares valuation. This implies that stock prices are important to both firms and investors.
However, the relationship between dividend policy and stock price volatility is still not clear as scholars (e.g. Baskin, 1989; Allen & Rachim, 1996; Hussainey et al., 2011) have continue to argue whether dividend policy influence stock price volatility. In line with this argument, this paper aimed to establish a link between dividend policy and stock price volatility in the context of Amman stock Exchange in Jordan.
The premise of the research is based on the theoretical framework used by previous studies (which include Baskin, 1989; Allen & Rachim, 1996; Hussainey et al., 2011), but different in terms of the type of market, firms, years and period of study. Therefore, Pearson correlation and Panel Generalized Method of Moments (GMM) was employed to examine the effect of dividend policy on stock price volatility in Amman Stock Exchange Jordan, to establish which firms’ dividend policy affect changings in their stock price.
Literature Review
Studies have examined the effect of dividend policy on stock price volatility but most of the established studies was done on firms in developed market such as USA (Baskin, 1989; Profilet & Bacon, 2013), Australia (Allen & Rachim, 1996) and the UK (Hussainey et al., 2011). Baskin (1989) examines the impact of dividend policy on the volatility of 2344 US common stocks from the period 1967 to 1986. His findings show a huge and strong inverse relationship between dividend yields and stock price volatility, which implies that dividend policy influence stock price volatility. Allen & Rachim (1996) examined the relationship between dividend policy and stock price volatility of 173 Australian listed firms from the period 1972 to 1985. Their findings show that there is no relationship between dividend yield and stock price volatility. In addition, they also found that stock price volatility has a positive relationship with earnings volatility, but a negative relationship with the pay-out ratio. Their findings imply that dividend policy does not clearly impact volatility of stock price since there are mixed causality from the results, which is not in line with the findings of Baskin (1989).
Hussainey et al. (2011) examine the relationship between dividend policy and changes in the share price of non-financial firms in the UK stock market from the period 1998 to 2007. Their findings show that stock price volatility has a positive relationship with dividend yield but a negative relationship with dividend pay-out ratio. Their findings are in line with the findings of Allen & Rachim (1996) but in contrast to the results of Baskin (1989) in terms of pay-out ratio and stock price volatility relationship. Profilet and Bacon (2013) examine the effect of dividend policy on stock price volatility of 599 firms in the US equity capital market from the period 2010-2012. By using an OLS regression analysis, their findings showed that dividend yield and stock price volatility have negative relationship, but the relationship between stock price volatility and dividend pay-out is positive and insignificant.
Some studies were also carried out in emerging markets. In different studies, Hashemijoo, Ardekani and Younesi (2012) and Zakaria, Muhammad and Zulkifli (2012) examine the relationship between dividend policy and share price volatility in the Malaysian stock market. Hashemijoo et al. (2012) concentrate on examining a sample of 84 listed consumer product firms from the period 2005 to 2010 and found share price volatility has a negative relationship between the measures of dividend policy (i.e., dividend pay-out and dividend yield). On the other hand, Zakaria et al. (2012) focus on examining a sample of 106 listed construction and mineral firms from the period 2005 to 2010 and found that there is a positive relationship between dividend pay-out ratio and share price volatility, but insignificant negative relationship between dividend yield and share price volatility of the firms. Hooi, Albaity and Ibrahimy (2015) also focus on Malaysia market and examine a sample of 319 firms from the Kuala Lumpur stock exchange. They found those dividend yield and dividend pay-outs are negatively related with share price volatility.
Nazir et al. (2010) examine the role of dividend policy in determining the share price volatility in Karachi Stock Exchange (KSE) in Pakistan with a sample of 73 firms and from the period 2003 to 2008. They found that dividend yield has positive relationship with share price volatility and dividend pay-out ratio has negative relationship with share price volatility. Ilaboya and Aggreh (2013) and Sulaiman and Migiro (2015) focus on Nigeria stock market. Ilaboya and Aggreh (2013) examine dividend policy and share price volatility of 26 firms across sectors in the Nigerian Stock Exchange market from the period 2004 to 2011. They found a positive relationship between dividend yield and share price volatility, but a negative relationship between dividend pay-out and share price volatility. Sulaiman and Migiro (2015) examine 15 firms in the Nigeria stock market and from the period 2003 to 2012. Their findings show that earnings per share and dividend per share have a robust positive relationship with changes in share price.
In the context of Jordan, Ramadan (2013) and AlQudah & Yusuf (2015) in separate studies examined dividend policy and stock price volatility in Jordanian stock market. Ramadan (2013) examines 77 industrial firms listed on the Amman Stock Exchange from the period 2000 to 2011 and found that both dividend yield and dividend pay-out have significant negative influence on share price volatility, which indicate that dividend policy has impact on the share price volatility. AlQudah & Yusuf (2015) examine firms in Amman Stock Exchange from the period 2001 to 2011 and found that dividend yield and dividend pay-out has significant negative impact on volatility of share price. These two studies have established that dividend policy influence stock price volatility in Jordan stock market in the period they studied. However, this present study aims to focus on all the firms in the Amman Stock Exchange from the period 2010 to 2016 to show new evidence of effect of dividend policy on stock price volatility.
Methodology
The data for this study was retrieved from the DataStream and 228 firms listed on the Amman Stock Exchange from the period 2010 to 2016 were applied. These firms and there are listed as follows below in Table 1:
| Table 1 List Of Firms And Industries |
||
| Industry | Number of firms | |
| 1. | Automobiles & Parts | 2 |
| 2. | Banks | 12 |
| 3. | Beverages | 2 |
| 4. | Chemicals | 7 |
| 5. | Construction and Materials | 7 |
| 6. | Electronic & Electrical Equipment | 4 |
| 7. | Financial Services | 20 |
| 8. | Fixed Line Telecommunications | 1 |
| 9. | Food & Drug Retailers | 2 |
| 10. | Food Producers | 8 |
| 11. | Forestry & Paper | 5 |
| 12. | Gas, water & Multiutilities | 6 |
| 13. | General Industrials | 2 |
| 14. | General Retailers | 15 |
| 15. | Health Care Equipment & Services | 5 |
| 16. | Household Goods & Home Construction | 5 |
| 17. | Industrial Engineering | 3 |
| 18. | Industrial Metals & Mining | 5 |
| 19. | Industrial Transportation | 17 |
| 20. | Leisure Goods | 6 |
| 21. | Life & Non-life insurance | 6 |
| 22. | Media | 5 |
| 23. | Mining | 2 |
| 24. | Mobile Telecommunications | 2 |
| 25. | Oil & Gas Producers | 2 |
| 26. | Oil Equipment & Services | 4 |
| 27. | Personal Goods | 25 |
| 28. | Pharmaceuticals & Biotechnology | 6 |
| 29. | Real Estate Investment Trusts & Services | 15 |
| 30. | Support Services | 5 |
| 31. | Technology Hardware & Equipment | 10 |
| 32. | Travel & Leisure | 12 |
| Total | 228 | |
Variables Measurement
The dependent variable for this study is stock price volatility which is measured using the formula proposed by Baskin (1989) using the annual range of stock prices divided by the average of the high and low prices in the year, raised to the second power as the measurement. This can be depicted as:
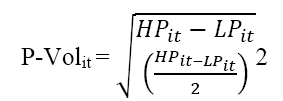
Where P-Volit serve as the stock price volatility for firm ith in time tth, HP means the highest stock price for firm ith in time tth, while LP means the lowest stock price for firm ith in time tth.
Dividend policy is represented through two independent variables, which are dividend yield and dividend pay-out ratio. The other variables are the control variables which are earnings volatility, firm size, financial leverage and growth. All the measurement of the variables is depicted in Table 2 below.
| Table 2 Variables Measurement |
||||
| No | Variables | Connotation | Measurement | Sources |
| 1. | Price Volatility | P-Vol | Annual range of stock prices divided by the average of the high and low prices in the year, raised to the second power. | Baskin (1989), Allen & Rachim (1996) |
| 2. | Dividend Yield | DY | Dividend per share divided by price per share | Baskin (1989), Allen & Rachim (1996) |
| 3. | Dividend Pay-out | DP | Dividend per share divided by earnings per share | Baskin (1989), Allen & Rachim (1996) |
| 4. | Earnings Volatility | EV | Standard deviation of earnings for themost recent preceding five years for each year | Baskin (1989), Hussainey et al. (2011) |
| 5. | Firm Size | SIZE | Number of ordinary shares multiplied by price per share | Baskin (1989), Allen & Rachim (1996) |
| 6. | Financial Leverage | LEV | Ratio of long term debt to total assets | Nazir et al. (2010) |
| 7. | Growth | GROWTH | Change in total assets divided by total assets | Hussainey et al. (2011) |
| 8. | Constant term | α | Constant term | |
| 9. | Error term | ε | Error term | |
To estimate the relationship between the independent variables and the dependent variable, the following model was applied:
P-Volit = α+ β1DYit + β2DPit+ β3EVit+ β4SIZEit + β5LEVit+β6GROWTHit + εit
Analysis and Findings
Table 3 below depicts the summary of descriptive statistics of the variables:
| Table 3 Summary Of Statistics |
||||||||
| Obs | Mean | Median | Maximum | Minimum | Std. Dev. | Variance | Range | |
| P-Vol | 1596 | 0.8631 | 0.5482 | 1.9482 | 0.0924 | 0.4212 | 0.2573 | 1.8558 |
| DY | 1596 | 0.4918 | 0.2481 | 5.7438 | 0.0476 | 0.6362 | 0.3252 | 5.6962 |
| DP | 1596 | 0.5827 | 0.7413 | 4.9262 | 0.0793 | 0.5974 | 0.3034 | 4.8469 |
| EV | 1596 | 2.4784 | 2.4468 | 6.2142 | 1.9215 | 0.8583 | 0.6882 | 4.2927 |
| SIZE | 1596 | 12.487 | 12.829 | 15.836 | 3.3836 | 2.9582 | 1.8524 | 12.452 |
| LEV | 1596 | 0.3518 | 0.2597 | 12.864 | -8.5421 | 6.5392 | 3.2742 | 21.406 |
| GROWTH | 1596 | 0.3247 | 0.2259 | 3.5962 | 1.7343 | 0.4842 | 0.2461 | 1.8619 |
From the descriptive statistics in Table 3 above, the price volatility (P-Vol) show a mean of 0.8631 and standard deviation of 0.4212. In following Baskin (1989), Allen & Rachim (1996) and Hussainey et al. (2011) results, the Parkinson (1980) formula is used to test whether the stock price follows a normal distribution pattern since a large sample is used and by disregarding the impact of on-going ex-dividend of the firm, which will make the standard deviation of the stock market returns to equal this study’s measured volatility. Thus, using Parkinson (1980) formula by multiplying the mean of the price volatility, 0.8631, with the constant, 0.6008, it gives a result of 51.86 percent. This finding is consistent with the findings on firms in developed markets such as US firms (Baskin, 1989) with 36.9 percent, Australian firms (Allen & Rachim, 1996) with 29.42 percent, UK firms (Hussainey et al., 2011) with 17.66 percent, as well as findings on firms in developing markets such as Malaysian firms (Hashemijoo, 2012) with 39.6 percent and past study on Jordanian firms (Al-Qudah & Yusuf, 2015) with 44.25 percent.
Table 4 depicts the correlation coefficient implying the extent of linear relationship amongst the variables. However, variance inflation factor (VIF) was carried out to test the existent of multicollinearity in the variables. The VIF test shows that earning volatility (EV) has the largest VIF of 3.483, which indicates the absence of multicollinearity between the variables (Hair et al., 2006; Studenmund, 1997). Meanwhile, in Table 4, price volatility and dividend yield indicate a negative significant correlation (-0.462) at 1% significant level, which is consistent with the findings of Baskin (1989) and Hussainey et al. (2011) but contrary to the study of Allen & Rachim (1996) that shows positive correlation. Also, price volatility and dividend payout show a negative correlation (-0.614) at 1% significant level. Furthermore, price volatility has negative and positive correlation with size and leverage at 1% and 10% significant level respectively.
| Table 4 Correlation Matrix |
|||||||
| P-Vol | DY | DP | EV | SIZE | LEV | GROWTH | |
| P-Vol | 1.000 | ||||||
| DY | -0.462*** | 1.000 | |||||
| DP | -0.614*** | 0.234*** | 1.000 | ||||
| EV | 0.247 | -0.398 | -0.536*** | 1.000 | |||
| SIZE | -0.032** | -0.542 | 0.064* | 0.581 | 1.000 | ||
| LEV | 0.061* | 0.023** | 0.028** | 0.386 | 0.403 | 1.000 | |
| GROWTH | -0.453 | -0.019** | 0.043** | 0.052* | 0.642 | -0.491 | 1.000 |
Significance levels are at 1% (***), 5% (**) and 10% (*)
Table 5 shows the regression analysis of the variables used in this study with GMM. The R-squared shows 52.54% (0.525441), implying that both the dividend policy variables and the control variables explained 52.54% variations in stock price volatility. The regression shows that price volatility has a negative and significant relationship with dividend yield (at b= -3.247, p>0.004) and dividend pay-out (at b= -0.496, p>0.001) at 1% significant level. This indicates that both dividend yield and dividend pay-out have negative effect on price volatility and play defining role in influencing stock price. As the inclusion of control variables confirm the veracity of the findings and improve the model’s explanatory power, it implies that the higher the dividend yield and dividend pay-out the lower the stock price volatility. Earning volatility and stock price volatility have positive and significant relationship (at b=1.531, p>0.013) at 5% significant level, implying that earning volatility positively influence stock price volatility. Firm size also has positive and significant relationship with stock price volatility (at b=3.233, p>0.001) at 1% significant level, which implies that the price volatility and share price risk of larger firms are lower than smaller firms. Leverage (at b= 0.542, p>0.001) and Growth in assets (at b=0.143, p>0.000) also have positive and significant relationship with price volatility at 1% significant level. The findings imply that the higher the leverage, the higher the stock price volatility; also, the higher in assets growth the higher the stock price volatility.
| Table 5 Regression Analysis Using Gmm Estimation |
||||
| Variable | Coefficient | Std. Error | t-Statistic | Prob. |
| C | 3.451 | 0.654 | 4.427 | 0.023 |
| DY | -3.247 | 0.704 | -0.932 | 0.004*** |
| DP | -0.496 | 0.572 | -3.458 | 0.001*** |
| EV | 1.531 | 0.462 | 2.116 | 0.013** |
| SIZE | 3.233 | 0.324 | 4.621 | 0.001*** |
| LEV | 0.542 | 0.331 | 2.751 | 0.001*** |
| GROWTH | 0.143 | 0.284 | 0.352 | 0.000*** |
| R-squared | 0.525441 | Mean dependent var | 1.635362 | |
| Adjusted R-squared | 0.486352 | S.D. dependent var | 1.462143 | |
| S.E. of regression | 1.203725 | Sum squared resid | 521.3253 | |
| Durbin-Watson stat | 1.210564 | J-statistic | 354.0000 | |
| Instrument rank | 8 | Prob(J-statistic) | 0.000000 | |
Significance levels are at 1% (***), 5% (**) and 10% (*)
Summary and Conclusion
The aim of this study is to examine the effect of dividend policy on stock price volatility, with evidence from Amman stock exchange. Furthermore, 228 firms listed on the Amman Stock Exchange from the period 2010 to 2016 were applied. By applying descriptive analysis, Pearson correlation and panel GMM analysis, the findings show that dividend policy influence the stock price volatility of listed firms in Amman stock exchange, Jordan. Both main variables of dividend policy, which are dividend yield and dividend pay-out ratio, have negative influence on stock price volatility. The findings are consistent with past studies such as Allen & Rachim (1996) and Hussainey et al. (2011).
This implies that the higher the dividend yield and dividend pay-out the lower the stock price volatility, which is in line with the duration effect theory as high dividend yield could be regarded as near cash that lessen uncertainty on firms’ cash flows and result to reduction in discount rate fluctuation and higher price stability. Moreover, the negative relationship between high dividend yield and high dividend pay-out is in line with the signalling theory as high dividends are a sign of the firms’ stability.
However, there are other determinants of dividend policy and theories that affect share price volatility and risk. These areas can be given consideration in further interested studies.
References
- Allen, D.E. & Rachim, V.S. (1996). Dividend policy and stock price volatility: Australian evidence. Applied Financial Economics, 6(2), 175-188.
- Al-Malkawi, H.N. (2007). Determinants of corporate dividend policy in Jordan: An application of the Tobit model. Journal of Applied Accounting Research, 23, 44-70.
- Al-Najjar, B. & Hussainey, K. (2009). The association between dividend pay-out and outside directorships. Journal of Applied Accounting Research, 10, 4-19.
- AlQudah, A., Yusuf, D. & El-Deen, A.N. (2015). Stock Price Volatility and Dividend Policy in Jordanian Firms. Research Journal of Finance and Accounting, 6(22), 15-22.
- Asghar, M., Shah, S.Z.A., Hamid, K. & Suleman, M.T. (2011). Impact of dividend policy on stock price risk: Empirical evidence from equity market of Pakistan. Far East Journal of Psychology and Business, 4(1), 45-52.
- Baskin, J. (1989). Dividend policy and the volatility of common stock. Journal of Portfolio Management, 15, 19-25.
- Black, F. (1976). The dividend puzzle. Journal of Portfolio Management, 2, 5-8.
- DeAngelo, H., DeAngelo, L. & Skinner, D.J. (1996). Reversal of fortune: Dividend policy and the disappearance of sustained earnings growth, Journal of Financial Economics, 40(3), 341-371.
- Guo, H. (2002). Stock market returns, volatility and future output. Available at: www.research.stlouisfed.org/publications/review/02/09/75-86Guo.pdf.
- Ilaboya, O.J. & Aggreh, M. (2013). Dividend policy and share price volatility. Journal of Asian Development.
- Hair, J.F., Black, B., Babin, B., Anderson, R.E. & Tatham, R.L. (2006). Multivariate data analysis. Bask?. Upper Saddle River, NJ: Pearson Prentice Hall). (Vol. 6). https://pdfs.semanticscholar.org/6885/bb9a29e8a5804a71bf5b6e813f2f966269bc.pdf.
- Hashemijoo, M., Mahdavi-Ardekani, A. & Younesi, N. (2012). The impact of dividend policy on share price volatility in the Malaysian stock market.
- Hooi, S.E., Albaity, M. & Ibrahimy, A.I. (2015). Dividend policy and share price volatility. Investment Management and Financial Innovations, 12(1), 226-234.
- Hussainey, K., Oscar Mgbame, C. & Chijoke-Mgbame, A.M. (2011). Dividend policy and share price volatility: UK evidence. The Journal of Risk Finance, 12(1), 57-68.
- Jo, H. & Pan, C. (2009). Why are firms with entrenched managers more likely to pay dividends? Review of Accounting & Finance, 8(1), 87-116.
- Marseguerra, G. (1998). Dividend policy and stock price volatility. In Corporate Financial Decisions and Market Value (41-65). Physica-Verlag HD.
- Miller, M.H. & Modigliani, F. (1961). Dividend policy, growth and the valuation of shares. The Journal of Business, 34, 411-433.
- Profilet, K.A. & Bacon, F.W. (2013). Dividend policy and stock price volatility in the US equity capital market. ASBBS Proceedings, 20(1), 219.
- Ramadan, I.Z. (2013). Dividend policy and price volatility. Empirical evidence from Jordan. International Journal of Academic Research in Accounting, Finance and Management Sciences, 3(2), 15-22.
- Rashid, A. & Rahman, A.A. (2008). Dividend policy and stock price volatility: Evidence from Bangladesh. The Journal of Applied Business and Economics, 8(4), 71.
- Shiller, R.J. (1987). Investor behaviour in the October 1987 stock market crash: Survey evidence.
- Studenmund, A.H. (1997). Using econometrics: A practical guide. New York Addison-Wesley.file: ///C:/Users/Hp/Downloads/A.H.%20StudenmundUsing%20Econometrics_%20A%20Practical%20Guide-Pearson%20(2013).pdf
- Sulaiman, L.A. & Migiro, S.O. (2015). Effect of dividend decision on stock price changes: Further Nigerian evidence. Investment Management and Financial Innovations, 12(1), 330-337.
- Zakaria, Z., Muhammad, J. & Zulkifli, A.H. (2012). The impact of dividend policy on the share price volatility: Malaysian construction and material companies. International Journal of Economics and Management Sciences, 2(5), 1-8.