Research Article: 2019 Vol: 23 Issue: 1
The Effect of Internal Variables of the Banks on Their Profitability: Empirical Study on Banks Listed on the Qatar Stock Exchange
Alaa Al Saedi, University of Basrah
Abstract
This study investigates the profitability levels and the effects of certain internal variables on these levels for commercial banks listed on the Qatari Stock Exchange. The study adopts Panel Data for a sample of eight banks over the period 2008 to 2017. The fixed-effect regression model was used to examine this sample to test the effect of equity, size, liabilities, liquidities, cash flow, investment, credit and deposits on the return on equity in the commercial banks in the Qatari context. The study concludes that there is a positive significant relationship between profitability of Qatari banks and the variables of equity, deposit and credit. However, there was no significant relationship between the profitability of Qatari banks and the variables of total assets, cash flow, liability, liquidity and investment, which means that Qatari banks depend on the core of banking business for their profitability.
Keywords
Bank, Profitability, Panel Data, Qatar.
Introduction
Profitability is one of the most important financial indicators by which to judge the performance of an organisation or activity (Salman et al., 2018). The goal of financial management is to maximize the market value of the shareholders’ wealth (Gitman, 1997; Lumby and Jones, 2011; Vernimmen et al., 2011), which is achieved through high levels of profitability; for example, through productivity gains. Furthermore, wealth can be eroded by inflation and the time value of money. Therefore, companies need to keep attaining high levels of achievement to ensure profits and therefore wealth.
Accountants, financial analysts and lenders are particularly interested in the level of profits, as one of the important indicators for evaluating the strength of any company. However, there are a number of inherent risks to achieving profits that have to be taken into account when analysing a company.
Meanwhile, because banks play an important role in the business environment (Nouaili et al., 2015), a strong banking system is vital to a country’s political, social and economic development (Duraj and Moci, 2015). This is clearly true in the case of Qatar during the past two decades.
Against this background, this research assesses the profitability of Qatari banks listed on the Qatar stock exchange and the internal factors affecting them by using multiple fixed-effect regression in which the Data Panel method was adopted for the period 2008 to 2017.
Hence, the idea and importance of this research lies in analysing the profitability of Qatari Banks listed on the Qatar Stock Exchange. It also finds the main internal factors affect these levels of profitability’s in order to help the users of financial statement determined their expectation by using these factors.
The research has been divided into five parts. Following this introduction, the second section reviews the literature on the concept and importance of profit and profitability and the factors which can influence it, while the third section discusses the methodology. The fourth section discusses the results, while the conclusions are presented the final section.
Literature Review
The concept of economic profit can be defined as the change in value of the net assets of an economic unit during a certain period. From an accounting perspective, it is the difference between the income generated by the economic unit in a certain period and the expenses incurred by the unit during the same period (Jeter and Chaney, 2012)
In either case, profitability is the relationship between the profits earned by an institution and the level of investment that contributed to these profits or the relationship between profits and sales. In relation to investment, profitability can be measured against the value of assets (return on assets), the value of equity (Return of Equity, ROE), or the number of shares (earnings per share, EPS) (Vernimmen et al., 2011). High profitability is a goal for institutions and a benchmark for judging the adequacy of an overall economic unit, department or branch (Gitman 1997; Lumby and Jones, 2011; Vernimmen et al., 2011).
Furthermore, profitability is a key objective for all organizations, and is essential to their survival. It is an important metric for investors, creditors and for measuring management efficiency. Therefore, considerable effort is spent by managerson the optimal use of available resources in order to achieve the best return possible for their owners. This return should be not less than that achieved on alternative investments that are exposed to the same degree of risk (Gitman, 1997; Lumby and Jones, 2011).
In this context, the researcher believes that the use of measures of profitability is better than using profits to provide a systematic basis for comparison between banks. For example, it is not useful to compare the profits of a large bank with those of a small bank. However, if profitability metric is used, then this provides a reasonable and acceptable method of evaluation of the different performances, allowing a strong verdict.
The profitability of the banks is affected by a number of factors, including what is external (outside the control of the management), such as GDP, inflation rates and growth rates, and internal (what is under the control of management) (Gul et al., 2011; Duraj and Moci, 2015; Shah, 2016; Zogjani et al., 2016; Erin et al., 2018). When it is acknowledged that the external factors are not under the control of management and all organizations are exposed to these simultaneously (Shah and Khan, 2017) , then the internal factors become of paramount importance to enable management to build policies, actions and procedures that will positively influence profitability.
In this regard, financial and accounting literature contains much research on the impact of different internal factors on the profitability of banks. We found that Molyneux and Thorton (1992) tested the profitability of banks in several European countries between 1986 and 1989. They test the impact of a number of factors like ownership structure, interest rate, liquidity, equity and overhead cost, where the researchers found a positive relationship between the rate of profitability and the equity, interest and the ownership structure. Another study by Berger (1995) tested the relationship between profitability and capital in banks at United States between 1983 and 1989 and between 1990 and 1992. He found positive in this relationship in the first period and in the second period (1990-1992) there was an adverse effect between profitability and capital, which led him to the conclusion that the relationship would be positive between capital and profitability when capital is less than optimal.
In 1997, Miller and Noulas studied credit risk and profitability. They found a negative relationship between credit risk and profitability. They noted that as long as there is a negative relationship between them, it means increasing risk associated with loans, which leads to a reduction in the number of loans. Reflected negatively on the profitability of banks (Miller and Noulas, 1997).
Demirguc-Kunt and Levine in 1998 found a positive relationship between size and profitability .The researchers found that size leads to an increase in funds available to banks, which leads to the ability of banks to grant loans more than reflected positively on the interest rates reflected in the level of profitability of banks (Demirguc-Kunt and Levine, 1998) In Tunisia, Naceur in 2001 examined the factors that affect the performance of Tunisian banks for the period from 1980 to 1995. He concluded that the best developed banks are making greater efforts to obtain the best banking employment, and that the best banks have the largest bank deposits. Finally, the best banks Owns the largest ownership rights (Naceur, 2001).
Chirwa (2003) studied the relationship between the profitability and some internal variables of commercial banks in Malawi using a series of data from 1974 to 1994, where a relationship was found between profitability with ownership structure, ratio of equity to assets, ratio of loans to assets and deposits. Other study examine the factors influencing the profitability of Turkish banks for the period from 2002 to 2007, where they found that there is a positive statistical significance between the ratio of equity to total assets and the profitability of Turkish banks (Guven and Onur, 2009)
In 2011, Havrylchyk and his colleagues found a positive correlation between capital and profitability of banks, where large banks seemed to be more efficient which is reflect on their profits, thus its abilities to maximize their interest income, which is main income for the banks (Havrylchyk et al., 2011).
In Uganda Frederick examines the factors affecting performance of commercial banks. The factors are analyzed in the light of Structure Conduct Performance (SCP) and Efficiency hypothesizes (ES) by using linear multiple regression analysis over the period 2000-2011, the study found that, management efficiency; asset quality; interest income; capital adequacy and inflation are factors affecting the performance of domestic commercial banks in Uganda over the period 2000-2011.(Frederick, 2014)
Lall study at 2014 the Factors affecting U.S. Banking Performance during financial crisis between 2007 and 2013. Among variables studied, loan marketing strategies and portfolio diversification, and interest rate risk and capitalization management strategies had a positive effect, while credit risk had a negative effect on profitability (Lall, 2014). In 2015 Al Saedi examine the effect of internal variables on profitability of Iraqi banks listed at Iraq stock exchange between 2002 and 2010. He found that there is a statistically significant positive relationship to both equity, liabilities, liquidity and investments on the profitability of banks (Al Saedi, 2015). Besides that, Kristianti and Yovin examine the internal factors that affect the performance of government and private banks in Indonesia for the period of 2004-2013. The results show that there are significant factors that influence the performance of the government banks they are operational efficiency, net interest margin, and non-performing loans. As for the private banks the factors are capital adequacy ratio and operational efficiency (Kristianti and Yovin, 2016).
performance of government and private banks in Indonesia for the period of 2004-2013. The results show that there are significant factors that influence the performance of the government banks they are operational efficiency, net interest margin, and non-performing loans. As for the private banks the factors are capital adequacy ratio and operational efficiency (Kristianti and Yovin, 2016).
Previous studies have tested many internal factors that affect the profitability of banks to reach that some of them have an effect and some are ineffective. This study to test all internal factors found (in previous studies) has an impact on the profitability of banks. Furthermore, the research contributes to the literature by using a case study based in an emerging market, Qatar, an economy that is characterized by continuous growth and significant investment opportunities; most studies in this field have been conducted in the developed markets.
From the above argument we can conclude that there are many internal factors such us equity, size, liabilities, liquidity, cash flow, investment and credit and deposit from/to customers which we can explained in the theoretical framework (Figure 1).
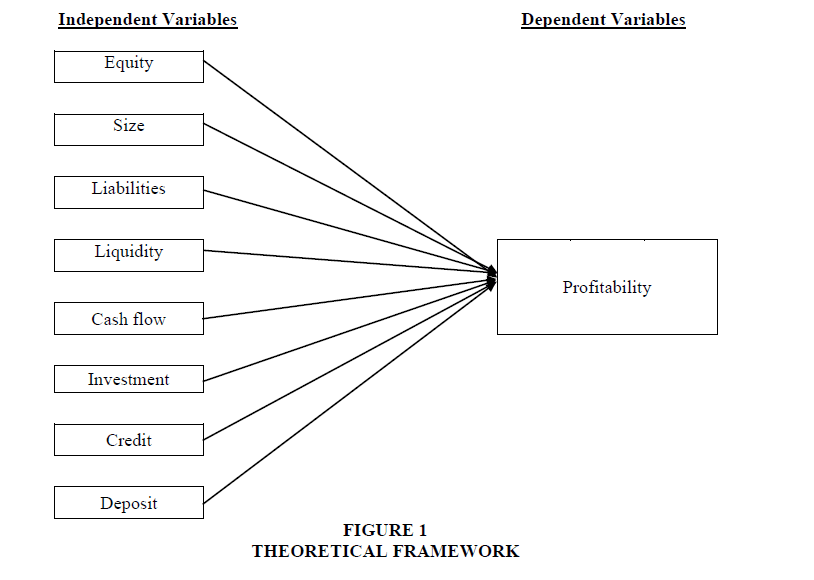
Figure 1: Theoretical Framework
As per the above argument and theoretical framework, the study address one main question about the effect of the internal factors on the profitability’s of the Qatari banks listed at Qatar stock exchange (QSE) which can be clarified by the following null hypothesis:
H0: There is no significant statistical effecting for internal factors on the bank profitability listed at Qatar Stock Exchange.
Methodology
Population and Sample
Most studies have been conducted on banks in the markets of developed countries. However, the emerging Qatari market has rising growth and future investment opportunities and in which the authorities apply the latest practices in the business world. Therefore, Qatari banks were chosen. The Qatar Stock Exchange lists nine banks. The researcher attempted to obtain the largest possible sample over as long as a period as possible in order to strengthen the results. The sample bank entry conditions were providing data for ten years from 2008. The number of banks that had this information was eight, which constitutes approximately 89% of the population.
Model of the Study
The goal of maximizing the wealth of owners/shareholders is one of the most important goals for management, which is done through the use of effective policies and actions (Lumby and Jones, 2011; Vernimmen et al., 2011). Furthermore, acceptable levels of profitability also maintain shareholders’ wealth. As discussed previously, profitability is influenced by many internal and external factors. As external factors are beyond the control of the management, the research focuses on the impact of internal factors, such as equity, size, liabilities, liquidity, cash flow, investment, credit and deposits on profitability in order to identify the most influential factor for profitability, through the following multiple regression equation:
Pit=A1+B1(Eit)+B2(Sit)+B3(Lit)+B4 (Lqit)+B5 (CFit)+B6 (Iit)+B7 (Crit)+B8 (Dit)+uit
Where,
Pit: Profitability: The earning per share used as a proxy for the profitability of the bank i for t period.
Eit: Equity: The book value for share used as a proxy for the equity of the bank i for t period for t period.
Sit: Size: The total assets per share used as a proxy for the size of the bank i for t period.
Lit: Liabilities: The total liabilities per share used as a proxy for the liabilities of the bank i for t period.
Lqit: Liquidity: The working capital per share used as a proxy for the liquidity of the bank i for t period.
CFit: Cash flow: The cash flow per share used as a proxy for the cash flow of the bank i for t period.
Iit: Investment: The total investment per share used as a proxy for the investment of the bank i for t period.
Crit: Credit: The total credit per share used as a proxy for the credit of the bank i for t period.
Dit: Deposit: The total deposit per share used as a proxy for the deposit of the bank i for t period.
The Use of Panel Data
Most studies use multiple regression for either cross section analysis or time series analysis. Cross section analysis can be undertaken in one of two ways. First by using multiple regression across a number of companies for one year, or second by computing the mean for the years under study for each company and then comparing the companies. Meanwhile, the time series analysis is a multiple regression of a time series for one company over a number of years.
The Panel Data method combines the two methods without using means; the term “cross section analysis of time series” is used (Gujarati, 2003; Hsiao, 2003; Baltagi, 2005) to refer to where there are several cases (section analysis) for a number of time periods (time series). This approach combines the advantages of each method as using the Data Panel method allows the use of the data without resorting to means. This reduces the disparitiesin the data which impacts positively on the results.
Results And Discussion
Model Test
The reliability and model capacity of the collinearity, normality and homoscedasticity is verified through regression assumption before using the regression model (Gujarati, 2003; Berenson et al., 2009).
Regression Assumption
Collinearity test
An important issue is the degree of individuality amongst each variable, i.e. multicollinearity, is the use of multiple regression analysis is the possibility of collinearity between independent variables (Berenson et al., 2009). Variance Inflation Factor (VIF) for each independent variable is one test of collinearity between independent variables, is estimated through the equation bellow:
VIF=1/(1-R2)
If the VIF factor for an “independent variable” is equivalent to 1, then collinearity has no important outcome on the connection between “the independent variable and the dependent variable” (Berenson et al., 2009).
A collinearity test was undertaken for the independent variables Equity, Total assets, Total liabilities, Working capital, Investment, Credit and Deposits. The STATA program was used to calculate the relationship among independent variables using the Pearson Matrix (Table 1). The resultant VIF value between the independent variables is shown Table 2.
| Table 1 Pearson Matrix |
||||||||
| Equity | Total Assets | Total Liabilities | Cash Flow | Working Capital | Investment | Credit | Deposit | |
| Equity | 1.0000 | |||||||
| Total Assets | 0.3327 | 1.0000 | ||||||
| Total Liabilities | 0.3767 | 0.3917 | 1.0000 | |||||
| Working Capital | 0.3069 | 0.3197 | 0.3687 | 1.0000 | ||||
| Cash Flow | 0.3254 | 0.2547 | 0.3954 | 0.2984 | 1.0000 | |||
| Investment | 0.3226 | 0.2021 | 0.2451 | 0.2696 | 0.3087 | 1.0000 | ||
| Credit | 0.3060 | 0.2884 | 0.2912 | 0.3150 | 0.2853 | 0.3982 | 1.0000 | |
| Deposit | 0.3626 | 0.2630 | 0.2950 | 0.2947 | 0.3585 | 0.2738 | 0.2565 | 1.0000 |
| Table 2 Variance Inflation Factor (VIF) |
||||
| R | R2 | 1-R2 | VIF=1/(1-R2) | |
| Equity, Total Assets | 0.3327 | 0.110689 | 0.889311 | 1.124466 |
| Equity, Total Liabilities | 0.3767 | 0.141903 | 0.858097 | 1.165369 |
| Equity, Cash Flow | 0.3069 | 0.094188 | 0.905812 | 1.103981 |
| Equity, Working Capital | 0.3254 | 0.105885 | 0.894115 | 1.118425 |
| Equity, Investment | 0.3226 | 0.104071 | 0.895929 | 1.116160 |
| Equity, Credit | 0.3060 | 0.093636 | 0.906364 | 1.103309 |
| Equity, Deposit | 0.3626 | 0.131479 | 0.868521 | 1.151382 |
| Total Assets, Total Liabilities | 0.3917 | 0.153429 | 0.846571 | 1.181236 |
| Total Assets, Cash Flow | 0.3197 | 0.102208 | 0.897792 | 1.113844 |
| Total Assets, Working capital | 0.2547 | 0.064872 | 0.935128 | 1.069372 |
| Total Assets, Investment | 0.2021 | 0.040844 | 0.959156 | 1.042584 |
| Total Assets, Credit | 0.2884 | 0.083175 | 0.916825 | 1.090720 |
| Total Assets, Deposit | 0.2630 | 0.069169 | 0.930831 | 1.074309 |
| Total Liabilities, Cash Flow | 0.3687 | 0.135940 | 0.864060 | 1.157327 |
| Total Liabilities, Working Capital | 0.3954 | 0.156341 | 0.843659 | 1.185313 |
| Total Liabilities, Investment | 0.2451 | 0.060074 | 0.939926 | 1.063914 |
| Total Liabilities, Credit | 0.2912 | 0.084797 | 0.915203 | 1.092654 |
| Total Liabilities, Deposit | 0.2950 | 0.087025 | 0.912975 | 1.095320 |
| Cash Flow, Working Capital | 0.2984 | 0.089043 | 0.910957 | 1.097746 |
| Cash Flow, Investment | 0.2696 | 0.072684 | 0.927316 | 1.078381 |
| Cash Flow, Credit | 0.3150 | 0.099225 | 0.900775 | 1.110155 |
| Cash Flow, Deposit | 0.2947 | 0.086848 | 0.913152 | 1.095108 |
| Working capital, Investment | 0.3087 | 0.095296 | 0.904704 | 1.105334 |
| Working capital, Credit | 0.2853 | 0.081396 | 0.918604 | 1.088608 |
| Working capital, Deposit | 0.3585 | 0.128522 | 0.871478 | 1.147476 |
| Investment, Credit | 0.3982 | 0.158563 | 0.841437 | 1.188443 |
| Investment, Deposit | 0.2738 | 0.074966 | 0.925034 | 1.081042 |
| Credit, Deposit | 0.2565 | 0.065792 | 0.934208 | 1.070426 |
The results indicate that all the VIF values among the “independent variables” are extremely adjacent to 1. Thus, there is no “collinearity” concerning the “independent variables” that have an important outcome on the association of the “independent variables and the dependent variable”, to a 95% confidence level (Berenson et al., 2009).
Test of Normality
The second key supposition of regression models “is that the variables should follow a normal distribution pattern; the more the data follows the normal distribution, the more accurate the results are considered to be” (Berenson et al., 2009). In this context, the researcher calculated skewness and kurtosis to “test whether or not the independent variables and the dependent variable follow a normal distribution” (Berenson et al., 2009) (Table 3). Skewness measures any loss of regularity in the data and in what way it closely trails a regular supply. Therefore, when skewness is zero the data has a normal distribution. However, if it is positive, then the data deviates to the right, whereas a negative value indicates a deviance to the left. Kurtosis refers to the concentration of data in the middle of the distribution. If kurtosis is “zero the data is a bellshaped distribution, but if the value is negative then the data is flatter than a bell-shaped distribution, while if the value is positive, then it is sharper than a bell-shaped distribution” (Berenson et al., 2009).
| Table 3 Normal Distribution |
||||||||
| Equity | Total Assets | Total Liabilities | Cash Flow | Working Capital | Investment | Credit | Deposit | |
| Skewness | -0.0285 | -0.0247 | 0.1548 | -0.0954 | -0.0315 | -0.0154 | 0.0326 | -0.0984 |
| Kurtosis | 3.25487 | 3.5487 | 2.5478 | 4.0159 | 3.6375 | 3.5478 | 4.2158 | 3.9021 |
The rate of skewness and kurtosis is totalled for all variables for a 10-year period. The outcome in Table 3 shows a closer data to considerably standard circulation. Thus the outcome of the reversion model can be used.
Homoscedasticity Test
The next test undertaken was for homoscedasticity, which tests that the variance of the error terms is constant for each observation (Berenson et al., 2009). The Breusch-Pagan/Cook- Wesberg is used to test hetroscedasticity in this study (Berenson et al., 2009). The results were a chi-square of 2.76 and a prob>chi-square of 0.0760, which means the data, does not suffer from hetroscedasticity.
Model Ability
The capacity of the “independent variables” to explain the “dependent variable” is verified by the value of R2, which is 74.46% in this study. That is the “independent variables” show 74.46% of the “dependent variable,” the banks’ profitability. To establish, the statistical significance of the result, we try to conduct an F test by equating the calculated value of F with its critical value. The decision rule in this case is: if the calculated value of F is greater than its critical value, then the value of R2 has a statistical significance and that the model result can be used (Berenson, Levine et al., 2009). In terms of the research, the critical F value is 2.168 while the F Value is 76.44. This means there is a statistically significant relationship between independent variables and the dependent variable as a whole and therefore the model results can be applied.
Analysing the Regression Model
To interpret the impact of independent study variables on the dependent variable depends primarily on comparing the calculated t value with indexed value, and measuring the value of P>t at the 5% significance level. To determine the existence of a relationship between an independent variable (Equity, Assets, Liabilities, Cash flow, and Working capital, Investment, Credit and Deposits) and the dependent variable (EPS), the value of the calculated t was compared with the index t. If the calculated t is greater than the index t then it can be concluded that there is a relationship between the independent variable and the dependent variable. Moreover, if the value of P>t is less than the 5% significance level, when it has been tested by the fixed-effect regression using the STATA program, this means there is a relationship between the independent variable and the dependent variable, and vice versa (Berenson, Levine et al., 2009) . Table 4 displays the results of the analysis of the independent variables and the dependent variable at 5% level of significance (95% confidence level).
| Table 4 The Results Of The Relationship |
|||
| Dependent Variable – EPS Independent Variables |
Coefficient | t | P>t |
| Equity | 0.0678692 | 2.95 | 0.002 |
| Total Asses | -0.0026887 | -0.37 | 0.714 |
| Total Liabilities | -0.0024991 | -0.92 | 0.360 |
| Working Capital | -0.0084245 | -1.11 | 0.271 |
| Cash Flow | 0.0003338 | 0.03 | 0.974 |
| Investment | 0.0015671 | 0.34 | 0.736 |
| Credit | 0.0571578 | 2.68 | 0.032 |
| Deposit | 0.0543198 | 2.37 | 0.030 |
| _cons | -0.0086562 | -0.02 | 0.982 |
| R2 | 74.48% | ||
| F | 55.94 | ||
From the results, the multiple regression equation obtained is:
Pit=A1+0.0768760(Eit)-0.0007886(Sit)-0.0024991(Lit)-0.0084245(Lqit)+0.0003338(CFit) +0.0015671(Iit) + 0.0543198 (Crit)+0.0543198 (Dit)
The results indicate that there is a statistically significant positive relationship between equity, deposits and credit from/to customers with profitability in Qatari banks. However, there is no significant statistical relationship between size, liabilities, liquidity, cash flow and investment with profitability in Qatari banks.
The above results consist of Berger, 1995; Frederick, 2014; and Lall, 2014 regarding the positive effect of size. Besides that, the results also consist with Naceur, 2001; Chirwa, 2003; Havrylchyket al., 2011; Al Saedi, 2015; Kristianti and Yovin, 2016 with regard to credit and deposit. The author think that these results lead to the conclusion that higher capital in Qatari banks will result in attracting higher levels of deposits which, in turn, allows the banks to increase the volume of credit. The interest differential between deposits and credit reflects positively on the profitability of the banks.
Conclusions
This research is an attempt to investigate if there is any influential impact from internal factors such as (equity, Size, Liabilities, Liquidity, cash flow, investment, deposit and credit) on the profitability of Qatar Bank, which is listed at Qatar Stock exchange by adopting Panel Data and fixed - effect regression model for last ten years (from 2008 to 2017) . We have excluded the external factors from this study such us influence and growth rate, because it is outside the control of the Bank’s management. The study finds a positive statistically significant relationship exists between equity, deposits and credit to customers with Qatar banks’ profitability, while this relation was not clear, (if not found), between other factors (such as: Size, Liabilities, Liquidity, cash flow and investment) and profitability.
The outcome result shows that the banks in Qatar scored an increase in their equity by transfer important part of their yearly earning as a share dividend which is reflect in increasing their equity (size), which will lead to gives customers more confidence in these banks to deal with them, which makes the process of polarization of bank deposits from the customers easier. On the other hand, such a situation is considered to be imperative for Qatari bank’s expansion in credit to customers, in other words, the capacity to provide more loans increases within the banks, which reflects positively on their profitability due to the difference between interest rate for depositing funds and lending funds. This result encourages banks listed at the Qatari Stock Exchange market to attract higher equity to increase the margin of its profitability and as a result the process of obtaining funds to increase shareholder’s ownership is made easier which reflects positively on the bank’s profitability, as recognized by the shareholders whom in turn will have an increase in their own profitability.
The result is limited by the small sample size in comparison with other studies. This is due to lack of depth and breadth in the Qatar Stock Market because of the small size of the market. However, this study showed that the internal factors effecting bank profitability’s one of the most important subject to study. This has uniquely positioned researchers to adopt other factors to measure its effect in future studies, or to choose a sample from other economic sectors or a larger sample of industrial companies and a longer period of time if data are available.
References
- Al Saedi, A.A. (2015). Banks profitability and variables’ effect on it: An empirical study on Iraqi-listed banks at Iraq stock exchange. Arab Journal of Administration, 35(1), 359-373.
- Baltagi, H.B. (2005). Econometrics analysis of panel data, (Third Edition). John Wiley & Sons.
- Berenson, M.L., Levine, D.M., & Krehbiel, T.C. (2009). Basic business statistics: concepts and applications, (Eleventh Edition). N.J., Pearson Prentice Hall.
- Berger, A.N. (1995). The relationship between capital and earnings in banks. Journal of Money, Credit and Banking, 27(2), 432-456 .
- Chirwa, E.W. (2003). Determinants of commercial banks' profitability in Malawi: A co-integration approach. Applied Financial Economics, 13, 565-571 .
- Demirguc-Kunt, & Levine, A.R. (1998). Opening to foreign banks: Issues of stability, efficiency and growth. Central Bank of Korea Conference on the Implications of Globalization of the World Financial Market. Seoul, Korea, Central Bank of Korea .
- Duraj, B., & Moci, E. (2015). Factors influencing the bank profitability: Empirical evidence from Albania. Romanian Economic and Business Review, 10(1), 60-72.
- Erin, O., Asiriuwa, O., Olojede, P., Ajetunmobi, O., & Usman T. (2018). Dose risk governance impact bank performance? evidence from the nigerian banking sector. Academy of Accounting and Financial Studies Journal, 22(4).
- Frederick, N. (2014). Factors affecting performance of commercial bank in Uganda. Proceedings of 25th International Business Research Conference 13-14 January, 2014, Taj Hotel, Cape Town, South Africa.
- Gitman, L.J. (1997). Principles of managerial finance, (Seventh Edition). Massachusetts, Addison Wesley.
- Gujarati, D. (2003). Basic econometrics, (Fourth Edition). New York, McGraw-Hill .
- Gul, S., Faiza, I., & Khalid, Z. (2011). Factors affecting bank profitability in Pakistan. The Romanian Economic Journal, 39, 61-87.
- Guven, S., & Onur, Y. (2009). Determinants of profitability in Turkish banking sectors: 2002-2007. International Research Journal of Finance and Economics, 28, 207-214 .
- Havrylchyk, O., & Jurzyk, E.M. (2 011 ). Profitability of foreign banks in Central and Eastern Europe: Does the entry mode matter. Economics of Transition, 19(3), 443-472.
- Hsiao, C. (2003). Analysis of panel data, (Second Edition). Cambridge, Cambridge University Press .
- Jeter, D.C., & Chaney, P.K. (2012). Advance accounting, (Sixth Edition). New Jersey, John Wiley & Sons Ins .
- Kristianti, R., & Yovin. (2016). Factors affecting banking performance: Case of top 10 biggest government and privet banks in indonesia in 2004-2013. Review of Integrative Business and Economics Research, 5(4), 371-378
- Lall, P. (2014). Factors affecting US banking performance: Evidence from the 2007-2013 financial crises. International Journal of Economics, Finance and Management, 3(6) 282-295.
- Lumby, S., & Jones, C. (2011). Corporate finance theory and practice, (Eight Edition). London, South-Western .
- Miller, S.M., & Noulas, A.G. (1997). Portfolio mix and large-bank profitability in the USA. Applied Economics. 29(4), 505-512 .
- Molyneux, P., & Thorton, J. (1992). Determinants of European bank profitability: A note. Journal of Banking and Finance, 16, 1173-1178 .
- Naceur, S.B. (2001). The determinants of the Tunisian banking industry profitability: Panel evidence. University Libre de Tunis Working papers .
- Nouaili, M., Abaoub, E., & Ochi, A. (2015). The determinants of banking performance in front of financial changes: Case of Trade Banks in Tunisia. International Journal of Economics and Financial, 5(2), 410-417.
- Salman, A., Nawaz, H., Bukhari, S., & Baker, A (2018). Growth analysis of Islamic banking in Pakistan: A qualitative approach. Academy of Accounting and Financial Studies Journal, 22(SI), 173-178.
- Shah, M.H. (2016).The effect of macroeconomic stability on inward FDI in African developing countries. International Journal of Business Studies Review, 1(1), 1-11.
- Shah, M., & Khan, S. (2017). Factors affecting commercial banks profitability in Pakistan. Journal of Business and Tourism, 3(1), 1-12.
- Vernimmen, P., Quiry, P., Dallochio, M., & Salvi, A. (2011). Corporate finance: Theory and practice. John Wiley & Sons, Ltd.
- Zogjani, J., Kelmendi, M., Humolli, B., & Raci, S. (2016). The impact of banking performance in banking sector- Evidence for Kosovo. Mediterranean Journal of Social Sciences, 7(6), 355-362.