Research Article: 2019 Vol: 22 Issue: 3
The Effect of Organizational Relationship and Competitive Strategy on the Performance of Wholesale Network Service Business in Indonesia
Moh. Riza Sutjipto, Universitas Padjadjaran
Ernie Tisnawati Sule, Universitas Padjadjaran
Sucherly, Universitas Padjadjaran
Umi Kaltum, Universitas Padjadjaran
Abstract
This study aims to examine the influence of organizational relationship and competitive strategy on the performance of wholesale network services business in Indonesia partially and simultaneously. The research used is quantitative method. Observation using time horizon (time horizon) is cross section / one shot, meaning information or data obtained is the results of research conducted at one particular time in 2017. Unit analysis in this study is Wholesale Network service company in Indonesia, so the observations unitis the management of the Wholesale Network service company. Based on the result of documentation study, it is known that Wholesale Network service company in Indonesia amounts to ± 29 companies, so that this research will be conducted by census to examine all members of the population. Causality analysis is used to analyze the causality relationship between research variables in accordance with the hypothesis that is compiled. This analysis uses Partial Least Square (PLS). The results showed that Organizational Relationship and Competitive Strategy significantly influenced Business Performance, where Organizational Relationship has greater influence than competitive strategy. The results of this study are expected to give implications to the management of wholesale network services company in Indonesia in an effort to improve business performance through organizational relationship development and competitive strategy.
Keywords
Organizational Relationship, Competitive Strategy, Business Performance.
Introduction
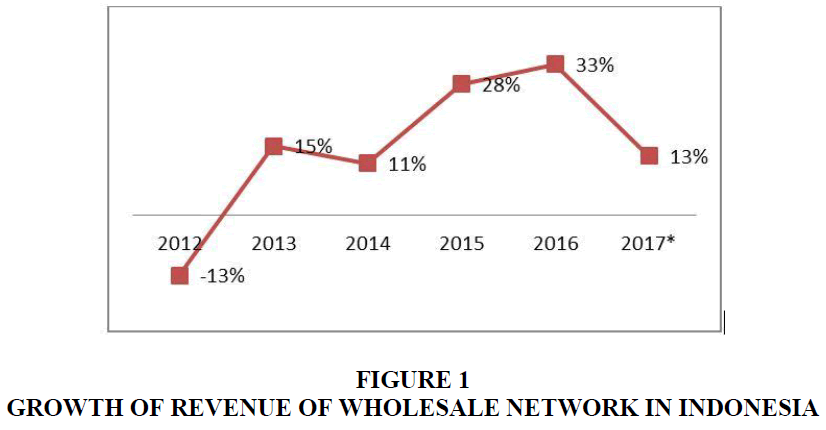
The high potential of Fixed broadband and Mobile broadband in Indonesia has not been able to improve the performance of the Wholesale industry. This can be seen from the sales growth rate of the following wholesale network industry (Table 1 and Figure 1):
| Table 1 Growth of Revenue of Wholesale Network in Indonesia | |||||||
| Year | 2011 | 2012 | 2013 | 2014 | 2015 | 2016 | 2017E |
| Revenue (Billion Rp) | 7.094 | 6.164 | 7.081 | 7.87 | 10.104 | 13.412 | 15.121 |
| Growth | -13.10% | 14.87% | 11.14% | 28.39% | 32.74% | 12.74% | |
From the tables and figures above, although the CAGR of growth 2011-2017 is positive at 14.46%, it is clear that income growth is unstable, from minus growth to positive for two digits. This unstable growth trend is an indication of the problem because although growth is expected from a business but unstable conditions with significant quantities indicate the achievement/realization of work programs that are not in accordance with the expected targets or ideal conditions. In addition, the position that wholesale network is a supporter of retail network where the performance of Fixed BB and Mobile Broadband penetration (marked by smartphone penetration) is still not encouraging because of the position of Indonesia in lower and lower middle position in ASEAN.
Although it cannot be directly compared, for regional or international level it is seen that the tendency of wholesale total income growth rate is relatively stable with growth rate which only 1 (one) digit is very different picture with condition in Indonesian wholesale industry. Regional and international data are in accordance with Table 2.
| Table 2 Projection of Total Revenue of Wholesale | |||||||
| Region | 2016 | 2017 | 2018 | 2019 | 2020 | 2021 | CAGR |
| Asia & Octanii | 9.666 | 10.723 | 11.926 | 13.245 | 14.668 | 16.253 | 11.00% |
| Americas | 19.567 | 21.14 | 22.896 | 24.669 | 26.706 | 29.05 | 8.20% |
| North America | 17.185 | 18.438 | 19.893 | 21.224 | 22.827 | 24.689 | 7.50% |
| Latin America and the Caribbean | 2.382 | 2.703 | 3.057 | 3.445 | 3.88 | 4.361 | 12.90% |
| Europe | 10.418 | 10.851 | 11.391 | 11.994 | 12.687 | 13.448 | 5.30% |
| Middle east & Africa | 4.843 | 5.136 | 5.461 | 5.827 | 6.26 | 6.739 | 6.80% |
| World | 44.493 | 47.851 | 51.674 | 55.734 | 60.321 | 65.529 | 8.10% |
| Indonesia | 133 | 157 | 187 | 222 | 261 | 303 | 17.90% |
| Singapore | 628 | 659 | 699 | 736 | 772 | 808 | 502% |
| India | 425 | 534 | 661 | 822 | 1010 | 1228 | 23.60% |
| Hong Kong | 549 | 573 | 607 | 642 | 679 | 716 | 5.50% |
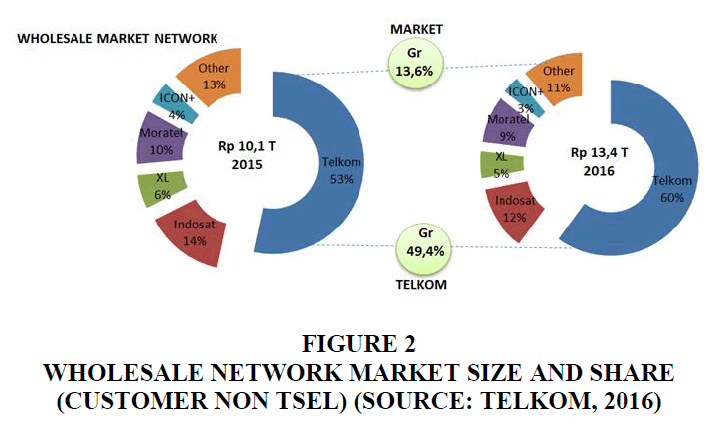
Figure 2 below shows that at a glance the wholesale network market share has significant growth, but the condition is due to Telkomsel's market share which is quite dominant in the wholesale network market in this case as part of "Telkom Group". So if we observe the market share wholesale network without taking into account Telkomsel can be described as follows:
From the figure above we can see that apparently by not taking into account Telkomsel, the growth of wholesale market in 2015-2016 only grew 13.6%. This condition is not optimal in the wholesale network business considering the potential demand from retail business FBB and MBB that is quite promising.
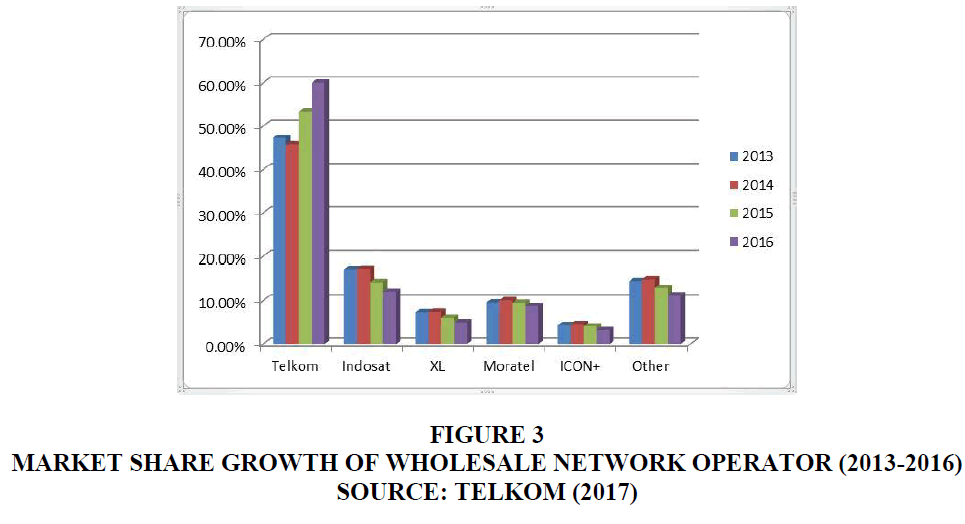
In addition, the following table shows the market share data of the wholesale network business per operator which in this case focus on the "big 5" operators (Telkom, Indosat, XL, Moratel and Icon Plus) from 2013 to 2016:
From the above table (Table 3) it is totally seen the market share growth of wholesale network, but basically it is dominated by Telkom, while for other operators do not show the growth of business optimally and tend to go down, as seen below (Figure 3).
| Table 3 Market Share of Wholesale Network Operator | ||||||
| Year | Telkom | Indosat | XL | Moratel | ICON+ | Other |
| 2013 | 0.4729 | 0.171 | 0.0733 | 0.0955 | 0.0431 | 0.1442 |
| 2014 | 0.4584 | 0.1728 | 0.0739 | 0.101 | 0.0455 | 0.1484 |
| 2015 | 0.5334 | 0.1422 | 0.06 | 0.0952 | 0.0403 | 0.1289 |
| 2016 | 0.6005 | 0.1196 | 0.0493 | 0.087 | 0.0319 | 0.1117 |
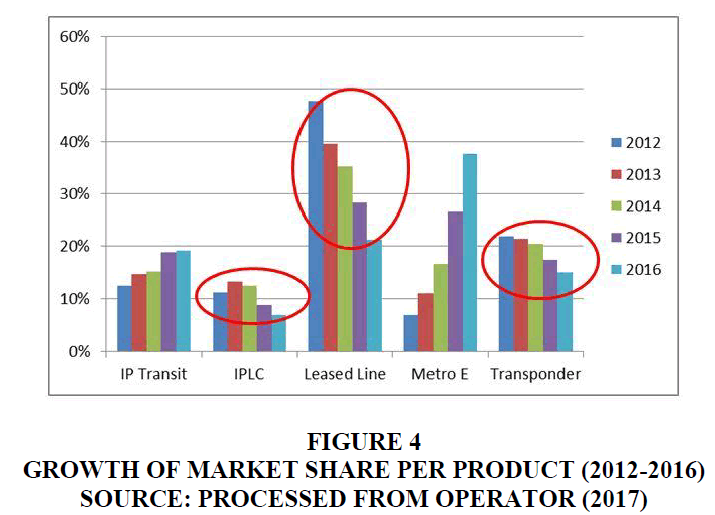
Data of market share/size per product (IP Transit, IPLC, Leased Line, Metro-E and transponder), from 2012 to 2016 can be seen as follows:
Market share/size per product from wholesale network grows totally, but if we observe the growth of product there are some condition of "unsustainable growth" of wholesale network product as shown in table (Table 4) above and figure (Figure 4) below:
| Table 4 Market Share Per Product | |||||
| Product | Year | ||||
| 2012 | 2013 | 2014 | 2015 | 2016 | |
| IP Transit | 12% | 15% | 15% | 19% | 19% |
| IPLC | 11% | 13% | 13% | 9% | 7% |
| Leased Line | 48% | 40% | 35% | 28% | 21% |
| Metro E | 7% | 11% | 17% | 27% | 38% |
| Transponder | 22% | 21% | 20% | 17% | 15% |
| Total | 100% | 100% | 100% | 100% | 100% |
By looking at the background of the wholesale network business conditions from some initial data can be submitted as follows:
Based on Data at 2015 and 2016;
Market share growth of wholesale network 49.4% (including Telkomsel's market share).
Market share growth of wholesale network 13.6% (without Telkomsel's market share).
Based on market share per operator data (2012-2016).
Telkom is growing significantly.
Indosat, XL, Moratel, Icon Plus and other operators grow insignificant (relatively stagnant).
Based on market share data per product (2012-2016):
The product of IP Transit, Metro-E and transponder services grows
IPLC and Leased Line service products tend not to be sustainable growth.
Based on IP Transit revenue performance Semester 1 2015 & Semester 1 2016:
Market share (Including Telkomsel) Some operators including NTT, Nafinfo, First Media grew, while XL and Moratel decreased.
Whereas if Telkomsel's market share is not taken into account the decrease of XL-5%, Telkom-7% and Moratel down-15%.
Another Wholesale Network business phenomenon is to bundle several products of wholesale network services, such as; IP Transit, IP Leased Channel IPLC, Leased Line, Metro-Ethernet and transponder. So among these products there is a decrease in growth, which may be suspected due to decreased demand or the existence of cross subsidized products services that are charged to other products.
The above conditions indicate that the performance of the Wholesale Network products business in Indonesia is not yet optimal. Where the growth is not in line with expectations because of unstable business performance. This is allegedly because the company has not implemented the right competitive strategy. Generic strategy Michael Porter proposed by Robinson & Richard (2015) as the core idea of how a company can compete in the best way in its market, where long-term strategy begins with the company's efforts to achieve competitive advantage based on three generic strategies: striving for overall low-cost leadership in the industry, striving to create and market unique products for varied customer groups through differentiation, and striving to have special appeal to one or more groups of consumer or individual buyers, focuses on their cost or differentiation concerns.
From the interviews with telecommunication operators in Indonesia revealed that the competitive strategy applied by companies in facing the current competition is cost leadership and product differentiation. However, this strategy is considered not implemented properly due to the high operational costs of operators. The biggest cost component comes from the high value of investment needed to build backbone network in Indonesia. This resulted in the unaffordable costs of the community, especially in certain areas eg in Eastern Indonesia. in meeting the needs of the internet. In addition, the product differentiation strategy applied by the company can not serve wholesale customers who want minimal service as it will be combined with other service provider so SLG will increase.
The condition, also suspected because of the weakness in the organizational relationship aspect. Where conceptually, proposed by Cravens & Percy (2013), that partnership is an effort to cooperate with stakeholders covering vertical relationship consisting of relationship with supplier and customer (customer) and also horizontal consist of lateral and internal partnership. However, on the basis of initial observations, the company currently engaged in the wholesale network services industry in Indonesia, apparently has not implemented a close relationship with various related lateral parties, such as with educational institutions and research institutions. In addition, it seems that they also have not implemented a close relationship with suppliers and customers.
Statement of Problems
1. Is there any influence organizational relationship on performance of wholesale network services business in Indonesia?
2. Is there any influence competitive strategy on performance of wholesale network services business in Indonesia?
3. Is there any influence organizational relationship and competitive strategy on performance of wholesale network services business in Indonesia?
Aims of the Study
1. The influence organizational relationship on performance of wholesale network services business in Indonesia?
2. The influence competitive strategy on the performance of wholesale network services business in Indonesia?
3. The influence organizational relationship and competitive strategy on the performance of wholesale network services business in Indonesia?
Literature Review
Organizational Relationship
Cravens & Percy (2013) explains that partnership is an effort to cooperate with stakeholders covering vertical relationship consisting of relationship with supplier and customer (customer) and also horizontal consist of lateral and internal partnership. The concept of relation with other companies is also put forward by Wheelen et al. (2015), in which cooperative strategy is used by companies to achieve competitive advantage in industry by cooperating with other companies.
Song et al. (2012) stated that the focus of business partnerships is the creation of customer value by highlighting the Business relationship function that demonstrates the four functions of a customer-supplier partnership:
1. Cost-reduction function: in long-term buyer-supplier relationships, suppliers will make a consensus in price for long-term buyers. Therefore, business relationships have a cost reduction function for buyers.
2. Quality function: buyers are interested in the quality of products offered. The quality of the products supplied by the supplier will affect the quality of the buyer's end product. If the products supplied to buyers are perceived to be reliable and easy to use, this will benefit buyers by increasing production efficiency and reducing their inspection as well as production costs. So that it is expected that suppliers will provide high quality products to buyers for long-term partnership. In this case it can be said that the business relationship will meet the quality of function for the buyer.
3. Volume function: volume function refers to the volume of business generated by the buyer. The effective activity of the production system requires reliable source input adequate for a system. Thus, the buyer seeks the volume function of a supplier-buyer partnership because of the volume stability guarantee of the required product.
4. Safeguarding function: with the trend of globalization and technological transformation, in addition to the selection of suppliers that can provide benefits through price, quality, and volume (as mentioned above), buyers also need to establish relationships with other companies to secure their positions if the supplier of their choice fails provide his needs. This relationship with the backup supplier will provide assurance to the buyer regarding the supply of the product and reduce the risk of purchase. That is what is considered a security function. Security as a function of buyer-supplier relationships to provide guarantees against crises and provide more value to buyers.
Based on the comparison of organizational relationship concept and dimension, organizational relationship is measured by five dimensions: internal partnership, partnership with supplier, partnership with customer, partnership with lateral party, and strategic alliance.
Competitive Strategies
Wheelen et al. (2015) explains Porter's generic competitive strategy aimed at outperforming other companies in an industry, including: Cost leadership, Differentiation, and Focus. Another explanation of Michael Porter's Generic strategy is found in the Robinson & Richard (2015) literature as a core idea of how a company can compete in the best way in its marketplace, where long-term strategy begins with the company's efforts to achieve competitive advantage based on three generic strategies:
1. Striving for overall low-cost leadership in the industry.
2. Striving to create and market unique products for varied customer groups through differentiation.
3. Striving to have special appeal to one or more groups of consumer or individual buyers, focuses on their cost or differentiation concerns.
Pandey (2012) describes five competitive strategies:
1. Low-cost provider strategy-lower price creation than competitors in similar products that can attract a wider spectrum of customers.
2. Broad differentiation strategy-the creation of product differentiation over competing products with superior attributes that are able to attract a wider spectrum of customers.
3. Focused low-cost strategy-concentrate on a narrow segment of buyers (market or niche) and outperform competitors in terms of cost, so as to serve a niche at the lowest price.
4. Focused differentiation strategy-concentrates on a narrow segment of buyers (market or niche) and outperforms competitors where the product offered is able to meet the taste and certain requirements of the niche members than the products offered by its competitors.
5. Best-cost provider strategy-value creation of customers who exceed their money by satisfying customer expectations on key attributes for quality/features/performance/service than competitors.
6. Based on comparison of concept and dimension of competitive strategy, competing strategy in this research is measured by dimension of cost leadership strategy, product differentiation, and speed based strategy.
Based on the comparison of the concept and dimensions, the competitive strategy in this research is measured by the dimension of cost leadership strategy, product differentiation, and speed-based strategy.
Business Performance: David (2013) proposes several financial ratios to measure performance: Return on Investment (ROI), Return on Equity (ROE), Profit Margin, Market Share, Debt to Equity, Earnings per share, Sales growth, and Assets growth. Yoon (2016) uses measures of operational performance, growth performance, profitability performance, and performance competitiveness in measuring business performance. While Matanda & Ndubisi (2009) measure the business performance of marketing performance and financial performance. Adhikari & Gill (2011) measures performance by increased sales, ROA, and New product success. Lee et al. (2008) measures the business with business growth and profitability. While Jin & Edmunds (2015) measure company performance based on operational performance.
Based on the comparison of business performance dimensions, the business performance in this study is measured using three dimensions, namely sales volume, profitability, and market share.
Previous Research: Makau (2015) found that buyer-supplier relationships can increase competitive prices, reduce lead times, reduce non-supply risks, improve delivery reliability, improve inventory management, increase sales and increase customer satisfaction. While Qrunfleh & Tarafdar (2013) finds a relationship between supply chain responsiveness strategic partnership with company performance. Song et al. (2012) show that the business partnership function has a direct and indirect influence on buyer's performance through the mediation effect of relationship quality.
On the other hand, Andrevski (2009) found that each type of strategy positively affects the company's performance and that companies capable of simultaneously pursuing both cost advantage and enhancing excellence (i.e., the ability of firms to pursue strategic entrepreneurship) will show the best performance. Valipour et al. (2012) found that in firms with cost leadership strategies, there was a positive relationship between leverage; cost leadership strategies and dividend payouts with performance. In addition, Nandakumar et al. (2010) found that in low hostile environments, cost leadership strategies lead to better performance.
Whereas in high hostile environments, differentiation strategies lead to performance that is better than competitors. So based on these studies, it can be said that competing strategies affect business performance.
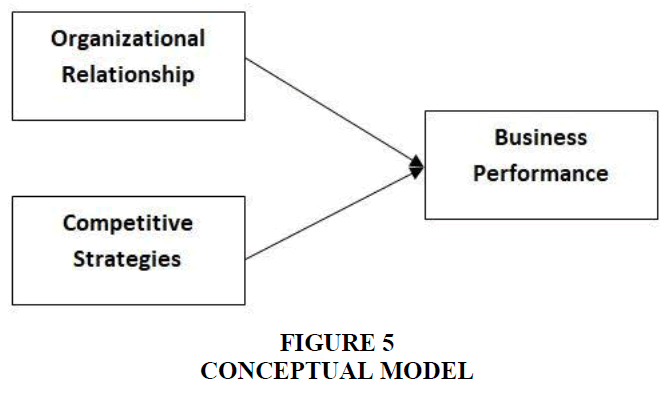
Based on the description, a conceptual model is prepared as follows (Figure 5):
Based on the conceptual model, then the hypothesis is arranged as follows:
H1: Organizational relationship affect performance of wholesale network services business in Indonesia.
H2: Competitive strategy affect performance of wholesale network services business in Indonesia.
H3: Organizational relationship and competitive strategy affect the performance of wholesale network services business in Indonesia.
Methodology
The research used is quantitative method. Observation using time horizon (time horizon) is cross section/one shot, meaning information or data obtained is the results of research conducted at one particular time in 2017. Unit analysis in this study is Wholesale Network service company in Indonesia, so the unit observations are the management of the Wholesale Network service company.
Researcher states that the population is a collection of objects that have the same characteristics that relate to research problems. Population is a combination of all elements that have a set of similar characteristics. Based on the result of documentation study, it is known that Wholesale Network service company in Indonesia amounts to ± 29 companies, so that this research will be conducted by census which is to examine all members of the population.
Causality analysis is used to analyze the causality relationship between research variables in accordance with the hypothesis that is compiled. This analysis uses Partial Least Square (PLS). The use of PLS refers to the objectives and paradigms and research models, namely testing the causal relationship model between the variables that are latent (unobservable variable) with relatively small sample size.
The PLS model is defined to consist of two linear equations called the structural model (Inner model) that describes the relationship between latent variables and measurement (Outer model) which shows the relationship between latent variables and a group of manifest variables that can be measured directly.
Results and Discussion
Goodness of Fit (Evaluation Model)
Inner Model: Analysis of the structural model (inner model) shows the relationship between the latent variables in the study. Inner models were evaluated using R Square and Prediction relevance (Q square) from Stone-Geisser's with a blindfolding procedure. Referring to Chin (1998), the R square values are 0.67 (strong), 0.33 (medium) and 0.19 (weak) and Prediction relevance (0.02) 0.02 (minor), 0.15 (medium) and 0.35 (big).
The table above (Table 5) gives the value of R2 on the involvement as the endogenous variable is in the criteria above medium (>0.33), and the Q square value is on the big criterion (>0.35), so it can be concluded that the research model is supported by empirical condition or fit model.
| Table 5 Test Of Outer and Inner Model | |||||
| AVE | Composite Reliability | Cronbachs Alpha | R Square | Q square | |
| Organizational Relationship | 0.656 | 0.966 | 0.962 | 0.653 | |
| Competitive Strategy | 0.7 | 0.955 | 0.946 | 0.689 | |
| Business Performance | 0.827 | 0.95 | 0.93 | 0.626 | 0.789 |
To check convergent validity, each latent variable’s Average Variance Extracted (AVE) is evaluated. From table 5, it is found that all of the AVE values are greater than the acceptable threshold of 0.5, so convergent validity is confirmed.
Outer Model: Analysis of the measurement model (outer model) is used to test the validity and reliability of the latent variable and the dimensions measured by the indicators. Measurement model is explained by Cronbachs Alpha to know the reliability of indicators in measuring the dimensions and latent variables. If the value of Cronbachs Alpha is greater than 0.70 (Nunnally & Bernstein, 1994), it shows that the reliable dimensions and indicators are in the buffer variable. Table 1 shows that Composite reliability and Cronbachs Alpha are variable> 0.70 so that the variables and dimensions in the model meet the discriminant validity criteria. And finally all variables have good reliability. The Table 6 show the result of measurement model for each dimensions on indicators.
| Table 6 Loading Factor of Latent Variable-Dimension-Indicator | |||
| Indicator-Dimension | l | SE | t-value |
| Organizational Relationship → Internal | 0.947 | 0.009 | 107.462 |
| Y11 ← Internal | 0.921 | 0.017 | 55.216 |
| Y12 ← Internal | 0.9 | 0.018 | 50.423 |
| Y13 ← Partnership Internal | 0.834 | 0.033 | 25.045 |
| Organizational Relationship → Supplier | 0.893 | 0.021 | 41.825 |
| Y21 ← Supplier | 0.906 | 0.018 | 49.375 |
| Y22 ← Supplier | 0.89 | 0.024 | 37.049 |
| Organizational Relationship → Customer | 0.92 | 0.017 | 52.883 |
| Y31 ← Customer | 0.926 | 0.017 | 53.963 |
| Y32 ← Customer | 0.908 | 0.021 | 43.645 |
| Y33 ← Customer | 0.93 | 0.018 | 52.928 |
| Organizational Relationship → Lateral | 0.931 | 0.014 | 67.954 |
| Y41 ← Lateral | 0.804 | 0.036 | 22.451 |
| Y42 ← Lateral | 0.826 | 0.032 | 25.434 |
| Y43 ← Lateral | 0.843 | 0.029 | 29.238 |
| Y44 ← Lateral | 0.837 | 0.033 | 25.122 |
| Organizational Relationship → Strategy Alliances | 0.888 | 0.021 | 42.204 |
| Y51 ← Strategy Alliances | 0.939 | 0.014 | 68.672 |
| Y52 ← Strategy Alliances | 0.908 | 0.021 | 42.558 |
| Y53 ← Strategy Alliances | 0.85 | 0.033 | 26.121 |
| Competitive strategy → Cost Leadership | 0.896 | 0.023 | 39.581 |
| Y61 ← Cost Leadership | 0.915 | 0.012 | 78.041 |
| Y62 ← Cost Leadership | 0.896 | 0.02 | 45.214 |
| Competitive strategy → DiferensiasiProduk | 0.963 | 0.009 | 112.089 |
| Y71 ← Product Differentiation | 0.846 | 0.03 | 27.832 |
| Y72 ← Product Differentiation | 0.836 | 0.029 | 28.762 |
| Y73 ← Product Differentiation | 0.937 | 0.012 | 76.217 |
| Competitive strategy → Speed | 0.979 | 0.004 | 224.066 |
| Y81 ← Speed | 0.853 | 0.024 | 35.904 |
| Y82 ← Speed | 0.823 | 0.035 | 23.657 |
| Y83 ← Speed | 0.884 | 0.02 | 43.781 |
| Y84 ← Speed | 0.897 | 0.021 | 43.485 |
| Business performance → Sales | 0.965 | 0.009 | 113.355 |
| Z11 ← Sales | 0.923 | 0.012 | 75.86 |
| Z12 ← Sales | 0.916 | 0.015 | 61.328 |
| Business performance → Profitability | 0.938 | 0.015 | 62.768 |
| Z21 ← Profitability | 1 | ||
| Business performance → Market Share | 0.925 | 0.016 | 59.064 |
| Z31 ← Market Share | 1 | ||
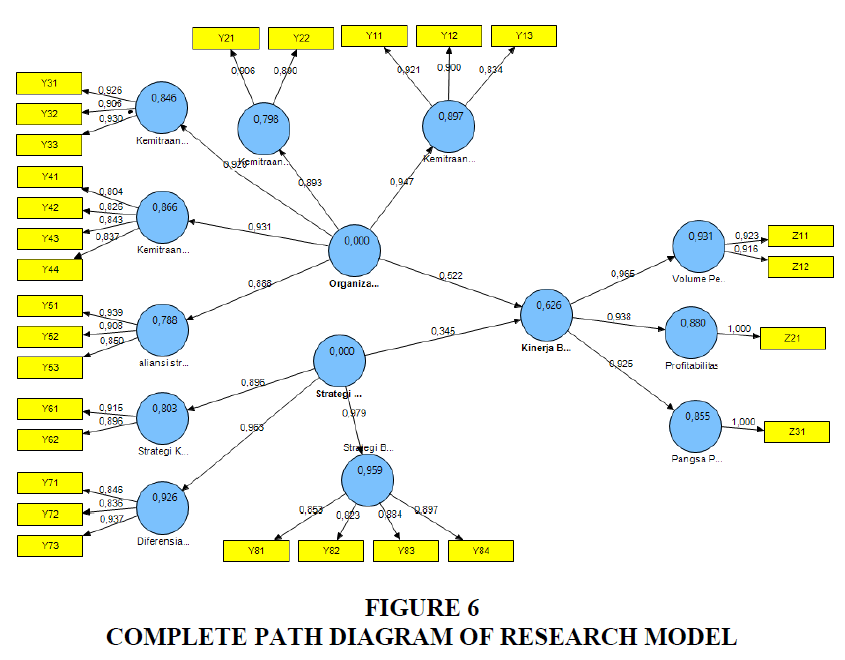
The result of measurement model of dimensions by its indicators show that the indicators are valid which the value of t<2.01 (t table at α=0.05). The result of measurement model of latent variables on their dimensions shows to what extent the validity of dimensions in measuring latent variables.
Following figure (Figure 6) show the complete path diagram:
Structural Model
Based on the research framework, then obtained a structural model as follow:

Where :
η1= Business Performance
ξ1 = Organizational Relationship
ξ2 = Competitive Strategy
ζi =Residual
Hypothesis Testing
Below is the result of simultaneous and partial testing of hypothesis.
Table 7 shows simultaneously that, Organizational Relationship and Competitive Strategy significantly to Business Performance (62.6%).
| Table 7 Simultaneous Testing of Hypothesis | |||
| Hypothesis | R2 | F value | Conclusion |
| Organizational Relationship and Competitive Strategy → Business Performance | 0.626 | 37.631* | Hypothesis accepted |
Below is the result of partial testing of hypothesis:
Table 8 shows that partially Organizational Relationship and Competitive Strategy have an effect on Business Performance, where Organizational Relationship has bigger influence that is 39% compared to competitive strategy (23.6%).
| Table 8 Partial Testing of Hypothesis | ||||||
| No | Hypothesis | g | SE(g) | t | R2 | Conclusion |
| 1 | Organizational Relationship → Business Performance | 0,522 | 0,104 | 5,028* | 0,390 | Hypothesis accepted |
| 2 | Competitive Strategy → Business Performance | 0,345 | 0,104 | 3,328* | 0,236 | Hypothesis accepted |
Research Finding
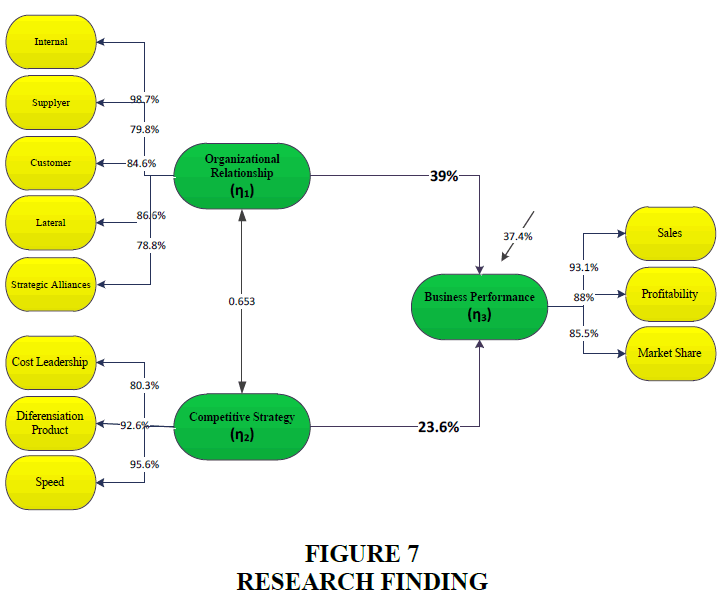
Based on hypothesis testing result, will describe the Research Model Finding:
The research findings (Figure 7) show that Organizational Relationship and Competitive Strategy significantly influence Business Performance, where Organizational Relationship has bigger influence that is 39% compared to competitive strategy (23.6%).
It illustrates that effort to improve the performance of wholesale network services business is based on the development of Organizational Relationship, especially in the internal partnership aspect. It is based on statistical test results where internal partnerships have the highest influence coefficients, followed by lateral partnerships, partnerships with customers, partnerships with suppliers, and strategic alliances.
In addition, the improvement of business performance is also supported by competitive strategy. The results of statistical tests show that speed-based strategies have the highest influence coefficients compared to product differentiation and cost leadership strategies. This illustrates that efforts to develop competitive strategies should prioritize the development of speed aspects.
The results of this study are expected to benefit the management of wholesale network services companies in an effort to improve business performance through organizational relationship development and competitive strategy.
In addition, these findings also show support for Andrevski's (2009) study found that each type of strategy positively affects firm performance and that companies capable of simultaneously pursuing both cost advantage and enhancing excellence (i.e., the ability of firms to pursue strategic entrepreneurship) will show the best performance. Valipour et al. (2012) found that in firms with cost leadership strategies, there was a positive relationship between leverage; cost leadership strategies and dividend payouts with performance. In addition, Nandakumar et al. (2010) found that in low hostile environments, cost leadership strategies lead to better performance. In high hostile environments, differentiation strategies lead to better performance than competitors.
The findings also show support for Makau (2015) research found that buyer-supplier relationships can increase competitive prices, reduce lead times, reduce non-supply risks, improve delivery reliability, improve inventory management, increase sales and improve customer satisfaction. While Qrunfleh and Tarafdar (2013) finds a relationship between strategic partnership (supply chain responsiveness) with company performance. Song et al. (2012) show that the business partnership function has a direct and indirect influence on buyer's performance through the mediation effect of relationship quality. Researcher found that the relationship between firm performance and the type of supplier-supplier relationship is moderated by environmental volatility and varies across different performance measures.
Conclusion and Suggestions
Conclusions
Organizational Relationship and Competitive Strategy significantly influences Business Performance, where Organizational Relationship has greater influence than competitive strategy. It illustrates that effort to improve the performance of wholesale network services business is based on the development of Organizational Relationship, especially in the internal partnership aspect. It is based on statistical test results where internal partnerships have the highest influence coefficients, followed by lateral partnerships, partnerships with customers, partnerships with suppliers, and strategic alliances. In addition, the improvement of business performance is also supported by competitive strategy. The results of statistical tests show that speed-based strategies have the highest influence coefficients compared to product differentiation and cost leadership strategies. This illustrates that efforts to develop competitive strategies should prioritize the development of speed aspects. The results of this study are expected to give implications to the management of wholesale network services company in Indonesia in an effort to improve business performance through organizational relationship development and competitive strategy.
Suggestions
Based on the results obtained in this study, the researchers gave the following suggestions:
1. Organizational relationship is more dominant than competitive strategy in improving the performance of wholesale network services business in Indonesia. So as to improve business performance, then the management of the company is advised to prioritize improvement or improvement in the following matters:
a. Internal Partnerships, in terms of internal corporate synergies, internal collaboration, and the development of partnership governance structures.
b. Lateral partnerships, in relation to banking, government, business associations, and educational institutions.
c. Partnership with Customers, in reliability aspect Customer service service, customer loyalty program, and customer gathering program.
d. Partnership with Suppliers, in the aspect of quality relationships with suppliers and the development of trust-based relationships with suppliers.
e. Strategic Alliance, in the aspect of cooperation with international companies on the upstream side (production equipment and technology) and cooperation with international companies on the downstream side (development of wholesale network related products).
2. Referring to the research findings that reveal that competitive strategy has a significant effect on the performance of wholesale network services business in Indonesia, the management needs to improve / improve the aspects below to win the competition:
a. Speed-Based Strategies, in the aspect of the company's speed in anticipating changes in customer behavior, as well as speed in product development, network development process, and in accommodating technology trends.
b. Product Differentiation Strategies, in terms of uniqueness and product variation compared to competitors, ease of service to customers versus competitors, and implementation of technology utilization.
c. Cost Leadership Strategy, through the implementation of more efficient operational costs and lower cost implementation than competitors.
References
- Adhikari, A., &amli; Gill, M.S. (2011). Imliact of resources, caliabilities and technology on market orientation of Indian B2B firms. Journal of Services Research, 11(2).
- Andrevski, G. (2009). Comlietitive strategy, alliance networks, and firm lierformance. University of Kentucky Doctoral Dissertations. 710.
- Chin, W.W. (1998). The liartial least squares aliliroach to structural equation modeling. Modern methods for business research, 295(2), 295-336.
- Cravens, D.W., &amli; liercy, N.F. (2013), Strategic marketing, Tenth Edition, McGraw Hill, Singaliore.
- David, F.R. (2013), Strategic management, concelits &amli; cases. liearson Education Limited, England.
- Jin, Y., &amli; Edmunds, li. (2015). Achieving a comlietitive sulilily chain network for a manufacturer: A resource-based aliliroach. Journal of Manufacturing Technology Management, 26(5), 744-762.
- Lee, S.M., Kim, K., liaulson, li., &amli; liark, H. (2008). Develoliing a socio-technical framework for business-IT alignment. Industrial Management &amli; Data Systems, 108(9), 1167-1181.
- Makau, li.M. (2015). Effects of buyer-sulililier relationshili on lirocurement lierformance of selected suliermarkets, KISII, Kenya. The International Journal of Business &amli; Management, 3(5), 338.
- Matanda, J.M., &amli; Ndubisi, O.N. (2009). Market orientation, sulililier lierceived value and business lierformance of SMEs in a Sub-Saharan African nation. Journal of Enterlirise Information Management, 22(4), 384-407.
- Nandakumar, M.K., Ghobadian, A., &amli; O'Regan, N. (2010). Business-level strategy and lierformance: The moderating effects of environment and structure. Management Decision, 48(6), 907-939.
- Nunnally, J.C., &amli; Bernstein, I.H. (1994). The assessment of reliability. lisychometric Theory, 3, 248-292.
- liandey, li. (2012). The relationshili between CRM dimensions and customer retention in Indian Banking industry: An emliirical study of liublic and lirivate sector bank. Journal of Commerce and Accounting Research, 1(4), 51.
- Qrunfleh, S., &amli; Tarafdar, M. (2013). Lean and agile sulilily chain strategies and sulilily chain reslionsiveness: the role of strategic sulililier liartnershili and liostlionement. Sulilily Chain Management: An International Journal, 18(6), 571-582.
- Robinson, R.B., &amli; Richard, B. (2012). Strategic management: lilanning for domestic &amli; global comlietition. New York: McGraw Hill.
- Song, Y., Su, Q., Liu, Q., &amli; Wang, T. (2012). Imliact of business relationshili functions on relationshili quality and buyer's lierformance. Journal of Business &amli; Industrial Marketing, 27(4), 286-298.
- Valiliour, H., Birjandi, H., &amli; Honarbakhsh, S. (2012). The effects of cost leadershili strategy and liroduct differentiation strategy on the lierformance of firms. Journal of Asian Business Strategy, 2(1), 14.
- Wheelen, T.L., Hunger, J.D., Hoffman, A.N., &amli; Bamford, C.E. (2015). Strategic management and business liolicy: Globalization, innovation, and sustainability. 14th Edition, Global Edition, liearson.
- Yoon, C.Y. (2016). A structural tool to efficiently analyze enterlirise smart business lierformance in a smart management environment. International information institute (Tokyo). Information, 19(2), 353.
