Research Article: 2021 Vol: 25 Issue: 1
The Effect of Specific Risk Disclosure under IFRS 7 on Cost of Capital
Phunphit Thitinun, Thammasat University
Nontawan Yomchinda, Thammasat University
Abstract
This study investigates the effect of specific risk disclosure under IFRS 7 on a firm’s cost of capital in the principal of stock exchange of 62 countries that adopted IFRS between 2005 and 2014. The dictionary method was followed for the textual analysis of firms’ annual report footnotes using Python. A sample of 225 nonfinancial listed firms was generated by the intersection of firms with available annual reports and their representation in the DATASTREAM, I/B/E/S and WORLDSCOPE databases. Overall, the results of the random effects Tobit regression suggest that an incremental specific risk disclosure under IFRS 7 increased a firm’s cost of capital, supporting the hypothesis of this study. Moreover, the results also demonstrate that the cost of capital effect persisted after adding the market-based uncertainty proxy, bid-ask spread and return volatility, indicating that the improvement of a firm’s specific risk disclosure under IFRS 7 is associated with the perception of market sentiment as reflected by investors’ uncertainty proxy, and results in an increase in the firm’s cost of capital. These findings complement the literature on the linkage between a firm’s cost of capital and specific risk disclosure in accordance with the IFRS 7.
Keywords
Risk Disclosure, Credit Risk, Liquidity Risk, Cost of Capital, IFRS 7.
Introduction
Risk disclosure provides investors with supportive information to evaluate a firm’s risk when assessing its investment decision making. Specifically, risk disclosure is normally perceived as negative information; therefore, investors’ perceived sense of a firm’s risks, as reflected in poor investment decision making or inaccurate forecasting for investment returns, leads to investment uncertainty. This consequently results in a higher cost of capital for a firm.
The International Financial Reporting Standards (IFRS) requires firm disclosure about risks arising from financial instruments’ assets and liabilities to enable financial statements users to evaluate the significance of financial instruments in the firm’s financial position and performance. Credit risk and liquidity risk disclosure are viewed as the most important risks and appear to increase users’ risk perception (Bao & Datta, 2014; Papa, 2016). Credit risk is the risk that an entity may face financial loss caused by a counterparty’s failure to discharge an obligation, whereas liquidity risk is the risk that an entity may fail to fulfil a contractual obligation (IASB, 2005).
This idiosyncratic risk disclosure requirement also implies that firms must provide a negative signal or unfavorable disclosure tone for their financial instruments in their financial reports. A previous study on the association between a negative disclosure tone and a firm’s cost of capital found inconclusive results; hence, we seek to re-examine this association in this study. This led to the research question of whether credit risk disclosure and liquidity risk disclosure affect a firm’s cost of capital. This study is distinct from previous studies on the association between risk disclosure and capital market consequences in that it investigated the relationship between specific risk disclosures (i.e., credit risk and liquidity risk) and the capital market, whereas most prior studies focused on general risk disclosure.
Kothari et al. (2009), Johnstone (2016) and Dutta & Nezlobin (2017) suggested that a higher level of risk exposure represents an unfavorable tone, making investors feel more uncertain about a firm’s future cash flows and resulting in an increased cost of capital. This study, therefore, predicts that a firm with a higher level of specific risk disclosures credit risk and liquidity risk disclosures will have a higher cost of capital. The cost of capital in this study is defined as the expected returns demanded by the informed investors, which implies that investors obtain symmetric information between upside potential and downside risks. Moreover, the expected returns are estimated directly from current stock prices and future cash flows, which is reasonable for investors’ decision making. This approach can solve the problem of expected returns deviation over prolonged periods of time by using a noisy proxy, for example, realized returns and analysts’ forecasts.
A random effects Tobit regression of a sample of 225 nonfinancial listed firms shows a positive and significant relationship between specific risk disclosures and a firm’s cost of capital. This indicates that an increase in a specific risk disclosure under IFRS 7 adoption increases a firm’s cost of capital, supporting the hypothesis of this study. Moreover, the significantly positive association between specific risk disclosures and a firm’s cost of capital still appears even after adding market-based uncertainty proxies (i.e., bid-ask spread [SPREAD] and return volatility [STDRET].
This indicates that a higher specific risk disclosure improves the precision of risk disclosure and affects investor uncertainty, resulting in a higher cost of capital to compensate for the investors’ perceived risk. For example, once investors are provided with the specific risk disclosure, they can no longer ensure that they can trade the stock at a certain price in the future or that they will get an expected stock return. These findings broaden those of Campbell et al. (2014), Johnstone (2016) and Dutta & Nezlobin (2017), who found that higher precision of unfavorable information increases user uncertainty about a firm’s value, leading to an increased cost of capital. However, the result is contrary to Heinle & Smith’s (2017) finding that market did not price idiosyncratic risk disclosures. This might be due to the difference in idiosyncratic risk definition. In Heinle & Smith’s (2017) study, idiosyncratic risk is defined as individual risk, or diversifiable risk, whereas this study defines idiosyncratic risk as specific risk, that is, credit risk and liquidity risk under IFRS 7, which imply poor commitment of firms with their counterparties. This study contributes to the academic literature by presenting the linkage between a firm’s cost of capital and specific risk disclosure in accordance with the IFRS 7 requirements.
The remainder of this article is organized as follows. The next section presents a review of the literature and hypothesis development. After that, the research design used to conduct this study is described. This is followed by a presentation of the empirical results of the study. The final section concludes the paper.
Review of Literature
The widely held theoretical literature suggests that incremental disclosure reduces a firm’s cost of capital due to decreased information asymmetry, which thus improves investors’ confidence in their predictions of a firm’s future cash flows (Barry & Brown, 1985; Campbell et al., 2014; Easley & O’Hara, 2004; Lambert et al., 2007). However, the existing empirical results about the correlation between greater disclosure levels and a lower cost of capital have been criticized as misleading and inconclusive (Dutta & Nezlobin, 2017; Heinle & Smith, 2017; Johnstone, 2016; Kothari et al., 2009). Positive incremental disclosures can increase investors’ perceived certainty about a firm’s future cash flow, which results in a reduced cost of capital, while the opposite is true in cases of negative disclosure (i.e., the firm’s cost of capital will increase).
Risk disclosure is the accounting information provided for creditors to assess firm risk and for investors to make their investment decisions. In practice, creditors and investors make decisions based on their own perceptions of firm risk, which are provided by entities in both qualitative and quantitative disclosures. Qualitative disclosure refers to the narrative description that does not show numbers but provides information using relative terms, whereas quantitative disclosure use number to expose information.
The International Financial Reporting Standards No.7, Financial Instrument: Disclosures (IFRS 7) aims to improve disclosure quality of financial instruments and to reduce investor uncertainty about the effects of a change in risk variables on firms’ expected cash flows. This mandatory standard requires entities to disclose both qualitative and quantitative information; however, this study focuses only on qualitative information, which enables users to evaluate the nature and the extent of risks arising from such financial instruments to which the entity is exposed at the reporting date (IASB, 2005). There are three categories of risk disclosure in the standard: credit risk, liquidity risk and market risk. Credit risk, or counterparty credit risk, is defined as the risk of loss arising from some credit event by the counterparty that may be unable to make a payment or fulfil contractual obligation (Chacko et al., 2015; Gregory, 2012). Liquidity risk or entity credit risk is the risk that an entity may fail to fulfil contractual obligation (IASB, 2005).
Market risk is the risk that the fair value or future cash flows of a financial instrument will fluctuate because of changes in market prices. This risk consists of three types: currency risk, interest rate risk, and other price risk. Regarding the definition of risk disclosure under IFRS 7, the first two risk disclosures (i.e., credit risk and liquidity risk) specifically illustrate the individual risk disclosure for a particular company, the so-called “idiosyncratic risk disclosure”. Market risk disclosure describes a firm’s risk exposure occurring from the broader trends of market so- called “systematic risk disclosure”. Accordingly, under IFRS 7, firms are required to disclose risks arising from financial instruments that the entity owns, indicating that IFRS 7 requires firms to provide a negative signal or unfavorable disclosure regarding their financial instruments (thus implying a negative disclosure tone). Therefore, to control disclosure tone of information, this study treats risk disclosure under IFRS 7 adoption as a negative signal or unfavorable disclosure tone.
Heinle & Smith (2017) developed a model to explore the relationship between risk disclosure and cost of capital by investigating how investors respond to risk disclosure. If risk disclosure leads to reduced uncertainty over the cash flow variance, it should reduce the firm’s cost of capital. Developing a model from the capital asset pricing model (CAPM), the results showed that risk disclosure decreases a firm’s cost of capital through cash flow variance uncertainty. However, their results only applied to systematic risk disclosure (aggregate risk or industry-wide risk, e.g., market risk) but not idiosyncratic risk disclosure (individual risk or firm-level risk), which is not priced by the market.
Dutta & Nezlobin (2017) investigated the association between information disclosure, firm growth, and the cost of capital, capturing both systematic and idiosyncratic risks. The results show that if a firm’s growth is above (below) a certain threshold, a higher precision of public disclosure will lead to higher (lower) investor uncertainty about a firm’s future cash flows and stock price, thus resulting in a higher (lower) cost of equity for the firm. This indicates that more precise public disclosure not only reduces investors’ uncertainty about a firm’s future cash flows and results in decreases in the firm’s cost of capital, but in some cases also enlarges investors’ uncertainty and hence increases the firm’s cost of capital. More importantly, they found that in a large multi-asset economy, investors only depend on systematic risk disclosures. The finding emphasizes that the negative effect of risk disclosure and cost of capital in previous studies only applies to systematic risk disclosures. This result is partially consistent with Johnstone (2016), who studied the effect of information on a firm’s cost of capital and found slightly different results. On the one hand, the precision of available information can bring more uncertainty about a firm’s future cash flows, which results in a higher cost of capital. On the other hand, the information does indeed lead to increased certainty about a firm’s future cash flows, which results in decreased cost of capital. Importantly, the reduction in the cost of capital will occur only when the information signal is positive, and on the contrary, the cost of capital will increase as the information signs a negative signal.
The results indicate that the firm’s cost of capital not only depends on the precision and the quantity of information but also on the direction of information or disclosure tone (i.e., positive or negative). This empirical result is consistent with Kothari et al. (2009), who studied the effect of disclosure via various sources (i.e., management, analysts, and business press) on cost of capital using content analysis and found mixed evidence from the association between disclosure and a firm’s cost of capital occurring from disclosure tone. The author found that unfavorable disclosures accompanied by higher risk measures resulted in a higher cost of capital as expected, but they did not find evidence of this negative association from management’s disclosure, the source of the firm itself. Favorable disclosures are not weighted by the market and hence result in a lower cost of capital.
Moreover, Campbell et al. (2014) studied the information content of mandatory risk factor sections in firms’ Form 10-K using textual analysis and found that negative disclosure is positively associated with market-based measures of firm risk, suggesting that when investors are provided with negative disclosure, they perceive more risk about firms.
According to previous studies, there is no doubt about the negative association between systematic risk disclosure (i.e., market risk disclosure) and a firm’s cost of capital; the increase in systematic risk disclosure decreases a firm’s cost of capital, as appears in Heinle & Smith (2017) and Dutta & Nezlobin (2017). However, there is inconclusive evidence about the association between idiosyncratic risk disclosure and cost of capital. We chose to re-examine this association using specific risk disclosures credit risk and liquidity risk disclosures under IFRS 7, which imply idiosyncratic risk disclosure and represent an unfavorable disclosure tone. This led us to the research question: How do credit risk and liquidity risk disclosures affect a firm’s cost of capital?
Based on the research question, the association between a specific risk disclosure and the company’s cost of capital was investigated. Following Kothari et al. (2009), Campbell et al. (2014), Johnstone (2016) and Dutta & Nezlobin (2017), we posit that a higher level of risk exposure, representing an unfavorable tone, makes investors feel more uncertain about a firm’s future cash flows and results in an increased cost of capital. Therefore, we predict that a firm with a higher level of specific risk disclosures credit risk and liquidity risk will have a higher cost of capital.
H1: An increased level of credit risk and liquidity risk disclosure will increase a firm’s cost of capital.
Research Design
Textual Analysis
In the textual risk disclosure literature, many previous studies have applied textual analysis to analyze text communicating risk information. Li (2006) measured the sentiment of annual Form 10-K filings by counting the frequency of words related to risk under a defined dictionary and then applied it to calculate the difference as risk disclosure measures. Kothari et al. (2009) used dictionary methods to calculate the quantity of positives and negatives in each textual disclosure. Kravet & Muslu (2013) measured textual risk disclosure in 10-K filings by using the dictionary method and counting risk sentences and the changes in the entire 10-K before and after risk factor section. Campbell et al. (2014) used the word counting and classification method, based on the dictionaries used in prior studies, to measure risk factor disclosure in 10-K filings.
Regarding the textual risk disclosure literature, we use textual analysis to measure the level of credit risk and liquidity risk disclosure in this study. The textual risk disclosures were extracted from firms’ annual reports, which were available in English via the companies’ websites. These textual data were then analyzed using the textual analysis program Python to compute the measures of disclosure change variables, including (1) total word count, (2) total keyword count, (3) total sentence count and (4) total sentence count containing keywords (Beretta & Bozzolan, 2004; Campbell et al., 2014; Kravet & Muslu, 2013; Lang & Lawrence, 2015).
In the textual analysis process, we manually analyzed all available annual report footnotes for each country that adopted IFRS to ensure that credit risk and liquidity risk were disclosed. We found that credit risk and liquidity risk disclosure were classified under different main topics and subtopics; therefore, we listed all topics and came up with 22 main topics indicating risk disclosure under IFRS 7 and 88 subtopics indicating specific risk disclosure. Firms used 43 subtopics to disclose liquidity risk and 45 subtopics for credit risk. All main topics and subtopics were added to Python to capture the specific keywords for credit risk and liquidity risk disclosure.
Next, we randomly sampled firms’ annual reporting footnotes, which were not included in the sample used in this study, to define the new dictionary for credit risk disclosure and liquidity risk disclosure. A total of 31 annual reporting footnotes (31 firms) were used in this stage. We reviewed all annual reporting footnotes under the topics of credit risk and liquidity risk, then listed and counted keywords related to credit risk and liquidity risk disclosures. Regarding the frequency of words used to identify the keywords in this study, each word with a frequency of more than one and used by two different firms was included to ensure that each keyword was commonly used to imply the risks among the sample firms. From this process, we obtained 20 keywords, eight for credit risk disclosure and 12 for liquidity risk disclosure. Some of these keywords allowed for truncation; for example, contract* includes contract, contracts, and contractual. All keywords are shown in Table 1.
| Table 1 The New-Defined Dictionary | |||
| Credit risk keywords | Liquidity risk keywords | ||
| Keywords | Allowable suffix examples | Keywords | Allowable suffix examples |
| Aging Contract* Counterpart* Credit* Default* Obligation* Receivable* Term* |
- Contracts, Contractual Counterparty, Counterparties Credit, Creditworthiness Default, Defaults Obligation, Obligations Receivable, Receivables Term, Terms |
Agreement* Commitment* Committed Covenant* Creditor* Debt Financing Liabilit* Liquid* Maturit* Payable* Repay* |
Agreement, Agreements Commitment, Commitments - Covenant, Covenants Creditor, Creditors - - Liability, Liabilities Liquid, Liquidity, Liquidities Maturity, Maturities Payable, Payables Repay, Repayment |
| * Keyword with allowable suffixes | |||
To ensure the accuracy of the Python program’s ability to capture keywords in annual report footnotes, we manually checked 560 firm-year annual report footnotes of 56 firms and found an error of less than 5%. Thus, the Python program effectively captured the keywords identified in this study.
Risk Disclosure Measurement
Most previous studies have used disclosure measures related to the length or size of the file (Li, 2010), such as the number of pages, words, or sentences (Campbell et al., 2015; Filzen, 2015; Leuz & Schrand, 2009; You & Zhang, 2009). However, word or sentence count measures of the narrative risk of disclosure may be influenced by the dilution effect due to the massive amounts of information that firms disclose (Beretta & Bozzolan, 2004). For this reason, using the density of disclosure has been proposed to resolve this issue. Beretta & Bozzolan (2004) studied the quality of risk communication and introduced the density communication ratio as the proportion of the number of sentences containing risk information to the total number of sentences in the management and discussion analysis, and they found that this measure can be used to rank the quality of risk disclosure. Kravet & Muslu (2013) also applied this measure to their study. They reasoned that a sentence is the smallest composition of text used to convey an idea, and that they can avoid re-counting the same risk-related information. Based on these studies, we measured the level of specific risk disclosure by calculating the density communication ratio of credit and liquidity risk disclosures, which started with counting words, keywords, sentences, and sentences containing keywords related to the specific risks in the financial reports’ footnotes. Next, we formulated the first density communication measures from the ratio of total keywords to total words and the second from the ratio of total sentences containing keywords to total sentences. These measures represented the density of risk keywords (DISCVAR1) and the density of sentences containing risk keywords (DISCVAR2), respectively. By doing this, we ensured that the textual disclosure was related to credit risk and liquidity risk as required by IFRS 7.
Cost of Capital Measurement
The CAPM is commonly used to estimate a firm’s cost of capital. For example, Heinle & Smith (2017) used the CAPM as the underlying framework to construct their model that explored the association between risk disclosure and a firm’s cost of capital. However, the results showed that the earnings disclosure model is only applicable to a firm’s systematic risks but not idiosyncratic risks. Kothari et al. (2009) used the Fama & French (1993) three-factor model to investigate the effects of different disclosure sources on a firm’s cost of capital. However, the effect of a company’s management disclosure on a firm’s cost of capital did not behave as predicted. The authors argued that an inaccurate measure of a firm’s cost of capital in the study may explain this result. CAPM is based on returns and systematic risks, whereas these previous studies incorporated both systematic and idiosyncratic risks, thus leading to unexpected results. According to this evidence, using CAPM as the underlying theoretical framework to estimate a firm’s cost of capital may be problematic.
The implied cost of capital (ICC) is another alternative approach proposed in previous studies to estimate the cost of capital (Bini, 2018; Easton, 2004; Gordon & Gordon, 1997; Hou et al., 2012). The ICC is the expected rate of return implied by market prices, accounting numbers, earnings forecasts, and dividends (Easton, 2007). In other words, it is the rate of a firm’s future cash flows discounted by the market. This approach is used to avoid a noisy proxy of realized returns, which are used in many frameworks, such as the CAPM and the Fama & French (1993) three-factor model, which have been criticized for deviating from the expected return over a long time span (Bini, 2018; Hou et al., 2012).
This study focused on the effects of credit risk and liquidity risk disclosures, which are idiosyncratic risks, under IFRS 7 adoption on a firm’s cost of capital. Credit risk and liquidity risk were also more pronounced during the financial crisis of 2007 to 2009. Therefore, we used the ICC to estimate the firm’s cost of capital in this study by developing a model based on the model-based earnings forecast or the forecast earnings of individual firms as a proxy for expected returns, as suggested by Hou et al. (2012). To obtain individual firms’ earnings forecasts, we estimated coefficients of the cross-sectional earnings model using the previous five years of data. The pooled cross-sectional regressions were calculated as follows:
![]()
where ![]() is the earnings of firm i for year t+1,
is the earnings of firm i for year t+1, ![]() is the firm size, which is calculated by the natural log of total assets,
is the firm size, which is calculated by the natural log of total assets, ![]() is the dividend pay-out per share,
is the dividend pay-out per share, ![]() is a dummy variable that is equal to 1 for the dividend payer and 0 otherwise,
is a dummy variable that is equal to 1 for the dividend payer and 0 otherwise, ![]() , is the earnings of firm i for year t calculated by the natural log of net income,
, is the earnings of firm i for year t calculated by the natural log of net income, ![]() is a dummy variable that is equal to 1 for a firm with negative earnings and 0 otherwise, and
is a dummy variable that is equal to 1 for a firm with negative earnings and 0 otherwise, and ![]() is the error term. Following Hou et al. (2012), we began by estimating the coefficients of the pooled cross-sectional earnings model from 2005 to 2014 using the prior five years of data from between 2000 and 2014. We regressed the model each year, which allowed the coefficients of the model to vary over time, and thus we estimated the earnings forecasts for each year from 2005 to 2014.
is the error term. Following Hou et al. (2012), we began by estimating the coefficients of the pooled cross-sectional earnings model from 2005 to 2014 using the prior five years of data from between 2000 and 2014. We regressed the model each year, which allowed the coefficients of the model to vary over time, and thus we estimated the earnings forecasts for each year from 2005 to 2014.
Next, the firm’s cost of capital was estimated following the work of Gordon & Gordon (1997) for simplicity. This measurement was developed from the dividend discount model. The strength of this approach is that it does not rely on realized returns. Instead, it estimates expected returns directly from current stock prices and future cash flows, which is reasonable for investors’ decision making. Hou et al. (2012) estimation of ICC used a cross-sectional earnings model, which provides a strong positive predictor of future realized returns, and was superior to analysts’ forecasts no matter which method is used to compute the ICC (e.g., Claus & Thomas (CT, 2001), Easton (modified price-earnings growth or MPEG, 2004), Gebhardt et al. (GLS, 2001), Gordon & Gordon (Gordon, 1997), and Ohlson & Juettner-Nauroth (OJ, 2005)). Thus, to estimate the ICC in this study, we used Gordon and Gordon’s (1997) model, which is written as follows:
 (2)
(2)
Where, COCit is the ICC of firm i in year t, PRICEit is the average price per share during the calendar month following the annual report filing date of firm i in year t, Eit ( ) is the market expectations based on information available in year t, and Ei(t+1) is the earnings of firm i in year t+1.
The Effect of Specific Risk Disclosures under IFRS 7 on a Firm’s Cost of Capital
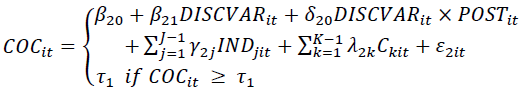
To examine the effect of specific risk disclosures under IFRS 7 on the cost of capital, we developed a random effect Tobit model based on Heinle & Smith’s (2017) finding that risk disclosure decreases a firm’s cost of capital due to the uncertainty of the firm’s cash flows. The bid-ask spread (SPREAD) and return volatility (STDRET) were set as proxies of uncertainty. The random effect Tobit model was developed to censor the outlined data embedded in the cost of capital proxy (COC) and to test the cost of capital effect as follows. Equations (3) and (4) present the model before and after adding the uncertainty proxy, respectively:
Before adding the uncertainty proxy:
 (3)
(3)
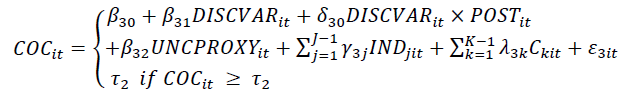
After adding the uncertainty proxy:
 (4)
(4)
Where, COCit is the ICC as defined in Equation (2). ![]() is a dichotomous variable indicating IFRS 7 adoption period, which is equal to 1 for annual report filing dates on or after IFRS 7 adoption and 0 before the adoption.
is a dichotomous variable indicating IFRS 7 adoption period, which is equal to 1 for annual report filing dates on or after IFRS 7 adoption and 0 before the adoption. ![]() is the disclosure variable of firm i at the end of fiscal year t.
is the disclosure variable of firm i at the end of fiscal year t. ![]() is one of two uncertainty proxies either bid ask spread (SPREAD) or return volatility (STDRET) of firm i at the end of fiscal year t. SPREAD is the natural log of the average daily bid ask spread during the calendar month following the annual report filing date (average daily bid ask spread is measured as the difference between daily ending bid price and daily ending ask price scaled by the average of bid ask). Return volatility is the standard deviation of daily returns during the calendar month following the annual report filing date.
is one of two uncertainty proxies either bid ask spread (SPREAD) or return volatility (STDRET) of firm i at the end of fiscal year t. SPREAD is the natural log of the average daily bid ask spread during the calendar month following the annual report filing date (average daily bid ask spread is measured as the difference between daily ending bid price and daily ending ask price scaled by the average of bid ask). Return volatility is the standard deviation of daily returns during the calendar month following the annual report filing date. ![]() is the industry type represented by the industrial dummy j.
is the industry type represented by the industrial dummy j. ![]() is the firm’s country represented by the country dummy k.
is the firm’s country represented by the country dummy k. ![]() are the composite error terms,
are the composite error terms, ![]() , where
, where ![]() are the cross-section error component, and
are the cross-section error component, and ![]() are the combined time series and cross-section error component.
are the combined time series and cross-section error component. ![]() are upper-censored limits that are equal to 1.
are upper-censored limits that are equal to 1.
The hypothesis proposes that a firm’s increased credit risk and liquidity risk disclosures lead to an increased cost of capital. Thus, the positive coefficients for ![]() are expected. Moreover, if investor uncertainty occurs due to a specific risk disclosure effect, the coefficient of uncertainty proxy,β32, should be positively significant.
are expected. Moreover, if investor uncertainty occurs due to a specific risk disclosure effect, the coefficient of uncertainty proxy,β32, should be positively significant.
Data and Sample Selection
The data used in this study were obtained from all companies listed in the principal stock exchange of 62 countries that adopted IFRS between 2005 and 2014. Sample firms were generated by the intersection of firms that had annual reports available and were in the DATASTREAM, I/B/E/S and WORLDSCOPE databases to estimate variables and test the hypothesis. We had to use data from all three sources because we also added the uncertainty proxy (i.e., bid-ask spread (SPREAD) or return volatility (STDRET)) to test the cost of capital effect. The inclusion requirements were firms with data available in the DATASTREAM, I/B/E/S and WORLDSCOPE databases, which filed between 1 January 2006 and 31 December 2015, had a fiscal year end on 31 December, were not in the financial industry, and all used the same functional currency. Following the sample selection procedure, 225 firms, or 1,661 firm-year observations, were identified, all of which came from European countries (Table 2). This is reasonable given that Europe fully adopted IFRS as its accounting standard earlier than other regions; thus, more complete data were available from firms in this region.
| Table 2 Panel a Sample Selection Process | |
| No. of firms | |
| Initial firms in principal stock exchange which adopt IFRS | 46,639 |
| Firms that are not match with the following requirements: | (45,941) |
| - Firms with available data in DATASTREAM, I/B/E/S, and WORLDSCOPE databases. | |
| - Firms filed between January 1, 2006 and December 31, 2015 | |
| - Firms that have a fiscal year end on December 31 | |
| - Firms that are not financial industry | |
| Firms with different currency | (397) |
| Firms which are unavailable annual reporting footnotes | (76) |
| Number of firms available for textual disclosure analysis | 225 |
| Panel B SAMPLE BY COUNTRY | |
| Belgium | 24 |
| Finland | 45 |
| France | 75 |
| Ireland | 7 |
| Italy | 27 |
| Netherlands | 40 |
| Portugal | 7 |
| Total | 225 |
Empirical Results
Summary Statistics
Table 3, Panel A presents descriptive statistics of the dependent and independent variables used to test the effects of specific risk disclosure under IFRS 7 adoption on firm cost of capital. The average cost of capital for the sample firms was 1.419, with an interquartile range of 0.311 to 1.299.
| Table 3 Panel A Descriptive Statistics For Variables | |||||||||||
| Mean | Std. Dev. | Min. | Q1 | Median | Q3 | Max. | |||||
| COC | 1.419 | 3.321 | 0.011 | 0.311 | 0.588 | 1.299 | 68.541 | ||||
| DISCVAR1 | 0.162 | 0.129 | 0.000 | 0.070 | 0.139 | 0.226 | 0.961 | ||||
| DISCVAR2 | 2.117 | 1.908 | 0.000 | 0.875 | 1.735 | 2.789 | 5.204 | ||||
| POST | 0.890 | 0.312 | 0.000 | 0.000 | 1.000 | 1.000 | 1.000 | ||||
| SPREAD | -5.789 | 1.157 | -7.604 | -6.692 | -5.814 | -4.927 | -3.920 | ||||
| STDRET | 0.018 | 0.008 | 0.008 | 0.013 | 0.016 | 0.022 | 0.034 | ||||
| Panel B Pearson’s Correlation Matrix | |||||||||||
| COC | DISCVAR1 | DISCVAR2 | POST | SPREAD | STDRET | ||||||
| COC | 1.000 | ||||||||||
| DISCVAR1 | 0.042*** | 1.000 | |||||||||
| DISCVAR2 | 0.008*** | 0.832*** | 1.000 | ||||||||
| POST | 0.072*** | 0.192*** | 0.159*** | 1.000 | |||||||
| SPREAD | 0.266*** | 0.031 | 0.009 | 0.079*** | 1.000 | ||||||
| STDRET | 0.102*** | 0.066*** | 0.067*** | 0.192*** | 0.113*** | 1.000 | |||||
The mean percentage of specific risk keyword disclosure (DISCVAR1) and the mean percentage of sentences containing risk keyword disclosure (DISCVAR2) were 0.162% and 2.117%, respectively, which were slightly higher than the median percentages (0.139% and 1.735%, respectively). Pearson’s correlation matrix of variables in Panel B shows that the cost of capital has a weak but significant positive correlation with the specific risk disclosure measures, IFRS 7 adoption period, and both market-based uncertainty proxies (SPREAD and STDRET), which was expected. We also checked for multicollinearity by calculating the variance inflation factors (VIFs) as less than 3, except for DISCVAR1 and DISCVAR2, which showed the VIFs of 3.29 and 3.25, respectively. There is no surprise about the correlation between these two variables because both are risk disclosure variables. Therefore, there is no multicollinearity problem.
Result of the Effect of Specific Risk Disclosures under IFRS 7 on a Firm’s Cost of Capital
Table 4 presents the results of the random effects Tobit regression for the specific risk disclosure under IFRS 7 adoption on a firm’s cost of capital. Columns 1 and 2 show the results for the effects of the density of specific risk keyword disclosure (DISCVAR1) and the density of sentences containing risk keyword disclosure (DISCVAR2), respectively. The association between the specific risk disclosure measures and the firm’s cost of capital was statistically significant and positive in both measures, as presented by the positive coefficients of the interaction terms DISCVAR1×POST (0.553; p < 0.01) and DISCVAR2×POST (0.038; p < 0.01). These results support the hypothesis as predicted.
| Table 4 Random Effects Tobit Regression of Specific Risk Disclosure Under IFRS 7 on a Firm’s Cost of Capital | ||
 (3) (3) |
||
| Variables | COC | |
| 1 DISCVAR1 |
2 DISCVAR2 |
|
| Intercept | 0.566*** | 0.572*** |
| (0.000) | (0.000) | |
| DISCVAR1 | -0.388** | |
| (0.011) | ||
| DISCVAR2 | -0.026** | |
| (0.016) | ||
| DISCVAR1×POST | 0.553*** | |
| (0.000) | ||
| DISCVAR2×POST | 0.038*** | |
| (0.000) | ||
| IND | Included | Included |
| C | Included | Included |
| Sigma_u | 0.315*** | 0.316*** |
| (0.000) | (0.000) | |
| Sigma_e | 0.231*** | 0.231*** |
| (0.000) | (0.000) | |
| Log likelihood | -455.512 | -455.710 |
| Chi-Squared | 148.28 | 146.64 |
| N = 225 firms or 1,661 firm-year observations. This table presents the result of hypothesis testing for the effect of specific risk disclosure changes under IFRS 7 adoption on a firm’s cost of capital using the random effects Tobit estimation, where COCit is the implied cost of capital as defined in Equation (2). is the risk disclosure variable (i.e., the density of risk keywords [DISCVAR1] and density of sentences containing risk keywords [DISCVAR2]) for firm i in year t. is a dummy variable indicating the IFRS 7 adoption period, where s equal to 1 for annual report filing dates on or after IFRS 7 adoption and 0 before adoption for firm i in year t. is the industry type represented by the industrial dummy j. is the firm’s country represented by the country dummy k. is the composite error term; = , where is the cross-section error component, and is the combined time series and cross-section error component. is the upper-censored limit, which is equal to 1. Numbers in parentheses indicate p-values. *** p < 0.01, ** p < 0.05, * p < 0.1. | ||
| Table 5 Random Effects Tobit Regression of Specific Risk Disclosures Under IFRS 7 on a Firm’s Cost of Capital (After Adding Uncertainty Proxy) | ||||
 (4) (4) |
||||
| Variables | COC | |||
| SPREAD | STDRET | |||
| 1 DISCVAR1 |
2 DISCVAR2 |
3 DISCVAR1 |
4 DISCVAR2 |
|
| Intercept | 1.423*** | 1.430*** | 0.387*** | 0.391*** |
| (0.000) | (0.000) | (0.000) | (0.000) | |
| DISCVAR1 | -0.312** | -0.227 | ||
| (0.027) | (0.122) | |||
| DISCVAR2 | -0.022** | -0.016 | ||
| (0.028) | (0.134) | |||
| DISCVAR1×POST | 0.470*** | 0.356*** | ||
| (0.000) | (0.006) | |||
| DISCVAR2×POST | 0.034*** | 0.025*** | ||
| (0.000) | (0.005) | |||
| SPREAD | 0.139*** | 0.140*** | ||
| (0.000) | (0.000) | |||
| STDRET | 9.120*** | 9.145*** | ||
| (0.000) | (0.000) | |||
| IND | Included | Included | Included | Included |
| C | Included | Included | Included | Included |
| Sigma_u | 0.298*** | 0.300*** | 0.313*** | 0.314*** |
| (0.000) | (0.000) | (0.000) | (0.000) | |
| Sigma_e | 0.213*** | 0.213*** | 0.222*** | 0.222*** |
| (0.000) | (0.000) | (0.000) | (0.000) | |
| Log likelihood | -348.446 | -348.228 | -403.496 | -403.214 |
| Chi-Squared | 365.26 | 364.55 | 249.36 | 249.12 |
| N = 225 firms or 1,661 firm-year observations. This table presents the result of the hypothesis to test the effect of specific risk disclosure changes under IFRS 7 adoption on a firm’s cost of capital using the random effects Tobit estimation, where COCit is the implied cost of capital as defined in Equation (2). is the risk disclosure variable (i.e., the density of keywords [DISCVAR1] and sentences containing keywords [DISCVAR2]) for firm i in year t. is a dummy variable indicating the IFRS 7 adoption period, which is equal to 1 for annual report filing dates on or after IFRS 7 adoption and 0 before adoption for firm i in year t. UNCPROXYit is one of two market-based uncertainty proxies—bid-ask spread (SPREAD) or return volatility (STDRET)—for firm i at the end of fiscal year t. SPREAD is the natural log of the average daily bid-ask spread during the calendar month following the annual report filing date (average daily bid-ask spread is measured as the difference between daily ending bid price and daily ending ask price scaled by the average of bid-ask). Return volatility is the standard deviation of daily returns during the calendar month following the annual report filing date. is the industry type represented by the industrial dummy j. is the firm’s country represented by the country dummy k. is the composite error term; = , where is the cross-section error component, and is the combined time series and cross-section error component. is the upper-censored limit and is equal to 1. Numbers in parentheses indicate p-values. *** p < 0.01, ** p < 0.05, * p < 0.1. | ||||
Conclusion
This study examined the effect of specific risk disclosures under IFRS 7 adoption credit risk and liquidity risk disclosures on a firm’s cost of capital. Prior studies presented misleading and inconclusive evidence that a higher disclosure level can decrease a firm’s cost of capital. Overall, the results from the random effects Tobit regression suggest that an incremental specific risk disclosure under IFRS 7 adoption increases the firm’s cost of capital, supporting the prediction of this study. The result also shows a persistent cost of capital effect after adding the market-based uncertainty proxy, bid-ask spread (SPREAD) and return volatility (STDRET). This finding broadens the literature on the association among specific risk disclosures under IFRS 7, investors’ uncertainty, and firms’ cost of capital. A higher specific risk disclosure improves the precision of risk disclosure and affects investor uncertainty, resulting in a higher cost of capital to compensate for the investors’ perceived risk.
For example, once investors are provided with a specific risk disclosure, they are no longer confident that they can trade their stock at a certain price in the future or that they will get an expected stock return. Credit risk disclosure and liquidity risk disclosure under IFRS 7 are idiosyncratic risk disclosures that require firms to provide a negative signal or unfavourable disclosure about the financial instruments they own by themselves. The specificity and clarity of the disclosure tone may help support investors’ understanding about their investment uncertainty (i.e., expected stock returns) or cause them to perceive more risk about the firms (Campbell et al., 2014). For these reasons, investors require more returns to compensate for the risks they encounter, resulting in increased costs of capital for firms. These findings broaden those of Campbell et al. (2014), Johnstone (2016), and Dutta & Nezlobin (2017), who found that a higher precision of unfavourable information increases user uncertainty about a firm’s value, thus leading to an increased cost of capital. Moreover, our findings enhance Heinle & Smith’s (2017) evidence that only systematic risk disclosures, but not idiosyncratic ones, decreases a firm’s cost of capital. Additionally, these results are consistent with the findings of a recent study by Tirado et al. (2020), who used a Bayesian approach to study the relationship between risk disclosure and cost of equity and found that this positive association only appears for non-financial risks. In conclusion, our findings support the improvement of specific risk disclosure under the adoption of mandated accounting standards (i.e., IFRS 7) and suggest an association of risk disclosures with the perception of market sentiment. Consequently, an increase in the disclosure of risk information results in an increase in the firm’s cost of capital.
The results of this study are subject to certain limitations. First, many annual reporting footnotes were not provided via company websites or other information sources, resulting in a sample size that was quite small, especially for data before IFRS 7 adoption. Second, the different format of annual reporting footnotes for each sample led to an error in the textual analysis process in Python. Therefore, many samples were eliminated, and the sample size was further reduced. Further research could examine the effect of specific risk disclosure in an individual big stock exchange (e.g., the UK and the US) or compare the effect of specific risk disclosure between two large markets. Additionally, further study might examine which types of investors are more affected by specific risk disclosure (e.g., short-term investors or long-term investors).
References
- Bao, Y., & Datta, A. (2014). Simultaneously Discovering and Quantifying Risk Types from Textual Risk Disclosures. Management Science, 60(6), 1371–1391.
- Barry, C.B., & Brown, S.J. (1985). Differential Information and Security Market Equilibrium. The Journal of Financial and Quantitative Analysis, 20(4), 407–422.
- Beretta, S., & Bozzolan, S. (2004). A framework for the analysis of firm risk communication. International Journal of Accounting, 39(3), 265–288.
- Bini, M. (2018). Implied Cost of Capital: How to Calculate it and how to Use it. Retrieved November 29, 2020, from https://iris.unibocconi.it/retrieve/handle/11565/4020067/107037
- Campbell, J.L., Chen, H., Dhaliwal, D.S., Lu, H.M., & Steele, L.B. (2014). The information content of mandatory risk factor disclosures in corporate filings. Review of Accounting Studies, 19(1), 396–455.
- Campbell, J.L., Downes, J.F., & Schwartz, W.C. (2015). Do sophisticated investors use the information provided by the fair value of cash flow hedges? Review of Accounting Studies, 20(2), 934–975.
- Dutta, S., & Nezlobin, A. (2017). Information disclosure, firm growth, and the cost of capital. Journal of Financial Economics, 123(2), 415–431.
- Easley, D., & O’Hara, M. (2004). Information and the cost of capital. Journal of Finance, 59(4), 1553–1583.
- Easton, P. (2004). PE ratios, PEG ratios, and estimating the implied expected rate of return on equity capital PE ratios, PEG ratios, and estimating the implied expected rate of return on equity capital. The Accounting Review, 79(Jan 2004), 73–95.
- Easton, P. (2007). Estimating the cost of capital implied by market prices and accounting data. Foundations and Trends® in Accounting, 2(4), 241–364.
- Filzen, J.J. (2015). The information content of risk factor disclosures in quarterly reports. Accounting Horizons, 29(4), 887–916.
- Gordon, J.R., & Gordon, M.J. (1997). The finite horizon expected return model. Financial Analysts Journal, 53(3), 52–61.
- Heinle, M.S., & Smith, K.C. (2017). A theory of risk disclosure. Review of Accounting Studies, 22, 1459–1491.
- Hou, K., Dijk, M.A.V., & Zhang, Y. (2012). The implied cost of capital: A new approach. Journal of Accounting and Economics, 53(3), 504–526.
- IASB. (2005). International financial reporting standard 7: Financial Instruments: Disclosures. London: International Accounting Standards Board, 1–39.
- IASB. (2015). Conceptual Framework for Financial Reporting. International Accounting Standard Board (IASB).
- Johnstone, D. (2016). The effect of information on uncertainty and the cost of capital. Contemporary Accounting Research, 33(2), 752–774.
- Kothari, S.P., Li, X., & Short, J.E. (2009). The effect of disclosures by management, analysts, and business press on cost of capital, return volatility, and analyst forecasts: A study using content analysis. Accounting Review, 84(5), 1639–1670.
- Kravet, T., & Muslu, V. (2013). Textual risk disclosures and investors’ risk perceptions. Review of Accounting Studies, 18(4), 1088–1122.
- Lambert, R., Leuz, C., & Verrecchia, R.E. (2007). Accounting information, disclosure, and the cost of capital. Journal of Accounting Research, 45(2), 385–421.
- Lang, M., & Stice-Lawrence, L. (2015). Textual analysis and international financial reporting: Large sample evidence. Journal of Accounting and Economics, 60(2–3), 110–135.
- Leuz, C., & Schrand, C. (2009). Disclosure and the cost of capital. Journal of Business Finance Accounting, 45(2), 385–420.
- Li, F. (2010). Textual analysis of corporate disclosures: A survey of the literature. Journal of Accounting Literature, 29, 143–165.
- Papa, V. (2016). User Perspective on Financial Instrument Risk Disclosures Under International Financial Reporting Standards. CFA Program Books (Vol. 1).
- Schrand, C.M., & Elliott, J.A. (1998). Risk and financial reporting: A summary of the discussion at the 1997 AAA / FASB Conference. Accounting Horizons, 12(3), 271–282.
- Steffen, T.D. (2016). Improving Financial Statement Footnotes: Evidence from Derivative and Hedging Disclosures. SSRN Electronic Journal. Retrieved from http://www.ssrn.com/abstract=2739883
- Tirado-Beltrán, J.M., Cabedo, D., & Muñoz Ramírez, D.E. (2020). Risk disclosure and cost of equity: A Bayesian Approach. Retrieved from https://revistas.itm.edu.co/index.php/revista-cea/article/view/1497/1486
- Verrecchia, R.E. (2001). Essays on disclosure. Journal of Accounting and Economics, 32, 97–180.
- You, H., & Zhang, X.J. (2009). Financial reporting complexity and investor underreaction to 10-k information. Review of Accounting Studies, 14(4), 559–586.