Research Article: 2022 Vol: 26 Issue: 2S
The efficiency rate of stocks in Vietnam and the role of high-order moments
Vo Hoang Oanh, Thu Dau Mot University
Le Thi Lanh, University of Economics Ho Chi Minh City
Phan Thi Dieu Thao Le, Banking University Ho Chi Minh City
Citation Information: Oanh, V.H., Lanh, L.T., & Le, P.D.T. (2022). The efficiency rate of stocks in Vietnam and the role of high-order moments. Accounting and Financial Studies Journal, 26(S2), 1-8.
Abstract
Background: There is a limited number of Vietnamese studies which mentioned high-order moments. In the paper, we examined the role of the skewness and the kurtosis in the expected return of the stock in the Vietnam market in addition to other proven risk factors. Materials and methods: Using the system of asymmetric measures given by Kraus & Litzenberger (1976) and the system sharpness measures in Doan & Lin (2012), The significant level of the relevant risk compensation linked to these two parameters in predicting the rate of return of categories was investigated using the Fama-MacBeth two-stage regression method (1973). Results: All series were proved to be stationary, with a 5% significance level. The blocking component in the model had a statistically significant non-zero value, indicating that there are other factors that affect the expected return of the stock in the Vietnamese market in addition to the evaluated risk factors. Conclusion: In addition to other explanatory elements, high-order moments play an essential role in the stock model.
Keywords
Fama-MacBeth, Kurtosis, Skewness, Stock, Vietnam
Introduction
The CAPM valuation model assumed that investors only needed to consider the first two moments in the distribution of a stock's return to be average and variance, assuming that the return is normalized. This assumption implied that the risk of dispersion of the rate of return around the expected value was fully expressed through the variance or the standard deviation of the stock's rate of return; the downside risk and upside risk were the same as shown by the symmetrical bell shape in the standard distribution. There was ample evidence that the stock's return was not following the normal distribution and that only the first two moments were not sufficient to explain it (1-5). Specifically, Chung, et al., (2006) conducted a hypothesis of testing the standard distribution assumption of profitability ratios for each day, week, month, quarter, and half-year (2). The findings of their investigation showed that the distribution hypothesis was about to be rejected in all five cases mentioned above. Instead, the rate of return of the stock had a left or right distribution; or sharp or flat. This meant that the likelihood of a stock price increasing or decreasing was not the same, and the likelihood of achieving expected returns was also different from what the standard deviation showed, depending on the rate of return's probability distribution. Therefore, the researches have shifted to focus on the meaning of the addition of higher-order moment risk factors in distributing the return to the asset pricing model. A school strictly adhering to the spirit of the one-factor CAPM model was the higher-order moment model. The skewness (third moment) and the kurtosis (fourth moment) are two concepts that go beyond the mean-variance framework and were thought to be as important as the standard deviation of stock returns. Similarly, the investor's objective function is unlikely to be characterized by a quadratic utility function, which is more likely to have positive bias and a low rate of kurtosis.
There were many studies in the world proving the importance of the high-order moment factor in explaining the return of assets. According to Harvey & Siddque (2000), stocks with a substantial negative skewness tend to earn higher risk compensation. In the cross-regression of industry-class stock portfolios, Dittmar (2002); Poti & Wang (2010); discovered that skewness and kurtosis are all valued (6-8). For foreign stock portfolios, You & Daigler (2010) suggested that skewness be valued (9). Doan & Lin (2012) researched the Australian stock market provided evidence that in cross-regression in the rate of return of a stock portfolio, two high-moment components, systematic skewness and kurtosis, were significant (10). The system kurtosis factor represented an alternative role for the market beta in valuing stocks when the rate of return of stocks had large tail distribution.
Regarding Vietnam's stock market, there haven't been many researches that look at how high-order moments affect stock returns. Research by Vo Xuan Vinh & Nguyen Quoc Chi (2014) showed that the risk compensation of the skewness factor was statistically significant at 10% and positively affected the expected returns of the stock portfolio (11).
Through the above analysis, it is clear that scholars all around the world have given close attention to the process of comprehending and evaluating the impact of the high-order moment element in stock expected returns. However, these studies were mostly done on the data of developed markets; few studies go into analysis in emerging market countries. In Vietnam, an emerging market with two stock exchanges was established in a short time with a lot of recent volatility, understanding the contribution of higher-order moments to the ratio. The profitability of the stock will help investors better understand and appreciate this risk factor in making investment decisions. This study examined the significance of high-order Moments in explaining the expected stock market return rate in Vietnam.
Materials and Methods
Data Input
Data was collected from 202 non-financial businesses uploaded on HOSE and HNX from December 2007 to December 2014. VN index that was used to calculate the rate of return was collected every week on webpage cophieu68.com.
This study was carried out based on two previously established lists of 25 groups which were classified following two methods comprising skewness and kurtosis, and Market Capitalization Value (MV) and B/M (book-to-market) ratio. Each year, these two lists were updated.
Research Model
Skewness and kurtosis were calculated following these two formulae (10, 12)
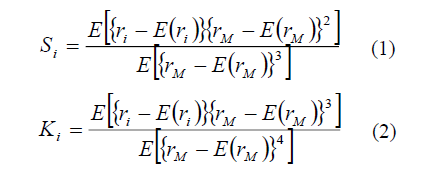
With ri and rM, respectively, asset i's return rate and the market return rate; E (ri) and E (rM) are asset i's expected return and the market's expected return, respectively.
Accordingly, the sensitivity of the rate of return of assets to market compensation, system asymmetry, and system sharpness could be presented as the following equation (3).

For ri, t, rf, t, and rm, t are the return rates of asset i, the risk-free rate, and the market rate of return at time t; (ri, t - rf, t) is the dominant rate of return for asset i; (rm, t - rf, t) is the return to market rate; SPt and KPt are the complementary rates of return of systematic skewness and system kurtosis; and ei, t is the error at time t; β1, i, β2, i, β3, i represent the risk sensitivity of market factors, system asymmetry, and system sharpness respectively.
To test whether the risk sensitivity of the four moments was important in explaining the average asset rate of return, the cross-regression test is presented in equation (4) below.
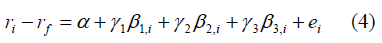
With ri is the portfolio's rate of return i, the risk-free rate is rf, (ri - rf) is the portfolio i's outstanding rate of return; β1, i, β2, i and β3, i are the estimated beta from equation (3). As a result, the second, third, and fourth moments can be measured using these metrics. The values γ1, γ2, γ3 respectively represented market risk compensation, system skewness and, kurtosis.
This study examined the significance of two high-order moment factors in explaining the expected return of stock alongside other proven risk factors, so the models tested include The traditional CAPM 2 Moment model, the CAPM model added the skewness, the CAPM model added the kurtosis factor, the CAPM 4 Moment model, respectively, was presented in equations from (5) to (9) below
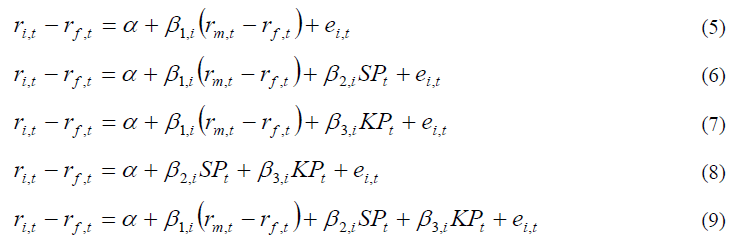
The rates of return of portfolio i the risk-free rate, and the market rate of return at time t are represented by ri, t, rf, t, and rm, t.; the outstanding rate of return for portfolio i is (ri, t – rf, t); (rm, t - rf, t) is the rate of return compensation of the market. SPt and KPt are the complementary rates of return of systematic asymmetry and system sharpness; the error at time t is denoted by ei, t. SP is measured by the difference in the rate of return between a stock portfolio with the lowest system kurtosis (K1) and a portfolio of equities having the greatest skewness (S5). KP is measured by the disparity in return rates between a stock portfolio with the highest system kurtosis (K5) and a stock portfolio with the lowest systematic skewness (S1).
The present study also tested the three-factor model of Fama-French and the three-factor model adding two high-order moments such as equations (10) and (11).
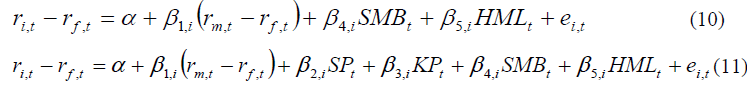
The rates of return of portfolio i the risk-free rate, and the market rate of return at time t are represented by ri, t, rf, t, and rm, t.; SPt and KPt are compensations for the skewness and kurtosis of the system's rate of return.; SMBt and HMLt are profit-offsets of the size factor and B/M ratio (book value ratio to equity market value); ei, t is the error at time t. The values β1, i, β2, i, β3, i, β4, i, β5, i respectively represent risk sensitivity of market factors, system skewness, system kurtosis, MV and B/M ratio.
Dickey-Fuller Test
One of the classical regression model assumptions is that the independent variables are non-random, they have defined values. If we estimate a model in which independent variables are non-stationary, the assumption of OLS (Ordinary Least Squares) is breached (13). A series is called stationary if the expectation, variance, and covariance are constant over time. Therefore, it is first conducted to ensure the validity of the value chains by utilizing the Unit Root Test (14).
Model: Yt=ρYt-1+Ut with error term Ut.
If ρ=1, Yt is in a random walk and a unit root is presented
E(Yt)=E(Yt-1)+E(Ut)=E(Yt-1), which means Yt has constant expectation
Var (Yt)=t.?2 as Y1= Y0+U1, Y2=Y0+U1+U2, Y3=Y0+U1+U2+U3…and Ui has a changeless variance ?2
At that time, the series does not stop, and the first-order differential error ΔYt=Yt – Yt-1=Ut is stationary. Null hypothesis Ho is ρ=1, which means the series Y is stationary (14).
Fama-MacBeth Two-Step Regression Method
This regression method was conducted following these steps below (15)
Step 1: At each week t, regress each equation (5) to (11) for each category, using 60 observations from t-60 to t-1. The result obtained a vector of 25 beta observations for each risk factor. Perform rolling regression (rolling) for N weekly observations in the entire sample. After completing step one, obtain a matrix (N-60) x25 beta observations for each risk factor corresponding to each tested model, with each column in the matrix representing a group. Let K be the number of variables explained in the tested model, each model will have the above K matrices.
Step 2: Regression the return rate of 25 categories with the beta estimated in step 1 according to the equations (12) to (18) as follows
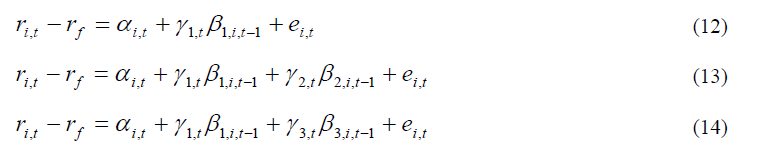
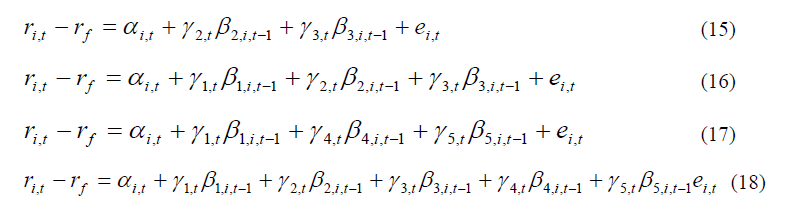
With i is the group number β1, i, t-1, β2, i, t-1 and β3, i, t-1, β4, i, t-1, β5, i, t-1 are beta of the market, the beta of system skewness and system kurtosis, the beta of MV, of B/M correspond to portfolio i at week t-1
After this step, a weekly series of observations of gamma estimated for each risk factor is obtained. Performing t-tests on these chains were given a t-value for the hypothesis to be tested: the mean gamma of risk factors i was non-zero statistically significant.
Results
The descriptive statistics of explanatory components in the model that were investigated with a sample of 307 observations every week in the Vietnamese market from January 2009 to December 2014 is shown in Table 1.
| Table 1 Descriptive Statistics of Explanatory Factors |
|||||
|---|---|---|---|---|---|
| Rmf | SP | KP | SMB | HML | |
| Minimum | -12.6479 | -7.6235 | -10.7165 | -6.8406 | -8.3068 |
| Maximum | 14.9492 | 7.6776 | 10.3449 | 9.6610 | 7.6262 |
| Mean | 0.0283 | -0.0271 | -0.1013 | 0.1503 | 0.4624 |
| Median | 0.2214 | 0.0421 | -0.0513 | 0.0810 | 0.4604 |
| Stdev | 3.5905 | 2.2506 | 3.1949 | 2.4251 | 2.0518 |
| Skewness | -0.0054 | 0.0807 | 0.0924 | 0.3353 | -0.0097 |
| Kurtosis | 1.8283 | 1.3372 | 0.9539 | 0.8781 | 1.6908 |
| p-value (t-test) | 0.8899 | 0.8329 | 0.5787 | 0.2782 | 9.729e-05 |
| Jaque-Bera test | 44.2547 | 24.192 | 12.7218 | 16.2534 | 37.9168 |
| p-value | <0.001 | <0.001 | <0.001 | <0.001 | <0.001 |
| τ | -11.351 | -11.377 | -11.483 | -11.575 | -10.437 |
| p-value | 0.01 | 0.01 | 0.01 | 0.01 | 0.01 |
| Notes: Rmf: Risk Management Framework; SP: skewness; KP: kurtosis ;SMB: Small Minus Big; HML: High Minus Low; B/M: Book-to-market ratio; stdev: Standard deviation | |||||
Dickey-Fuller Test
Table 1 also presents unit root test results including the statistical values τ and p-value, respectively for the explanatory variables. This table shows that all the independent variables in the regression model were stationary, with a 5% significance level.
The results are similar for the 25 outstanding returns series of 25 categories grouped by system asymmetry and system sharpness. As regards 25 groups formed based on MV and B/M ratio, all 25 of their superior return rates were stationary (Tables 2 and 3).
| Table 2 Summary of Test Results of 25 Groups Classified Based on System Skewness (S.S) and System Kurtosis (S.K) |
||||||||||
|---|---|---|---|---|---|---|---|---|---|---|
| S.K/S.S | 1 | 2 | 3 | 4 | 5 | 1 | 2 | 3 | 4 | 5 |
| τ | p-value | |||||||||
| 1 | -11.114 | -11.792 | -10.872 | -12.307 | -12.115 | 0.01 | 0.01 | 0.01 | 0.01 | 0.01 |
| 2 | -11.306 | -10.872 | -11.094 | -10.771 | -10.988 | 0.01 | 0.01 | 0.01 | 0.01 | 0.01 |
| 3 | -14.09 | -10.12 | -10.076 | -11.096 | -10.453 | 0.01 | 0.01 | 0.01 | 0.01 | 0.01 |
| 4 | -11.838 | -10.478 | -11.322 | -10.999 | -10.389 | 0.01 | 0.01 | 0.01 | 0.01 | 0.01 |
| 5 | -14.028 | -10.601 | -10.731 | -10.772 | -10.736 | 0.01 | 0.01 | 0.01 | 0.01 | 0.01 |
| Table 3 Summary of Test Results of 25 Groups Classified Based on B/M RATIO and MV |
||||||||||
|---|---|---|---|---|---|---|---|---|---|---|
| B/MMV | 1 | 2 | 3 | 4 | 5 | 1 | 2 | 3 | 4 | 5 |
| τ | p-value | |||||||||
| 1 | -12.809 | -10.35 | -10.65 | -10.508 | -10.402 | 0.01 | 0.01 | 0.01 | 0.01 | 0.01 |
| 2 | -12.73 | -11.247 | -11.376 | -10.324 | -10.166 | 0.01 | 0.01 | 0.01 | 0.01 | 0.01 |
| 3 | -13.33 | -10.567 | -10.449 | -10.915 | -10.311 | 0.01 | 0.01 | 0.01 | 0.01 | 0.01 |
| 4 | -10.242 | -10.901 | -11.807 | -9.9499 | -12.004 | 0.01 | 0.01 | 0.01 | 0.01 | 0.01 |
| 5 | -10.916 | -10.751 | -11.061 | -10.867 | -10.483 | 0.01 | 0.01 | 0.01 | 0.01 | 0.01 |
Fama-MacBeth Regression
Tables 4 and 5 show an average estimates of the cross regression of Fama-MacBeth, regression of the rate of return of the portfolio for beta factors, systematic skewness, system kurtosis, MV, and book-to-market value ratio.
| Table 4 Results of Fama-Macbeth Cross Regression For Groups Categorized By System Skewness and System Kurtosis |
|||||||
|---|---|---|---|---|---|---|---|
| Alpha | Gama1 | Gama2 | Gama3 | Gama4 | Gama5 | R2 | |
| (1) | 0.2987 | -0.4306 | 0.3719 | ||||
| (0.0807)* | (0.0989)* | ||||||
| (2) | -0.0136 | -0.2208 | 0.0034 | 0.4176 | |||
| (0.9386) | (0.5901) | (0.9851) | |||||
| (3) | 0.3226 | -0.6431 | 0.0151 | 0.4132 | |||
| (0.0840)* | (0.0389)** | (0.9562) | |||||
| (4) | 0.0285 | 0.0903 | -0.0448 | 0.4172 | |||
| (0.8416) | (0.6217) | (0.8701) | |||||
| (5) | 0.2250 | -0.4746 | 0.0823 | -0.0090 | 0.4576 | ||
| (0.2134) | (0.1151) | (0.6552) | (0.9735) | ||||
| (6) | 0.1021 | -0.2584 | -0.3127 | -0.1645 | 0.4571 | ||
| (0.5374) | (0.4845) | (0.2748) | (0.4159) | ||||
| (7) | 0.2859 | -0.4033 | 0.0644 | 0.0591 | -0.3945 | -0.3070 | 0.5336 |
| (0.0670)* | (0.4567) | (0.395) | (0.6436) | (0.4359) | (0.0029)*** | ||
| Note: ***: statistic level 1%; ** statistic level 5%; * statistic level 10% | |||||||
| Table 5 Results Of Fama-Macbeth Cross Regression For Groups Categorized By MV and B/M Ratio |
|||||||
|---|---|---|---|---|---|---|---|
| Alpha | Gama1 | Gama2 | Gama3 | Gama4 | Gama5 | R2 | |
| (1) | -0.1353 | 0.0742 | 0.3722 | ||||
| (0.4719) | (0.7839) | ||||||
| (2) | -0.2826 | -0.0021 | -0.3106 | ||||
| (0.1049) | (0.9938) | (0.0994)* | |||||
| (3) | -0.1733 | -0.0407 | 0.2653 | 0.4157 | |||
| (0.3706) | (0.8899) | (0.297) | |||||
| (4) | -0.2938 | -0.1803 | 0.2254 | ||||
| (0.05672)* | (0.3258) | (0.3459) | |||||
| (5) | -0.2847 | 0.0909 | -0.2320 | 0.2814 | 0.4107 | ||
| (0.1217) | (0.7566) | (0.2235) | (0.2632) | ||||
| (6) | -0.3325 | 0.0715 | 0.1274 | 0.3739 | |||
| (0.12) | (0.8102) | (0.3482) | (0.0017)*** | ||||
| (7) | -0.3756 | 0.2379 | -0.1648 | 0.1260 | 0.1047 | 0.3585 | 0.4170 |
| (0.0670)* | (0.4567) | (0.395) | (0.6436) | (0.4359) | (0.0029)*** | ||
| Note: ***: statistic level 1%; ** statistic level 5%; * statistic level 10% | |||||||
Discussion
In addition to higher-order moments, many studies also showed that the risk factor related to SMB and HML helped explain the fluctuations of the stock (2, 16). Fama & French (1993) established a three-factor asset valuation model that included market return, market size, and the book-to-equity-market-value ratio (16). In particular, SMB was measured by the difference in return rate between the groups of small-sized stocks and the groups of stocks with large MV; return of risk factor relative to HML was measured by the difference in return between the groups of shares with B/M ratio and the stock groups with the smallest B/M ratio. These results lead to a question of whether the risks related to the book value and the size factor to market value factor include high-order moment factors. Therefore, this study also tested the three-factor model of Fama-French and the three-factor model adding two higher-order moments.
Considering the R-squared values through the regression models, it can be seen that the addition of high-order moment to the valuation model generally increased the ability to explain the model shown by the increase. Increase of R squared. But the weak interpretation of the asymmetry factor and the correlation with the sharpness as well as the regression results varied depending on the book-to-market value ratio. However, because the average risk compensation of the system skewness factor (Gama2) was non-statistically significant, it showed that this risk factor was actually priced in the stock Vietnamese market. Investors also needed to consider the system asymmetry of the stock when considering securities included in the groups and should not stop at standard deviations or market beta of the stock.
The intercept coefficient values in regression models showed statistically significant nonzero values in the two pricing models. Therefore, there are a number of other factors that influence the expected return on equities in the Vietnamese market. These may be momentum, market sentiment, and liquidity, factors that Fama & French (1993) considered important but ignored. (16). This meant that it was likely that the factors mentioned above also contributed to the stock price movement, creating risks in the expected rate of return of the stock, which should be considered by investors.
Some limitations in this investigation are unavoidable. Firstly, the size of data regarding the Vietnamese market has constrained the analysis of stock studies. Secondly, this study used values collected every Friday, which could be affected by the Weekend Effect. Finally, this study does not mention Errors-in-variables in models that usually appear when two-staged Fama-MacBeth regression was applied. In further studies, scientists can consider improving the quality of the study.
Conclusion
Investors also need to consider the system skewness of the stock when considering stocks included in their portfolios, not stopping at standard deviations or beta of the stock market promissory note. The fact that the blocking coefficient in the model had a statistically significant non-zero value indicated that, in addition to the risk variables assessed, there were other factors that influenced the predicted return of the stock in the market.
References
Badrinath, S.G.S.C. (1988). On measuring skewness and elongation in common stock return distributions: The case of the market index. Journal of Business, 61, 451-72.
Chung, P., Johnson, H., & Schill, M. (2006). Asset pricing when returns are nonnormal: Fama-French vs Higher order systematic co-moments. Journal of Business, 79, 923-40.
Dittmar, R.F. (2002). Non-linear pricing kernels, kurtosis preference, and evidence from the cross-section of equity returns. Journal of Finance, 57, 369-402.
Doan, M.P., & Lin, C.T. (2012). On the robustness of higher-Moment factors in explaining average expected returns: Evidence from Australia. Research in International Business and Finance, 26, 67-78.
Dickey, D.A., & Fuller, W.A. (1979). Distribution of the estimators for autoregressive time series with a unit root. Journal of the American Statistical Association, 74(366), 427-31.
Fama, E.F., & MacBeth, J.D. (1973). Risk, return and equilibrium: Empirical tests. Journal of Political Economics, 81, 607-36.
Fama, E.F., & French, K.R. (1993). Common risk factors in the returns on stocks and bonds. Journal of Financial Economics, 33, 3-56.
Fama, E.F. (1965).The behavior of stock-market prices. Journal of Finance, 38, 34-105.
Harvey, C., & Siddque, A. (2000). Conditional skewness in asset pricing tests. Journal of Finance, 55, 1263-95.
Jean, W.H. (1971).The extension of portfolio analysis to three or more parameters. Journal of Financial and Quantitative Analysis, 6, 505-15.
Kraus, A., & Litzenberger, R.H. (1976). Skewness preference and the valuation of risk assets. Journal of Finance, 384, 1085?100.
Nham, N.H., Lien, T.B.V., Thanh, T.N.N., Binh, T.X.D., Nam, T.T.N., & Ca, T.N. (2007). Econometrics textbook. Ho Chi Minh City: Social labor publishing house.
Poti?, V., & Wang, D. (2010). The coskewness puzzle. Journal of Banking and Finance, 34, 1827-38.
Samuelson, P.A. (1970). The fundamental approximation theorem of portfolio analysis in terms of means, variances and higher moments. Review of Financial Studies, 374, 537?42.
Vo, V.X., & Nguyen, C.Q. (2014). Relationship between higher-order moment risk and stock return: An empirical study on the Vietnamese market. Economic Development Magazine, 288, 38-54.
Received: 20-Nov-2021, Manuscript No. AAFSJ-21-9413; Editor assigned: 22- Nov -2021, PreQC No. AAFSJ-21-9413 (PQ); Reviewed: 06-Dec-2021, QC No. AAFSJ-21-9413; Revised: 13-Dec-2021, Manuscript No. AAFSJ-21-9413 (R); Published: 03-Jan-2022