Research Article: 2023 Vol: 27 Issue: 2
The Exports of Knowledge Intensive Services. A Complex Metric Approach
Angelo Leogrande, LUM University Giuseppe Degennaro
Alberto Costantiello, LUM University Giuseppe Degennaro
Lucio Laureti, LUM University Giuseppe Degennaro
Citation Information: Leogrande, A., Costantiello, A., & Laureti, L. (2023). The exports of knowledge intensive services, a complex metric approach. Academy of Accounting and Financial Studies Journal, 27(2), 1-20.
Abstract
In the following article, the value of the "Knowledge Intensive Services Exports in Europe" in 36 European countries is estimated. The data were analyzed through a set of econometric models or: Poled OLS, Dynamic Panel, Panel Data with Fixed Effects, Panel Data with Random Effects, WLS. The results show that “Knowledge Intensive Services Exports” is negatively associated, among others, with "Buyer Sophistication", "Government Procurement of Advanced Technology Products", and positively associated with the following variables i.e. "Innovation Index", "Sales Impacts" and "Total Entrepreneurial Activity". Then a clusterization with k-Means algorithm was made with the Elbow method. The results show the presence of 3 clusters. A network analysis was later built and 4 complex network structures and three structures with simplified networks were detected. To predict the future trend of the variable, a comparison was made with eight different machine learning algorithms. The results show that prediction with Augmented Data-AD is more efficient than prediction with Original Data-AD with a reduction of the mean of statistical errors equal to 55,94%.
Keywords
Innovation, and Invention: Processes and Incentives; Management of Technological Innovation and R&D; Diffusion Processes; Open Innovation.
JEL Classification
O30; O31, O32; O33; O36.
Introduction
The following article analyzes the determinants of exporting high intensity services from European countries to non-European countries. The question of exporting high-intensity services is very relevant, as this category of services represents the excellence of the innovation economy. The export of high knowledge intensity services requires investments in human capital, the accumulation of intangible capital, and a capacity for organizing international commercial networks. These are activities with high added value and that occupy human capital with a very positive impact on the occupation and on the production capacity of countries. Technological innovation in the service sector has a significant impact on the productivity of workers. Increasing productivity is the best method for increasing companies towards export. Companies that export are also, generally, the most innovative and more competitive ones.
However, the urgency to deal with the issue of exporting high-intensity services in Europe does not only have a micro-economic and employment motivation. There are also macro-economic motivations relating to the international economic system. Europe, in fact, is significantly backward with respect to Asia and the USA in the sense of technological innovation and in the production of high-tech products and services. The countries that most export services in general and high -intensity services are China and the USA. It follows that if Europe wants to play a role in the context of global technological competition, then European countries should invest more in technology and knowledge.
In fact, Europe risks being a third area compared to China and the USA for technological innovation and the production of high -knowledge services and this positioning could certainly repropagate, also reducing the long -term economic growth path of the European continent. From a methodological point of view, various types of panel regressions have been used to verify the persistence of the econometric relationships tested among various models. Subsequently, a clusterization was proposed using the K-means algorithm optimized with the Elbow method, to verify the presence of areas and groupings between European countries in the sense of exporting high-knowledge services. In addition, a Network Analysis was created to grasp, beyond causal relationships, similar trends among the countries analyzed. Finally, several machine learning algorithms have been proposed with both original data and with increased data to identify the trends in the trend of the export of high intensity services at the country level. The use of the increased data made it possible to further refine the predictive activity through the machine learning algorithms.
The article continues as follows: the second paragraph has an analysis of literature, the third paragraph contains the econometric analysis, the fourth paragraph refers to the clusterization with the K-means algorithm, the fifth paragraph contains the Network Analysis, the sixth paragraph proposes the prediction with machine learning algorithms with original data, the seventh paragraph presents the results of the prediction with machine learning algorithms with augmented data, the eighth paragraph concludes.
Literature Review
Some bibliographic sources are analyzed below that deal with the theme of exporting services with high intensity of knowledge considering the impacts on GDP at country level and on firms’ productivity.
Moreno-Gómez et al. (2020) analyze the role of process innovation activity in the propensity to export knowledge-intensive services to Colombia. The results show the existence of a positive relationship between the size of the company and the propensity to export knowledge-intensive services. The propensity to export also has an impact in terms of process innovation. Braja & Gemzik-Salwach, (2020) consider the role of technological innovation on the export of high-tech products in the context of the European Union. The authors mainly address the issue of the manufacturing industry. However, their conclusions can also be partly extended by analogy to the export sector of services with a high content of knowledge. Stefaniak & B?k, (2018) consider the role of exporting services to Europe. Europe is behind the USA and Asia in exporting services due to poor competitiveness. The authors recognize the existence of areas of excellence also in the overall reduced performance of the European continent. The analysis refers to the period 2008-2015. Ferraz & Pereira, (2017) show the presence of a positive relationship between the presence of small and medium-sized enterprises oriented towards knowledge-intensive production and private investment in research and development using a sample of European countries between 2008 and 2012. Lopez et al. (2020) consider the difficulty of the Chilean economy to free itself from the export of natural resources to achieve a more prosperous economy based on the export of knowledge-intensive services. Xuan (2017) analyze China's service export sector in terms of contributing to the growth of Chinese international trade. The findings underscore the lack of a positive, direct, and statistically significant relationship between knowledge intensive services and the growth of the service sector in China. Przybyli?ski, (2020) analyze the contribution of knowledge-intensive services to EU exports by comparing two aggregates of countries, namely EU-13 and EU-15. The authors find that the ability to export knowledge-intensive services is greater in EU-15 than in EU-13. The export of knowledge-intensive services is driven by the IT sector. Kir & Erdogan, (2021) suggest the use of agile Business Process Management to increase the ability of companies to generate knowledge-intensive services. Landaverry & Serafim, (2019) analyze the case of the dynamics of the diffusion of Knowledge Intensive Enterprises-KIEs in three countries: Guatemala, El Salvador, and Honduras. The authors verify that the lack of collaboration between research centers, entrepreneurs and the public sector prevents the development of a knowledge-intensive economy in the countries indicated. Bacovic, (2021) addresses the issue of the contribution that the export of services and the export of products gives to the Gross Domestic Product. The data refer to European countries between 2000 and 2019. The author verifies that in the more developed countries the percentage of exports of high-level knowledge services is high. The export of services with a high level of knowledge also tends to be associated with a growth in employment. The growth in labor productivity also leads to the growth of exports of services at the country level. Amoroso & Müller, (2018) highlight the role of Foreign Direct Investment-FDI in promoting productivity in knowledge-intensive sectors especially in the green sector. Kamp & de Apodaca, (2017) address the role of knowledge-intensive services in developing the competitive capacity of companies in the Basque country. The results show that the growth in the consumption of knowledge-intensive services at the local level has an impact on the export of knowledge-intensive services. Leydesdorff et al. (2019) use geo-localization tools to identify the presence of territories in the USA that have a high level in terms of Knowledge Intensive Services-KISs. The results contrast with the idea of the existence of a national innovation system, while highlighting the existence of models that operate at the state level. The results show the presence of some areas of strong development in the sense of HTKIS-High Tech Knowledge Intensive Services, namely the East Coast, California, and Texas. In addition, Silicon Valley and the Bay Area offer support for the development of KIS both in the US and globally. Desyllas et al. (2018) analyze the methods of acquiring technological innovation in knowledge-intensive service companies. The data used comes from a survey of a sample of 230 innovations from 150 knowledge-intensive companies listed on the US and UK stock exchanges. The methodology used distinguishes between companies oriented towards the minimization of costs and companies oriented towards differentiation. The results show that the companies oriented towards the minimization of costs which are the companies that carry out the business innovation activity are also the companies that have a greater orientation towards the appropriateness of the results of technological innovation.
The Econometric Model
We estimate the following model:
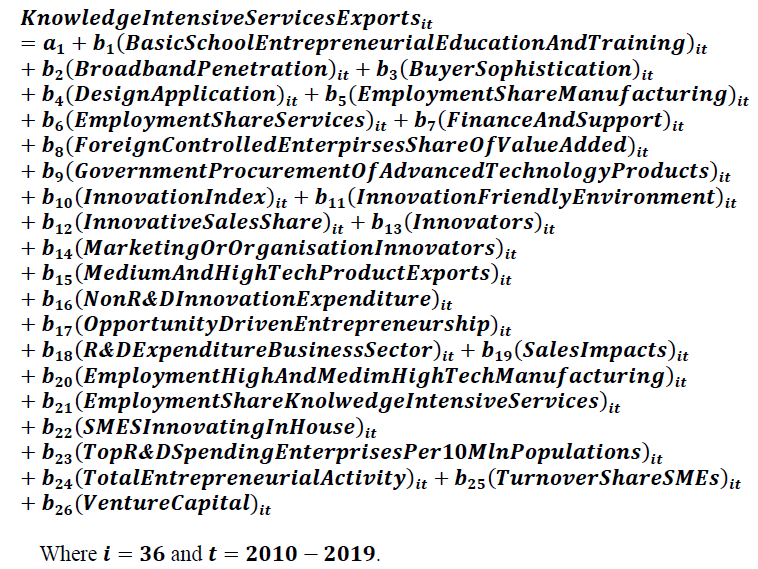
It appears that the value of "Knowledge Intensive Services Exports" is positively associated with the following variables, namely:
1. Broadband Penetration: is a variable made up of the ratio between the number of companies that have a maximum download speed of at least 100 mb / s and the total number of companies. This variable therefore takes into consideration the ability of companies to use the internet to carry out their internal and external activities. For example, the possibility of setting up an e-commerce system essentially depends on the possibility of having a fast internet. There is therefore a positive relationship between broadband penetration and the performance of countries for export capacity of knowledge-intensive services. In fact, in countries where there is a greater digital culture, there is also a greater presence of internet networks and greater attention to internet connection issues. It follows that these companies can also provide services through the cloud and positively orient themselves towards offering even complex services by optimizing the digital economy (Leogrande et al., 2021).
2. Opportunity Driven Entrepreneurship: is an indicator that considers the difference between entrepreneurs who follow market opportunities and entrepreneurs who exercise their profession to meet the needs of existence. That is, entrepreneurs by opportunity declare that they have chosen their business with a greater degree of freedom than entrepreneurs by necessity. Therefore, entrepreneurs for opportunity can be considered as more oriented to experiment with new technologies, and to invest in innovative sectors than entrepreneurs by necessity who often operate in more traditional sectors of economic activity. There is therefore a positive relationship between the presence of opportunity-driven entrepreneurs and the export of knowledge-intensive services. In fact, entrepreneurs who can seize the opportunities of the market generally also have greater opportunities to invest in innovative sectors such as those related to knowledge-intensive services. In fact, these entrepreneurs are generally not only interested in profit, but rather express curiosity and willingness to invest in highly competitive high-tech sectors.
3. Venture Capital: takes into consideration the value of the investment expenses in the equity of the companies made by the Venture Capital firms. This investment includes risk capital in the initial start-up phase of economic activity. The value of the venture capital investment is related to the gross domestic product. For companies that carry out technological innovation and research and development activities, the possibility of financing themselves through venture capital is the only real opportunity for growth and affirmation in the sector. The analysis therefore shows the presence of a positive relationship between the investment in the risk capital of companies and the presence of companies exporting knowledge-intensive services abroad. In fact, these two elements could be closely connected, since generally start-ups, especially when they produce innovative services, also have a very significant orientation towards exports (Leogrande et al., 2021).
4. Top R&D spending enterprises per 10 mln population: is an indicator that considers the R&D expenditure of the 2,500 largest companies in the world compared to the population of the country in which they are based. This indicator therefore considers the expenditure on research and development of the top corporations and therefore includes very significant volumes of expenditure within it. In fact, notoriously, large, and very large companies tend to have a very high expenditure on research and development, especially when they operate in the mechanical, pharmaceutical, IT and primary sectors. It follows therefore that a significant part of technological innovation, research and development and industrial patents is produced precisely by medium and large companies. There is therefore a positive relationship between investment in research and development by large companies and the export of knowledge-intensive services. In fact, many of these companies operate precisely in the knowledge-intensive services sector, such as in the ICT sector (Leogrande et al., 2020)
5. Basic-school entrepreneurial education and training: takes into account the value of entrepreneurial education in basic school. That is, consider whether there are courses relating to the creation and management of SMEs in the basic education system. The presence of business training courses within the basic school can be a positive element for increasing the capacity of human capital to carry out business activities, especially in the context of new digitalization technologies. There is therefore a positive relationship between the presence of entrepreneurship training courses in schools and the presence of companies that can export knowledge-intensive services. This positive relationship appears to be linked above all to the fact that in countries where there is a greater entrepreneurial culture it is also easier to find companies that easily export. And especially if the entrepreneurial culture is connected to technological innovation, then it is even more likely that the number of companies exporting knowledge-intensive services will be increased.
6. Marketing or organisational innovators: is a variable that takes into consideration the SMEs that introduce marketing or organizational innovations on the total number of SMEs at country level. By organizational innovation we mean a change in the organizational method of the company, in commercial practices, in the organization of work. By marketing innovations, we mean the implementation of new marketing methods compared to those previously used. This marketing or organizational innovation is typical of SMEs operating in the service sectors or in highly competitive sectors where the entrepreneur lacks the possibility of setting up a real research and development department within the company due to lack of economic and financial resources. Companies then compensate for these shortcomings using marketing or organizational innovations which, although representing a growth of the company from the point of view of productivity and competitiveness, do not act in the depth of innovation of the products and services offered. In any case, there is a positive relationship between the presence of companies that operate organizational and marketing innovations and the export of knowledge-intensive services.
7. SMEs innovating in-house: is a variable that takes into consideration the percentage of SMEs that innovate internally compared to the total number of SMEs at country level. In this case, companies that innovate are considered companies that have introduced product or service innovations using internal resources or in collaboration with other companies and organizations, for example in the context of open innovation dynamics. This indicator only takes into consideration SMEs as it is almost obvious for large and medium-sized enterprises to have internal structures aimed at product and service innovation. There is therefore a positive relationship between the SMEs that operate in-house technological innovations and the export of highly knowledgeable services. This relationship indicates that in the contexts of countries that are overall oriented towards technological innovation, there is a greater willingness to produce complex services from the point of view of knowledge and to orient these productions towards exports (Costantiello et al., 2021).
8. Employment Share Services: is a variable that considers the occupancy rate of the services. Obviously, in countries where employment in services is higher, there is also a greater probability that the production of services that can also be aimed at exports will be determined. Obviously, there are some European countries that have an economy that is more oriented towards the service sector. Indeed, there is greater compatibility between the knowledge economy and the service economy. Indeed, the knowledge economy tends to be generally associated with the production of services and the dimension of intangible assets. In this sense, it is necessary to ensure that even the economies of the less developed areas of Europe, i.e. the economy of Southern and Eastern Europe, are able to orient themselves more and more effectively towards the knowledge economy by orienting themselves towards the export of services (Costantiello & Leogrande, 2021).
9. Foreign-controlled enterprises – share of value added: is the percentage of enterprises that are controlled from abroad. It is a variable that considers the added value produced by companies having foreign parent companies. That is, in this case we mean companies that are controlled by companies resident in a country other than the one in which the production plant is based. There is therefore a positive relationship between the presence of companies that have a parent company abroad and the ability to export knowledge-intensive services. This positive relationship can be better understood considering that if a country has branches of companies with foreign parent companies, it means that the production system is competitive. And generally, the presence of greater competitiveness is also positively associated with the presence of an orientation towards exports. Therefore, this relationship must be understood as recognition of the presence of a productive-competitive capacity in a given country that generates positive externalities in terms of production of high quality services.
10. Share High and Medium high-tech manufacturing: is the percentage of employment in a number of sectors that are related to manufacturing, especially of medium-high level, as a percentage of manufacturing employment. This category includes the production of pharmaceutical products, computers, spacecraft, chemical products, electrical material, motor vehicles, trailers, medical-dental instruments, and supplies. There is therefore a positive relationship between the presence of employment in the high-tech sectors and the presence of companies exporting knowledge-intensive services abroad. This positive relationship is since where there is a more trained and evolved human capital, it is also possible to create more complex products from a technological point of view that can easily also be effectively sold abroad.
11. Employment share Manufacturing: represents the share of employment in the manufacturing sector as a percentage of total employment. There is a positive relationship between the presence of employment in the manufacturing sector and the export of high-knowledge services abroad. This relationship is since generally the countries that have a manufacturing production also have large and medium-sized enterprises and invest more easily in research and development. This results in a structural improvement in the formation of human capital and the possibility of positively orienting the economy towards technological innovation. In fact, manufacturing companies are generally very favorable to both process and product innovations. A favorable environment for technological innovation is therefore created, which is well connected to the possibility of generating high-knowledge services aimed at exports (Laureti et al., 2022).
12. Innovation index: is the composite indicator that calculates the degree of innovation of the countries. There is a positive relationship between the value of the Novation Index and the ability of companies to export high intensity services. This report obviously derives from the fact that countries that have more raised levels of Innovation Index have also greater ability to accumulate intangible goods, knowledge, and technologies capable of producing complex products and services. In addition, the countries that have a higher level of the most infection Index are also those that have the greatest possibility of increasing productivity, and generally greater productivity is positively associated with an export orientation. It therefore follows that if the countries want to increase the percentage of services that come to be exported, they must improve the investment in creating a model of virtuous technological innovation (Leogrande et al., 2022).
13. Sales impacts: is a variable made up of three different sub-variables: "Medium and High Tech product Exports", "Knowledge Intensive Services Exports", "Sales of New or Improved Products". There is therefore a positive relationship between the value of the "Sales Impact" variable and the value of exports of services with a high level of knowledge. This positive relationship derives from the fact that if companies have a greater chance of implementing technological innovation processes, then they also have a greater chance of obtaining a more positive impact in terms of sales. It follows therefore that technological innovation is not only a tool through which it is possible to make investments capable of increasing productivity, but rather it is a tool that allows companies to significantly orientate the export of products thanks to the increase in cognitive content (Costantiello et al., 2021).
14. Total Entrepreneurial Activity (TEA): is the percentage of the population aged 18 to 64 who is an entrepreneur or manager of a new business. There is a positive relationship between the export of knowledge-intensive services and the presence of a significant orientation towards entrepreneurship. This relationship indicates that indeed entrepreneurship necessarily tends to be associated with a positive orientation towards technological innovation. Specifically, the possibility of making investments in business activities generates greater attention to technological innovation. Therefore, the growth of entrepreneurship widespread among the population generates a greater orientation towards technological innovation and therefore also towards the creation of products to be exported with a greater content of knowledge Table 1.
| Table 1 Results Of The Econometric Models For The Estimation Of Knowledge Intensive Services Exports |
||||||||
|---|---|---|---|---|---|---|---|---|
| Results of the econometric models for the estimation of Knowledge Intensive Services Exports | ||||||||
| Variable | Label | Pooled OLS | Dynamic Panel | Fixed Effects | Random Effects | WLS | ||
| y | nowledge-intensive services exports | A31 | Coefficient and P-Value |
Coefficient and P-Value | Coefficient and P-Value | Coefficient and P-Value | Coefficient and P-Value | Mean |
| const | 0,4330760 | -0,4751910 | 0,4002470 | 0,4007080 | 0,3445580 | 0,2206796 | ||
| x1 | Basic-school entrepreneurial education and training | A4 | 0,1901740 *** |
0,1331700 *** | 0,1756410 *** | 0,1830430 *** | 0,1846820 *** | 0,1733420 |
| x2 | Broadband penetration | A5 | 0,0341978 ** |
0,0607148 ** | 0,0408227 *** | 0,0394838 *** | 0,0433126 *** | 0,0437063 |
| x3 | Buyer sophistication | A6 | -9,1639000 *** |
-5,4219600 *** | -7,4523600 *** | -8,3427800 *** | -8,3451100 *** | -7,7452220 |
| x4 | Design applications | A7 | -0,0855627 *** |
-0,0760514 ** | -0,0922210 *** | -0,0963910 *** | -0,0836208 *** | -0,0867694 |
| x5 | Employment share Manufacturing | A12 | 0,6576250 *** |
0,4456630 *** | 0,6715190 *** | 0,6573280 *** | 0,5691140 *** | 0,6002498 |
| x6 | Employment share Services | A13 | 0,3876680 ** |
0,3042620 *** | 0,3523260 ** | 0,3889100 *** | 0,4175030 *** | 0,3701338 |
| x7 | Finance and support | A17 | -0,3324160 *** |
-0,2468650 *** | -0,2154960 *** | -0,2556000 *** | -0,2892440 *** | -0,2679242 |
| x8 | Foreign-controlled enterprises – share of value added | A20 | 0,4862150 *** |
0,2048030 * |
0,3327430 *** | 0,3972060 *** | 0,4946820 *** | 0,3831298 |
| x9 | Government procurement of advanced technology products | A22 | -0,7319580 *** |
-0,7348840 *** | -0,8211370 *** | -0,8323110 *** | -0,7868030 *** | -0,7814186 |
| x10 | Innovation index | A24 | 0,8203120 *** |
0,9608050 *** | 0,9387330 *** | 0,9351980 *** | 0,8891470 *** | 0,9088390 |
| x11 | Innovation-friendly environment | A25 | -0,1181130 *** |
-0,1511490 *** | -0,1126280 *** | -0,1198010 *** | -0,1156760 *** | -0,1234734 |
| x12 | Innovative sales share | A26 | -0,3349350 *** |
-0,3083760 *** | -0,2594560 *** | -0,2817860 *** | -0,3096820 *** | -0,2988470 |
| x13 | Innovators | A28 | -0,3671140 *** |
-0,3816090 *** | -0,3446000 *** | -0,3531700 *** | -0,3843130 *** | -0,3661612 |
| x14 | Marketing or organisational innovators | A34 | 0,2439460 *** |
0,1687400 *** | 0,1499110 *** | 0,1745700 *** | 0,2955550 *** | 0,2065444 |
| x15 | Medium and high-tech product exports | A35 | -0,3874670 *** |
-0,2756130 *** | -0,2395340 *** | -0,2806480 *** | -0,3479460 *** | -0,3062416 |
| x16 | Non-R&D innovation expenditure | A38 | -0,0762908 *** |
-0,0500949 * |
-0,0704590 *** | -0,0771681 *** | -0,0714463 *** | -0,0690918 |
| x17 | Opportunity-driven entrepreneurship | A39 | 0,1261580 *** |
0,0817059 ** |
0,0782623 *** | 0,0913880 *** | 0,1051250 *** | 0,0965278 |
| x18 | R&D expenditure business sector | A46 | -0,0908626 *** |
-0,1489080 *** | -0,1205700 *** | -0,1138950 *** | -0,1344580 *** | -0,1217387 |
| x19 | Sales impacts | A49 | 1,0721000 *** |
0,9243330 *** | 0,7998310 *** | 0,8657840 *** |
0,9673800 *** | 0,9258856 |
| x20 | Share High and Medium high-tech manufacturing | A50 | 0,7607680 *** |
0,4873320 *** | 0,3983400 *** | 0,4910200 *** | 0,6075210 *** | 0,5489962 |
| x21 | Share Knowledge-intensive services (%) | A51 | -0,4559690 ** |
-0,4544820 *** | -0,3448970 ** | -0,3724290 ** | -0,5058660 *** | -0,4267286 |
| x22 | SMEs innovating in-house | A52 | 0,2354200 *** |
0,2255820 *** | 0,2196510 *** | 0,2279210 *** | 0,2112150 *** | 0,2239578 |
| x23 | Top R&D spending enterprises per 10 mln population | A54 | 0,1585310 *** |
0,0907988 *** | 0,1208270 *** | 0,1291190 *** | 0,1354480 *** | 0,1269448 |
| x24 | Total Entrepreneurial Activity (TEA) | A55 | 1,9016800 *** |
0,4743400 ** |
1,1719200 *** | 1,4122300 *** | 1,4859900 *** | 1,2892320 |
| x25 | Turnover share SMEs | A58 | -0,5767290 *** |
-0,1281360 * |
-0,3375900 *** | -0,3933190 *** | -0,3888460 *** | -0,3649240 |
| x26 | Venture capital | A59 | 0,1231960 *** |
0,0942134 *** | 0,0782682 *** | 0,0941878 *** | 0,0942569 *** | 0,0968245 |
| x27 | Knowledge-intensive services exports | A31(-1) | 0,0395974 | 0,0395974 | ||||
Furthermore, it appears that "Knowledge Intensive Services Exports" is negatively associated with the following variables, namely:
1. Buyer sophistication: it is an indicator that considers the degree of sophistication of the buyer or the consumer's ability to grasp the innovativeness of the product he buys. There is therefore a negative relationship between the degree of sophistication of the consumer and the level of export of knowledge-intensive services. It follows therefore that where the degree of sophistication of the buyer increases, exports of knowledge-intensive services tend to decrease. This reduction is since the internal market for knowledge-intensive services is indeed very high in these countries. In the presence of a highly developed internal market, it is likely that companies will have less economic advantage in exporting high-intensity services.
2. Government procurement of advanced technology products: is an indicator that considers the state's ability to promote technological innovation. There is a negative relationship between the value of public demand for technological innovation and the export of knowledge-intensive services. This relationship may appear paradoxical since obviously if a country has a demand for high-level technological products, then technological innovation should increase and therefore exports of highly knowledge-based services should also increase. However, countries that have high levels of exports of high knowledge services have a very significant orientation towards the market and less dependence on the state. It follows that it is the countries with low technological innovation that tend to have a more pronounced state intervention with the aim of developing innovation on a national basis.
3. Share Knowledge-intensive services: is a variable that considers the percentage of employed in knowledge-intensive services. Paradoxically, there is a negative relationship between the value of employees in knowledge-intensive services and the export of knowledge-intensive services. This relationship may be since in countries where there is a growing share of employment in the knowledge-intensive service sector there is also a more developed internal market.
4. Innovators: is a variable that considers the sum of two different types of companies or the percentage of companies that implement product innovations and the percentage of companies that promote business process innovations. This variable is negatively associated with the export of services with a high concentration of knowledge. This relationship can be better understood by considering that the countries that have a high number of innovators are also the countries that have a higher level of production of knowledge economy. And yet these countries have a low level of export of knowledge-intensive products. That is, countries that are exporters of knowledge services are generally not the most innovative products, as the latter tend to attract - or import - knowledge rather than export it. Countries that have a high level of knowledge tend to maintain this level and increase it for further technological innovation (Leogrande et al., 2022).
5. Turnover share SMEs: is the value of the turnover in companies that employ between 10 and 249 people. It follows that where small and medium-sized companies are present the export value of knowledge-intensive services tends to be increasing. This relationship can be better understood considering that small and medium-sized enterprises tend to be generally oriented towards internal markets and do not necessarily have the possibility of accumulating knowledge to be able to export high value-added services. In fact, for there to be a growth in the knowledge economy, especially in the sense of the economy of technological innovation, it is necessary that there are large companies capable of investing in Research and Development, developing, including through patents, of new services to export. In fact, the possibility of small and medium-sized enterprises to significantly innovate the reference market by orienting themselves towards the export of services tends to be lower than the corresponding capacity of medium-large enterprises.
6. Medium and high-tech product exports: is a value that considers the relationship between the exports of medium and high technology and the value of the total exports of products. It is therefore the percentage of exports of medium and high technology products. There is therefore a negative relationship between the export value of medium and high technology products and the export value of high knowledge services. It is therefore necessary to consider that there is a sort of contrast between the export of medium and high-tech products and services with a high content of knowledge. Countries that tend to export technology products may not be able to generate as many exports of technology services. This zero-sum game could also be due to a specialization of countries at the international level. That is, the countries that exported high-tech goods could have significant manufacturing components in the GDP unlike the countries that export services that are more oriented to the economy of knowledge, innovation and in a broad sense to the production of intangibles.
7. Innovative sales share: is a value that takes into consideration the value of the turnover that comes from new or improved products as a percentage of the total turnover of all company. There is a negative relationship between the growth of turnover deriving from product innovations and the growth of exporting high -knowledge services. This report suggests the existence of a sort of contrast between the efficiency obtained in improving products and the ability to export services with high knowledge content. In this sense, it should be considered that innovative companies, or companies that innovate the products, are generally oriented to export. However, the export of innovative products and the export of high cognitive services are therefore basically opposed. This phenomenon could be traced back to a principle of productive specialization in international markets or to the fact that if a country specializes in the innovation of products and in the export of innovative products it is generally not specializing in the export of high knowledge content services
8. Finance and support: is a composite variable consisting of “R&D Expenditure public sector as% of GDP”, “Venture Capital Expenditure as% of GDP”, “Direct Government Funding and Government Tax Support for Business R&D”. There is therefore a nefarious relationship between the presence of a public and private financing system for technological innovation and the ability of companies to export services with a high content of knowledge. It therefore follows those systems that are effectively efficient in financing technological innovation have a more relevant level of technological innovation and generally tend to have a much wider internal market for knowledge-intensive services than markets with a low level of financing. Of innovation. It follows therefore that countries that invest significantly in technological innovation tend to “preserve” or even import knowledge and innovation rather than export (Laureti et al., 2020).
9. Innovation-friendly environment: is a variable made up of two sub-variables namely “Broadband Penetration” and “Opportunity-Driven Entrepreneurship”. This variable therefore considers two elements, namely the possibility of using broadband and the ability of entrepreneurs to follow the business opportunities offered by technological innovation and digitization. There is therefore a negative relationship between the presence of an innovation friendly environment and the ability of companies to export services with a high content of knowledge. This relationship can be understood considering, as also done for the previous points, that countries that have higher levels of technological innovation tend to preserve and perhaps even import knowledge and technological innovation rather than export it. In fact, the export of highly knowledgeable services can only be achieved in those countries that have a high capacity for innovation and are able to make these services useful for the production and creation of national added value (Costantiello et al., 2021).
10. R&D expenditure business sector: is a variable that considers R&D expenditure in the private sector as a percentage of GDP. This indicator captures the ability of companies to create new knowledge in companies in industrial sectors significantly connected with scientific and technological development. It should be considered that this variable is negatively associated with the export of knowledge-intensive services. This negative relationship appears to be since research and development in the private sector tends to be aimed essentially at the innovation of products and processes and not also at the development of innovation in the service sector. In this sense it is necessary to consider a certain backwardness of the countries of the European Union in the development of real systems of tertiarization of the economy oriented to the production of intangible goods.
11. Design applications: is a variable that consisting in the request for recognition of intellectual property against the European Intellectual Property Office. There is a negative relationship with design application development and exports of knowledge-intensive services. This relationship appears to be counterfactual. However, it seems to confirm the idea, as well as in the description of the previous variables, that the presence of elements of significant innovation at the country level is not necessarily associated with the export of knowledge-intensive services (Leogrande et al., 2021).
12. Non-R&D innovation expenditure: considers the investment in technological innovation of companies net of Research and Development. This variable is negatively associated with the export of knowledge-intensive services. This negative relationship can be traced back to the fact that most of the technological innovations that are made at European level and refer more to the production of products than to the production of services. The orientation towards the development of technologically advanced services, such as for example cloud services, artificial intelligence, appears to be reduced compared to the traditional orientation of the European economy which is essentially aimed at the export of innovative products in industrial sectors. Heavy, pharmaceutical, and manufacturing industries.
Clusterization with k-Means algorithm and Elbow Method
Below was a clusterization using the K-means algorithm optimized through the Elbow method. The result shows the presence of the following clusters:
1. Cluster 1: Croatia, Lithuania, Montenegro, Bosnia and Herzegovina, North Macedonia, Spain, Malta, Turkey, Slovenia, Slovakia;
2. Cluster 2: Netherlands, Norway, Germany, Sweden, United Kingdom, Denmark, Finland, Luxembourg, Belgium, Ireland, Cyprus, Israel, France;
3. Cluster 3: Hungary, Estonia, Latvia, Ukraine, Italy, Serbia, Romania, Austria, Greece, Czechia, Portugal, Poland, Iceland, Bulgaria.
Considering the median of the Clusters appears that the median value of exporting high intensity services of knowledge is possible to identify an order of the Clusters. Specifically, the median value in the value of C2=124.36>C3>67.68 >C1=29.22. From a strictly geographical point of view, the presence of a contrast between the countries of the central-northern Europe is evident which have a high value of the export of high-intensity services and the countries of southern Europe that have low values. In this sense, the countries of Northern Europe have a ability to export high -intensity services equal to 4 times higher than the countries of southern Europe. It is evidently a gap that reflects the diversity of industrial systems, innovation, and the development of human capital. While in fact the European countries of the North reuse can export high -intensity services, the countries of Southern Europe seem to be without this possibility. This difference in performance is a manifestation of a wider distinction relating to the development of the economy of knowledge. In fact, in the countries of southern Europe in general the spread of the economy of knowledge is reduced compared to the corresponding value of the countries of northern Europe Figure 1.

Figure 1: Clusterization Using K-Means Algorithm Optimized With The Elbow Method.
European policy makers must therefore introduce economic policies to remove the gap between north and southern Europe in terms of export of high -tech services. In fact, this variable highlights the difference between north and southern Europe in terms of productivity. In fact, the companies that export the most are also the most productive companies. And therefore, to reduce the gap between north and south Europe it is necessary to act on the following variables or:
1. Human capital: increasing human capital is the essential element for accessing the economy of knowledge. In fact, the possibility of activating technological and development innovation processes evidently derives from the presence of a human capital adequately formed especially in the STEM disciplines and capable of applying this technical-scientific knowledge to the production of added value in companies;
2. Productivity: Southern Europe companies tend to be substantially less productive than in Northern Europe companies. This lower productivity is due to a set of inefficiencies that can be traced back to both typical aspects of the corporate organization and for reasons that are of an institutional and regulatory type. Specifically in SMEs, widespread in southern Europe, it can be very difficult to introduce the division of work and therefore often these companies give up the economic and productive advantages connected to the best organization of work. Furthermore, the presence of tax regulations that tax the work very much has a negative impact on the productivity of companies. Finally, there is a problem of using technology: southern Europe companies tend to be less efficient in implementing new technologies.
Investment in human capital and orientation to greater productivity could allow to create the foundations for growth in exports of high knowledge of knowledge in southern Europe by converging on the highest levels of Northern Europe.
Network Analysis with Manhattan Distance
A network analysis was later created using Manhattan distance method aimed at identifying relationships between countries in the historical series dynamics of data relating to the export of high -intensity services. Four structures have been identified with complex networks, that is, consisting of more than two elements in the network, and three simplified network structures, that is, consisting of 2 network connections.
Complex networks
In the model identified there are four structures with complex networks. There is a complex network structure between Belgium, Switzerland and Israel which has the following characteristics:
1. Switzerland has a link with Belgium equal to a value of 0.19 and vice versa;
2. Switzerland has a link with Israel equal to a value of 0.26 and vice versa;
There is a complex network structure between Poland, the Czech Republic, Romania, and Austria. Particularly:
1. Poland is connected to the Czech Republic with a value of 0.23;
2. The Czech Republic is connected to Romania with a value equal to 0.18, in Poland with a value of 0.23, and to Austria with a value of 0.21;
3. Romania is connected to the Czech Republic with a link equal to 0.18, and to Austria with a value of 0.21;
4. Austria is connected to Romania with a link having a value of 0.21, and to the Czech Republic with a value of 0.21.
There is a complex structure between Greece, Italy, Latvia, Hungary, Ukrainian, Estonia and Serbia. Particularly:
1. Greece is connected to Italy with a link having a value of 0.2;
2. Italy is connected to Greece with a link having a value of 0.2, and to Latvia with a value of 0.23, and to Hungary with an amount equal to 0.24;
3. Latvia is associated with Italy with a value of 0.23, in Hungary with a value of 0.17;
4. Hungary is associated with Latvia with a value equal to 0.17, and Italy with a value of 0.24, m to Ukraine with a value of 0.26 and toon with an equal value at 0.21;
5. Ukraine is connected to Hungary with a value of 0.16, and to Estonia with a value of 0.22.
6. Estonia is connected to Hungary with a link having a value of 0.21, Ukraine with a value of 0.22 and Serbia with a link having a value of 0.17.
7. Serbia has a connection with Estonia with a value of 0.17.
There is a complex structure between Bosnia and Herzegovina, Croatia, Montenegro, and Lithuania. Particularly:
1. Bosnia is associated with Croatia with a link equal to a value of 0.16, Montenegro with a link value of 0.1 and Lithuania with a value of 0.23;
2. Croatia is associated with Bosnia with a link having a value of 0.16, with Lithuania with a value of 0.19 and Montenegro with a value of 0.12;
3. Montenegro is associated with Croatia with a link having a value of 0.12, Lithuania with a value of 0.23, to Bosnia with a value of 0.1;
4. Lithuania is associated with Bosnia with a value of 0.23, Croatia with a value of 0.19, and Montenegro with an equal value 0.23.
Simple Network. There are also three simple network structures or consisting of biunivocal relationships indicated below:
1. There is a biunivocal network relationship between Germany and Sweden having a value of 0.18;
2. There is a simplified network relationship between the Netherlands and Norway having a value of 0.22;
3. There is a relationship with simplified network between Slovenia and Slovakia having a value of 0.23.
It should be considered that these relationships do not highlight the relationships of the cause and effect in the determination of nations that have different levels of exporting high -intensity services. These are more than anything else that exist in the structure of data and that identify common trends between the countries connected in network structures Figure 2.

Figure 2:The Structure Of Networks Revealed With Manhattan Distance.
Machine Learning and Prediction with Original Data
Below is a comparison between eight different Machine Learning algorithms for the prediction of the future value of exporting high -intensity services produced in European countries. In particular, the algorithms were selected based on their performance capacity compared to some significant statistical quantities or "R-Squared", "Mean Absolute Error", "Mean Squared Error" and "Root Mean Squared Error". The algorithms were trained with 70% of the data while the remaining 30% was used for the actual prediction Figure 3.

Figure 3:Ranking Of Algorithms In The Sense Of Predictive Performance.
The results show the presence of the following order in the sense of performance in prediction Figure 4:

Figure 4:Statistical Errors Of The Machine Learning Algorithms For The Prediction Of Knowledge Intensive Services.
1. Linear Regression with a payoff value of 4;
2. Random Forest Regression with a payoff value of 8;
3. PNN-Probabilistic Neural Network with a payoff value of 13;
4. Polynomial Regression with a payoff value of 15;
5. ANN-Artificial Neural Network with a payoff value of 20;
6. Simple Regression Tree with a payoff value of 25;
7. Tree Regression Ensemble with a payoff value of 27;
8. Gradient Boosted Trees Regression with a payoff value of 32.
Therefore, by applying the best performing algorithm or the Linear Regression Algorithm it is possible to predict the following variations in the export value of knowledge-intensive services, namely:
1. Austria with an increase from an amount of 59.516 units up to a value of 58.661 units or equal to a change of -0.855 units equal to a change equal to an amount of -1.4%;
2. Bosnia and Herzegovina with an increase from an amount of 1.72 units up to a value of 2.361 units or a change equal to an amount of 0.637 units equal to an amount of 36.949%;
3. Belgium with a decrease from an amount of 115.07 units up to a value of 114.943 units equal to a variation of -0.125 units equal to a value of -0.109%;
4. Bulgaria with a decrease from an amount of 57.931 units up to a value of 51.56 units or equal to a variation of -6.371 units equal to an amount of 10.998%;
5. Switzerland with an increase from an amount of 107.17 to 108.249 units or equal to a value of 1.076 units equal to a value of 1.004%;
6. Cyprus with a decrease from an amount of 112.82 units equal to a value of 102.267 units or equal to a change of -10.548 units equal to a value of -9.350%;
7. Czech Republic with a decrease from an amount of 57.668 units up to a value of 56.92 units or equal to a variation of -0.748 units equal to a variation of -1.297%;
8. Germany with an increase from an amount of 121.006 units up to a value of 121.578 units or equal to a variation of 0.572 units equal to a variation of 0.473%;
9. Denmark with a decrease from an amount of 121.27 units up to a value of 108.11 units or equal to a variation of -13.156 units equal to a variation of -10.849%;
10. Estonia with a decrease from an amount of 73.059 units up to a value of 68.41 units or equal to a variation of -4.649 units equal to a value of -6.363%;
11. Greece with an increase from an amount of 71.905 units up to a value of 76.653 units or equal to a variation of 4.748 units equal to a variation of 6.603%;
12. Spain with a decrease from a value equal to 29.624 units up to a value of 28.738 units or equal to a variation of -0.886 units equal to an amount of -2.991%;
13. Finland with a decrease from an amount of 127.449 units up to a value of 125.303 units or equal to a variation of -2.146 units equal to an amount of -1.684%;
14. France with an increase from an amount of 96,226 units up to a value of 99,603 units or equal to an amount of 3,337 units equal to an amount of 3.446%;
15. Croatia with a decrease from an amount of 7.947 units up to an amount of 7.485 units or equal to a change of -0.462 units equal to an amount of -5.814%;
16. Hungary with a decrease from an amount of 72.024 units up to a value of 71.771 units or equal to an amount of -0.253 units equal to an amount of -0.351%;
17. Ireland with an increase from an amount of 161.06 units up to an amount of 161.901 units or equal to a change of 0.843 units equal to an amount of 0.523%;
18. Israel with an increase from an amount of 108.951 units up to a value of 110.901 units or equal to an amount of 1.950 units equal to an amount of 1.790%;
19. Iceland with a change from an amount of 72,462 units up to an amount of 78,668 units or equal to an amount of 6,206 units equal to an amount of 8.564%;
20. Italy with an increased variation from an amount of 65.452 units up to an amount of 68,835 units or equal to an amount of 3,383 units or equal to a value of 5.169%;
21. Lithuania with a diminutive variation from an amount of 4,635 units up to a value of 3.814 units or equal to a variation of -0.821 units equal to an amount of -17.713%;
22. Luxembourg with a diminutive variation from an amount of 157,428 units up to a value of 157.040 units or equal to a value of -0.388 units or equal to a variation of -0.246%;
23. Latvia with a diminutive variation from an amount of 74.844 units up to a value of 72,731 units or equal to an amount of -2.113 units equal to a value of -2.823%;
24. Montenegro with an increased variation from an amount of 2.965 units up to a value of 3.998 units or equal to a variation of 1.033 units or equal to an amount of 34.840%;
25. North Macedonia with a diminutive variation from an amount of 28,818 units up to a value of 27.555 units or equal to a variation -1,263 units equal to an amount of -4.383%;
26. Malta with an increased variation from an amount of 31,895 units up to a value of 37,409 units or equal to a variation of 5.514 units equal to a variation of 17.28%;
27. Netherlands with a diminutive variation from an amount of 133,256 units up to a value of 132.917 units or equal to a variation of -0.339 units equal to an amount of -0.254%;:
28. Norway with an increased variation from an amount of 128,269 units up to a value of 130.483 units or equal to a variation of 2.214 units equal to a value of 1.726%;
29. Poland with a diminutive variation from an amount of 57,046 units up to a value of 53,242 units or equal to an amount of -3,804 units equal to a value of -6.668%;
30. Portugal with an increased variation from an amount of 39,627 units up to a value of 43,244 units or equal to an amount of 3.617 units equal to an amount of 9.128%;
31. Romania with a diminutive variation from an amount of 64.880 units up to a value of 61.964 units or equal to a value of -2.916 units equal to a value of -4.494%;
32. Serbia with an increased variation from an amount of 71.792 units up to a value of 71.968 units or equal to a value of 0.176 units equal to an amount of 0.245%;
33. Sweden with an increased variation from an amount of 127,743 units up to a value of 132,210 units or equal to a variation of 4.467 units equal to an amount of 3.497%;
34. Slovenia with an increased variation from a value of 35.576 units up to a value of 36.935 units or equal to a value of 1.359 units equal to an amount of 3.821%;
35. Slovakia with an increased variation from an amount of 44.141 units up to a value of 46.303 units or equal to a variation of 2.162 units equal to an amount of 4.898%;
36. Turkey with a diminutive variation from an amount of 43,902 units up to a value of 41.012 units or equal to a variation of -2.890 units equal to an amount of -6.583%;
37. Ukraine with an increased variation from an amount of 69,898 units up to a value of 76.061 units or equal to an amount of 6.163 units equal to an amount of 8.817%;
38. UK with an increased variation from an amount of 135.162 units up to a value of 140.656 units or equal to a variation of 5.494 units equal to an amount of 4.065%.
On average, the value of high-intensity service exports is predicted to grow from an amount of 76.112 units up to a value of 76.117 units or equal to a variation of 0.006 units equal to a value of 0.008% Figure 5.

Figure 5:Prediction Of The Values Based On The Application Of The Best Performing Algorithm: The Linear Regression Algorithm.
Machine Learning per Prediction with Augmented Data
The data obtained by the predictions were reinserted within the dataset by creating a new dataset containing the prediction data in the dataset. The algorithms were compared in terms of performance with the same criteria indicated in the previous paragraph in terms of learning rate, R-squared and statistical errors. Therefore, the following ranking of the algorithms in terms of performance is derived Figure 6, that is:

Figure 6:Prediction With Augmented Data Using Linear Regression Algorithm.
1. Linear Regression with a payoff equal to 4;
2. Polynomial Regression with a payoff equal to 8;
3. Random Forest Regression with a payoff equal to 12;
4. Gradient Boosted Trees with a payoff equal to 17;
5. Tree Ensemble Regression with a payoff equal to 22;
6. Simple Regression Tree with a payoff equal to 23;
7. ANN-Artificial Neural Network with a payoff equal to 26;
8. PNN-Probabilistic Neural Network with a payoff equal to 32.
Therefore using the best performer algorithm or the linear regression for prediction are the following values for the countries indicated or:
1. Switzerland with an increased variation from an amount of 108.249 up to a variation of 109.250 or equal to a variation of 1.001 units equal to an amount of 0.925%;
2. Czech Republic with a diminutive variation from an amount of 56.920 units up to a value of 55.724 units or equal to a variation of -1.196 units equal to an amount of -2.101%;
3. Germany with a diminutive variation from an amount of 121.578 units up to a variation of 120.406 units or equal to an amount of -1.172 units equal to a value of -0.964%;
4. Greece with an increased variation from an amount of 76,653 units up to a value of 77,160 units or equal to an amount of 0.507 units equal to an amount of 0.661%;
5. Spain with a diminutive variation from an amount of 28,738 units up to a value of 26,868 units or equal to a variation of -1.870 units equal to a value of -6.507%;
6. France with an increased variation from an amount of 99,603 units up to a valor Edi 100,261 units or equal to an amount of 0.658 units equal to a value of 0.661%;
7. Hungary with a diminutive variation from an amount of 71,771 units up to a value of 70.517 units or equal to a value of -1.254 units equal to an amount of -1.747%;
8. Ireland with an increased variation from a value of 161,901 units up to a value of 162,676 units or open to a variation of 0.775 units equal to a variation of 0.479%;
9. Israel with a diminutive variation from an amount of 110,901 units up to a value of 108,280 units or equal to a variation of -2.6 units equal to an amount of -2.36%;
10. Malta with a diminutive variation from an amount of 37,409 units up to a value of 36.994 units or equal to a variation of -0.415 units equal to an amount of -1.109%;
11. Norway with a variation from an amount of 130.483 units up to a value of 132.708 units or equal to a variation of 2.225 units equal to an amount of 1.705%;
12. Slovenia with a diminutive variation from an amount of 36.935 units up to a value of 35,206 units or equal to a variation of -1.729 units equal to an amount of -4.681%.
Overall, the value of the export of high -intensity services is predicted in decrease for the countries considered by an average value of 86.762 units up to a value of 86,338 units or equal to a variation of -0.424 units equal to a value of - 12.54% Figure 7.

Figure 7:Statistical Results Of Machine Learning Algorithms With Augmented Data.
Finally, comparing the results of the prediction with the best algorithm with the original data and the best algorithm with the Augmented Data is a worsening of the R-Squared and an improvement in statistical errors. In particular, the following variations are evident:
1. R-Squared: In the transition from analysis with the Original Data-OD to analysis with the Augmented Data-AD, 0.28%worsened;
2. Mean Absolute Error: it decreased by 0.007 units or 53.99%;
3. Mean Squared Error: variation nothing in the transition from analysis with the Original Data to analysis with the Augmented Data;
4. Root Mean Squared Error: decreased by an amount of 0.012 units or equal to -57% in the transition between the prediction with the Original Data-OD to the prediction with the Augmented Data-AD.
Overall, considering all the data analyzed, it is a reduction on average of the statistical errors equal to 55.9% in the transition from the prediction with the original data to the prediction with the increased data Figure 8.

Figure 8:Confrontation Between Prediction With Original Data And Prediction With Augmented Data.
Therefore, it follows that the prediction with the Augmented Data-ADs is considerably performing with respect to the prediction with the Original Data-OD.
Conclusions
The variable “Knowledge Intensive Services Exports” was analyzed in the article. Econometric analysis has shown that among the various variables those that have the most positive impact on the export of high -intensity services are “Innovation Index”, “Sales Impact”, and “Total Entrepreneurial Activity”. The variables that instead have a greater negative impact are among the other “Buyer Sophistication” and “Government Procurement of Advanced Technology Products”.
Clusterization using the K-means algorithm shows the presence of a contrast between Northern Europe, Central Europe, and Southern Europe. It therefore derives the need by European policy makers to reduce the gap between the various European macro-areas to increase the efficiency of companies in the technological sector and to gain positions in the global competition for the development of the knowledge economics. In addition, the increase in the production of high -intensity services also has positive impacts in terms of productivity and for the growth of qualified employment at national level.
The Network Analysis performed using Manhattan's distance has highlighted the existence of various links in the trajectories followed by European countries in developing high-intensity services oriented to exportation. Finally, the analysis carried out using machine learning algorithms both with original data and with increased data showed the efficiency of the “Linear Regression” algorithm. However, the prediction with the Augmented Data-AD shows a significant reduction in the average value of statistical errors equivalent to -55.96% in respect to the prediction realized with Original Data-OD.
The proposed analysis highlights the great heterogeneity of European countries in the sense of exporting high knowledge services. But the heterogeneity is also accompanied by a significant diversification between northern Europe, central Europe, and southern Europe with very differentiated levels of export of knowledge intensive services. It follows that European policy makers should intervene to make sure that: 1. the most developed areas can also have spillover effects on the national-regional economy; 2. the gap between European macro-regions is reduced. These interventions are necessary to ensure that Europe can participate in the technological competition that currently sees US and China opposite. Europe is currently in third place for level of technological innovation, research and development and economics of knowledge. Public investments and the coordination among companies, research centers and institutions are necessary to make Europe has a new role in the economy of technological innovation globally.
Declarations
1. Data Availability Statement. The data presented in this study are available on request from the corresponding author.
2. Funding. The authors received no financial support for the research, authorship, and/or publication of this article.
3. Declaration of Competing Interest. The authors declare that there is no conflict of interests regarding the publication of this manuscript. In addition, the ethical issues, including plagiarism, informed consent, misconduct, data fabrication and/or falsification, double publication and/or submission, and redundancies have been completely observed by the authors.
References
Amoroso, S., & Müller, B. (2018). The short-run effects of knowledge intensive greenfield FDI on new domestic entry.The Journal of technology transfer,43, 815-836.
Indexed at, Google Scholar, Cross Ref
Bacovic, M. (2021). Exports of services, output and productivity growth in Europe.Asian Development Policy Review,9(4), 209-219.
Indexed at, Google Scholar, Cross Ref
Braja, M., & Gemzik-Salwach, A. (2020). Competitiveness of high-tech exports in the EU countries.Journal of International Studies,13(1).
Costantiello, A., & Leogrande, A. (2021). The innovation-employment nexus in Europe," American Journal of Humanities and Social Sciences Research (AJHSSR), 4(11), 166-187.
Costantiello, A., Laureti, L., & Leogrande, A. (2021). The Innovation-Friendly Environment in Europe.Available at SSRN 3933553.
Indexed at, Google Scholar, Cross Ref
Costantiello, A., Laureti, L., & Leogrande, A. (2021). The Innovation-Friendly Environment in Europe, in ICSET- International Conference on Science, Engineering & Technology (ICSET-2021), Singapore.
Indexed at, Google Scholar, Cross Ref
Costantiello, A., Laureti, L., De Cristoforo, G., & Leogrande, A. (2021). The Innovation-Sales Growth Nexus in Europe," University Library of Munich, Germany.
Indexed at, Google Scholar, Cross Ref
Desyllas, P., Miozzo, M., Lee, H.F., & Miles, I. (2018). Capturing value from innovation in knowledge-intensive business service firms: the role of competitive strategy.British Journal of Management,29(4), 769-795.
Indexed at, Google Scholar, Cross Ref
Ferraz, D.E., & Pereira, E.T. (2017). The importance of small knowledge intensive firms in European countries.International Entrepreneurship Review,3(1), 85-108.
Indexed at, Google Scholar, Cross Ref
Kamp, B., & de Apodaca, I.R. (2017). Are KIBS beneficial to international business performance: Evidence from the Basque Country, Competitiveness Review: An International Business Journal.
Indexed at, Google Scholar, Cross Ref
Kir, H., & Erdogan, N. (2021). A knowledge-intensive adaptive business process management framework.Information Systems,95, 101639.
Indexed at, Google Scholar, Cross Ref
Landaverry, K.Y.B., & Serafim, M.P. (2019). Notions of Knowledge Intensive Entrepreneurship in technology and science lagging behind Countries: the cases of Guatemala, El Salvador and Honduras.XLIII Encontro da ANPAD.
Laureti, L., Costantiello, A., & Leogrande, A. (2020). The Finance-Innovation Nexus in Europe," IJISET-International Journal of Innovative Science, Engineering & Technology, 7(12).
Laureti, L., Costantiello, A., Matarrese, M., & Leogrande, A. (2022). The Employment in Innovative Enterprises in Europe, University Library of Munich, Germany.
Indexed at, Google Scholar, Cross Ref
Leogrande, A., Costantiello, A., & Laureti, L. (2021). The Broadband Penetration in Europe.Journal of Applied Economic Sciences,16(3).
Leogrande, A., Costantiello, A., & Laureti, L. (2021). The Impact of Venture Capital Expenditures on Innovation in Europe.Available at SSRN 3930697.
Leogrande, A., Costantiello, A., Laureti, L., & Leogrande, D. (2021). The Determinants of Design Applications in Europe, Available at SSRN 3956853.
Indexed at, Google Scholar, Cross Ref
Leogrande, A., Costantiello, A., Laureti, L., & Matarrese, M. (2022). Innovative SMEs Collaborating with Others in Europe, University Library of Munich, Germany, no. 113008.
Indexed at, Google Scholar, Cross Ref
Leogrande, A., Laureti, L., & Costantiello, A. (2022). The Innovation Index in Europe, Available at SSRN 4091597.
Leogrande, A., Massaro, A., & Galiano, A.M. (2020). The impact of R&D investments on corporate performance in European Countries.American Journal of Humanities and Social Sciences Research (AJHSSR),4(7), 186-201.
Leydesdorff, L., Wagner, C.S., Porto-Gomez, I., Comins, J.A., & Phillips, F. (2019). Synergy in the knowledge base of US innovation systems at national, state, and regional levels: The contributions of high-tech manufacturing and knowledge-intensive services.Journal of the Association for Information Science and Technology,70(10), 1108-1123.
Indexed at, Google Scholar, Cross Ref
López Giral, D., Muñoz Navia, F.A., & Ahumada Franco, J.M. (2020). State neutrality, business elite and the lack of export services development in Chile: An exploratory qualitative analysis, Organizations and Markets in Emerging Economies, 11(21), 152-172.
Indexed at, Google Scholar, Cross Ref
Moreno-Gómez, J., Escandón-Charris, D., Moreno-Charris, A., & Zapata-Upegui, L. (2020). Analysis of the role of process innovation on export propensity in KIBS and non-KIBS firms in Colombia.Competitiveness Review: An International Business Journal,31(3), 497-512.
Indexed at, Google Scholar, Cross Ref
Przybylinski, M., & Wyszkowska-Kuna, J. (2021). The Content of Knowledge-Intensive Business Services in International Trade: Evidence from European Union Countries 1.Ekonomicky Casopis,69(1), 34-58.
Stefaniak, J., & Bak, I. (2018). Assessment of competitiveness of the EU export in services.European Journal of Service Management,25, 303-310.
Xuan, K. (2017). China's Service Trade and Service Industry Growth-An Empirical Analysis from the Aspect of Factor Intensity. In2016 International Conference on Modern Management, Education Technology, and Social Science (MMETSS 2016).
Indexed at, Google Scholar, Cross Ref
Received: 27-Oct-2022, Manuscript No. AAFSJ-22-12742; Editor assigned: 29-Oct-2022, PreQC No. AAFSJ-22-12742(PQ); Reviewed: 11-Nov-2022, QC No. AAFSJ-22-12742; Revised: 11-Jan-2023, Manuscript No. AAFSJ-22-12742(R); Published: 20-Jan-2023