Research Article: 2020 Vol: 23 Issue: 2
The impact comparison of supply chain relationship on public transportation quality in Taichung city, Taiwan and Chiang Mai city, Thailand
Phanee Thipwong, Asia University
Wing-Keung Wong, Asia University
Wan-Tran Huang, Asia University
Citation Information: Thipwong, P., Wong, WK., & Huang, WT. (2020). The impact comparison of supply chain relationship on public transportation quality in Taichung city, Taiwan and Chiang Mai city, Thailand. Journal of Management Information and Decision Sciences, 23(1), 16-34.
Abstract
Public transportation services operate a crucial part for people who are powerless to drive, for instance, people who don't have personal vehicles, people are in pregnancy, children, disabilities, and senior citizens can reach their destinations in every day with cheap fares. There are many kinds of transit choices for public transportation systems include Bus, Train, Metropolitan Rapid Transit (MRT), High-Speed Rail (HSR), Bus Rapid Transit (BRT), Taxi, Minibus, and so on. Public transportation systems also can help to reduce health risk determinants like air pollution and motor vehicle crashes. This research paper aims to examine how the supply chain relationship impacts public transportation quality in Taichung city, Taiwan and Chiang Mai city, Thailand and analyses the construction of supply chain relationship on quality cooperation for public transportation in Taichung city, Taiwan and Chiang Mai city, Thailand. Moreover, develop the theoretical model and figure out the empirical test (the structural equation modelling). Therefore the confirmatory factor analysis (CFA) approach is taken for this estimation.
Keywords
Supply Chain Relationship, Public Transportation, Taichung City, Chiang Mai City.
Introduction
In general, Supply Chain Management will be classified into three parts areas include manufacturing, purchasing, and transportations. In this study, we focus on the transportation area with a supply chain relationship. Supply Chain Relationship is principally concerning the administration of connections crossed system networks of organizations, reasonable in levels of communication relationship based on approved guarantees strong trust within supplier and buyer, has extraordinary cooperation frequency vital trust and commitment among buyer and supplier, has an important purchase in relationship management products and services are extremely customized.
Public Transportation in Taichung City, Taiwan
As reported by Luu (2018), most Taiwanese people voted Taichung is the most livable city in Taiwan. Taichung city is located in East Asia and the central Taiwan region. Moreover, Taichung city is the main hub of many countries and cities. About the Taichung's economics pillars, the first one is the agriculture industry, the second one is industrial development and technology, and the third one is commercial and service industries, respectively. Now the Taichung city government enhances the public transportation population and plans the compound transportation system. The Transportation Bureau of Taichung City Government plans to promote the free bus policy (Double 10 bus fare policy). The bus is 10 kilometers free of charge. If the citizens take the bus over 10 kilometers, they still will be charged only 10 NTD (Taichung City Government, 2019).
Mentioned by Lin et al. (2017) the Taichung City Government reforms their public transportation in Taichung city consecutively. The main key policies of Taichung city bus reform were divided into four parts: the opening of supplier operations, fare pricing policy, establishment of electronic fare payment, and market promotion. Due to Taiwan encourages citizens to use public transportation, they pay attention to develop public transportation. They provide perfect service facilities and safety.
The bus is the most general form of public transportation in Taiwan (Shi & Yang, 2013). According to the Information Bureau of Taichung City Government (2019) currently, the bus has the new service hours of route 309 bus to visit Gaomei Wetland. Gaomei Wetland is one of the popular destinations in Taichung. The tourists can use this service. And "Versatile Taxi" which is the new imported deluxe vehicle will be launched soon. They aren't the same as the traditional yellow taxi. They will not drive along the roads to find customers. The customers have to make appointments by using applications. The application also will provide by different companies. The rate price of the versatile taxi will be charged at the rate one to two of a yellow taxi. At this moment, public transportation in Taichung city includes bus, train, High-Speed Rail (HSR), Bus Rapid Transit (BRT), and taxi. But in 2018, the Taichung Metropolitan Rapid Transit (MRT) will open to test operations and will begin official operations in 2020 (Smart Asia Taiwan, 2017).
Public Transportation in Chiang Mai City, Thailand
On the word of Travel+Leisure (2019) Chiang Mai is the largest and most important Lanna cultural center in the north of Thailand. Besides, Chaing Mai is quite popular for the Thai new year festival (Songkran festival) in April. Moreover, Terzian (2019) mentioned that Chiang Mai city is one of the top 15 cities in the world and also ranks 3rd in 2019 by Travel+Leisure survey. Chiang Mai has a small-scale public transportation systems. (Perfect Homes, Chiang Mai Properties, 2016). According to Satayopas (2017) studied on Chaing Mai public transportation master plan. The major system of Chiang Mai public transportation is 2 minibus (Red and yellow minibus). Vehicle registration of Chiang Mai is 1.3 million in 2016 and forecast to be 2.6 million in 2026. As mentioned at Lonely Planet (2019) Tuk-tuk, yellow minibus, and red minibus are local transport. Red minibus is cheaper than Tuk-tuk and they don't fix the routes for going. Therefore, it's very easy to take you where you would like to visit. For a taxi, you can see the metered taxi when you need to pay.
Following Jittrapirom, & Jaensirisak (2017), the master plan of Chiang Mai city aimed at 41 projects in total. A high ratio of master plan projects focus on traffic safety 15 projects,128.3 million baht of the total project cost, urban area development 16 projects, 78.55 million baht of the total project cost, traffic management 3 projects 8 million baht of the total project cost, convenient in commuting 5 projects, 30 million baht of the total cost project, restricted personal vehicle 7 projects, 115.5 million baht of the total project cost, develop public transport system 2 projects, 16 million baht of the total project cost, and land use management 2 projects 2 million baht of the total project cost. And transport development was classified as an urgent project from 11 total urgent projects.
Furthermore, Prachachat (2018) reported currently, Regional Transit Corporation (RTC) has joined the Chiang Mai Smart City network. The main objective of the RTC is to use public transportation systems as a mechanism to drive the city because the efficient public transportation system will be an important driving force towards smart cities. In addition to RTC supports digital service systems that have joined ViaBus to provide an application to find bus locations for customers.
Literature Review
According to Nyaga, et al. (2010) examined collaborative relationships in two separate studies using structural equation model: the first one investigated buyers’ perceptions and the second one investigate suppliers’ perceptions. Their research results showed that collaborative activities, joint relationship effort, information sharing, and dedicated investments took to trust and commitment. For trust and commitment took to enhance satisfaction and performance. As part of Chen et al. (2011) found that the level of quality, availability, and trust, information sharing and commitment are positive relationships with each other.
Referring to Su et al. (2008) focused on the influence of supply chain relationship quality on cooperative strategy and the construct of supply chain relationship quality. The study pointed out that supply chain relationship quality can be identified as a construct of cooperation, trust, adaptation, communication, and atmosphere. Additionally, there is a significant positive impact on relationship persistence, relationship frequency, and relationship diversity in supply chain relationship quality. Shi & Liao (2013) researched the effects of inter-organizational trust and interdependence on the relationship quality between supply chain partners in hospitality services. They didn't understand how the inter-organizational corporate relationships of hospitality firms and suppliers. Thus, they intended to create a model and hypotheses to the social exchange theory and the resource dependence theory on the relationships between inter-organizational trust, interdependence, and relationship quality.
Conforming to Fynes et al. (2004) developed a model of environmental uncertainty, supply chain relationship quality, and supply chain relationship performance. They managed a two-stage analysis of the measurement and structural equation model to examine their hypotheses. The measures utilized for supply chain relationship quality which include communication, trust, co-operation, and adaptation; supply chain performance which include quality, cost, flexibility, and delivery dependability; and environmental uncertainty which include supply uncertainty, demand uncertainty, and technological uncertainty. Also, Fynes et al. (2005) studied the impact of supply chain relationship quality on quality performance that concentrated on the synergy of the numerous measurements of supply chain relationships like trust, communication, collaboration commitment, and adaptation, for instance. Apart from that, Carter & Jennings (2002) investigated social responsibility and supply chain relationships. They used the potential impact which purchasing social responsibility might relate to supply chain relationships. Their result presented that if opportunism increases, both trust, and commitment will decrease.
Model and Hypothesis Development
This paper reconsiders the literature review about the supply chain relationship as can be seen in Table 1 and creates a conceptual framework as shown in Figure 1. Summary of postulated hypothesises given in Table 2.

Figure 1: Conceptual Framework (Gang Liu, 2018)
| Table 1: The Main Points of Supply Chain Relationship Dimensions | |
| Authors | Key dimension |
|---|---|
| Nyaga et al., 2010 | Collaborative relationships, Commitment, Trust, Satisfaction, Supply chain alliances |
| Chen et al., 2011 | Information sharing, Information quality, Information availability, Behavioral uncertainty, Trust, Commitment |
| Su et al., 2008 | Relationship quality, Cooperative strategy, Communication, Cooperation, Trust, Adaptation, Atmosphere |
| Shi & Liao, 2013 | Interorganizational relationship, Interorganizational trust, Interdependence, Joint teamwork, Relationship quality |
| Fynes et al.., 2005 | trust, communication, co-operation and adaptation |
| Fynes et al., 2004 | trust, commitment, adaptation, communication and collaboration |
| Carter & Jennings, 2001 | Purchasing social responsibility, buyer's relationship commitment, buyer's trust in supplier, supplier performance, cooperation between buyer and supplier |
| Table 2: Summary of Research Hypothesis | |
| Hypothesis | Describe hypothesis |
|---|---|
| H1 | Communication will be positively related to quality cooperation. |
| H2 | Trust will be positively related to quality cooperation. |
| H3 | Commitment will be positively related to quality cooperation. |
| H4 | Adaptation will be positively related to quality cooperation. |
Research Methodology
Data Collection
This study implicates the gathering of empirical data concerning to use public transportation in Taichung City, Taiwan, and Chiang Mai City, Thailand. First of all, a questionnaire was designed to clarify customer estimations by considering the public transportation system and services presently. It comprises multiple choices to analysis the hypotheses mentioned before this section. We descript the survey items in Table 1. The respondents were requested to answer to significance of each item based on a five-point Likert scale of 1-5, with 1 scoring the lowest point "Strongly Disagree", to 5 scoring the highest point "Strongly Agree". Finally, the online questionnaires will be collected from a person who has used public transportation in Taichung city, Taiwan (One hundred questionnaires) and Chiang Mai city, Thailand (One hundred questionnaires) by using a simple random sampling technique. Therefore, two hundred responses were received for data analysis.
Measurement Model
In this study, we use Structural Equation Modelling (SEM) for analysing data and also use a questionnaire survey to investigate the hypotheses. Refer to Structural Equation Modelling (SEM) is known as a statistical modelling technique that uses in the behavioural sciences. Structural Equation Modelling uses theoretical constructs and then, demonstrates by the latent factors. The connections of theoretical constructs are illustrated by path coefficient or regression between the factors. Structural Equation Modelling sets a framework for statistical analysis which consists of many traditional multivariate procedures such as regression analysis, discriminant analysis, factor analysis, and canonical correlation. The statistic model often shows in a set of matrix equations (Hox & Bechger, 2011). Also, Kaplan (2001) stated that structural equation modelling is the most famous statistical methodology in quantitative social scientists. Structural Equation Modelling is a priori that indicates the researcher’s hypotheses and makes up the model to be estimated in the investigation (Kline, 2005). Structural equation modelling is a mathematical methodology that uses a confirmatory method to the multivariate analysis of a structural theory aiming at some aspect. Many features of the Structural Equation Modelling set came from the older generation of multivariate methods (Byrne, 2001). Many software programs can use for refined adjustable modelling. Besides, Porritt et al. (2015) used AMOS to test the model for the model fit a data set and let to test interrelationships between a range of variables simultaneously. But Novikova et al. (2013) used Mplus to test their model. In Structural equation modelling, there are four statistics to estimate model fit that composes of 1. Model fit 2. Comparative fit index (CFI), 3. Tucker
Lewis index (TLI), and 4. The standardized root mean residual value.
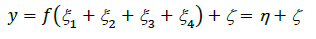
Thus, the causal relationships of different variables and their probable impacts on customer interactions with public transportation services, we test by using structural equation modelling. The following mathematically demonstrates the analytical process of this research Let  be the latent of customer interactions (CQ, Unobservable), be perceived Communication (COM), &e
  2 be perceived Trust (TT), 3 be Commitment (COMMIT), and 4 be Adaptation (ADAP). We hypothesize customer interactions, y (Observable), satisfies the following relation:
 (1)
(1)
Where  is an error term with Σ = Cov (), see Figure 1. As all the exogenous variables, , 3 , 3 and 4 are hypothesized to lead to the latent, η, of endogenous variable, y, positively, we assume:
Where i = 1, 2, 3, 4
A linear structural equation is used to represent equation (1):
 (2)
(2)
Where = [ , 3 , 3 , 4] . The endogenous variable, y, is observable but the
exogenous variables, , 3 , 3 and 4 , are unobservable. As such, several, said ni, of
observed items of xi , (xij , j =1 …, ni) are used to measure i for each i = 1, 2, 3, and 4 .
The measurement model for the vector of the exogenous latent variables is:
 (3)
(3)
Where x = [ x1,1 , x1,2 ,…, x1,n1 , x2,1 , x2,2 , … , x2,n2 , x2,1, x3,2 , … , x3,n3 , x4,1 , x4,2 , … , x4,n4]’ and = [ , 3 , 3 , 4]’.
The parameters are estimated using the maximum likelihood estimation as follows:

Where, tr = trace (sum of the diagonal elements),
S = covariance matrix of all indices for the latent variables implied by the model,
C = actual covariance matrix of all indices for the latent variables,
ln = natural logarithm, and
| | indicates the determinant of a matrix.
For Goodness-of-fit tests comparing the given model with an alternative model will match the model to the fit of other models. If there is a second model, that will be good. Meanwhile, none is designated; analytical sets normally default to matching the model with the independence model. And Goodness of fit measures based on information theory will estimate by using maximum likelihood estimation (Westland, 2012).
Emperical Results
Taichung, Taiwan
Descriptive Statistic Analysis of Sample Demographics
Summarizing the respondents' background information for public transportation in Taichung, Taiwan as shown in Table 3, 120 questionnaires were sent and 100 questionnaires were received. According to the survey, respondents are male, 43%; respondents are female, 57%. Most of the respondents are 21-30 years old, 78%, and followed by the age of 31-40 years old, 9%, which shows that the respondents who used public transportation in Taichung, Taiwan is in the middle ages. Most of the respondents are Taiwanese, 55%, Indonesian, 25% and Vietnamese and Thai, 3%, respectively. The respondents' education level shows that 42 of 100 respondents, 42% are bachelor’s degrees, 37% are master’s degrees, and 8% are high school/equivalent. And 72% of respondents are students, 17% of respondents are an employee. The personal income shows that 53% respondents have earned Under 10,000 NTD per month, 20% of 10,001-20,000 NTD, followed by 11% of 30,001-40,000 Baht. Satisfying public transportation services in Taichung, Taiwan, 76% of the respondents who used public transportation in Taichung were satisfied, but 24% were dissatisfied. The main reason for choosing public transportation services in Taichung, Taiwan, 44% because of price, 39% because of convenience, and 10% services. The source for public transportation’s information in Taichung, Taiwan, 44% of the respondents get the information from the website, 24% of the respondents get the information from word of mouth, and 23% of the respondents get the information from the social network. For the kinds of public transportation services that respondents use in Taichung, the respondents take the bus 76%, high-speed rail (HSR) 11%, bus rapid transit (BRT) and taxi 3%, respectively.
| Table 3: Demographics | ||||
| S No | Characteristics | Categories | Frequency | Percentage % |
|---|---|---|---|---|
| 1 | Gender | Male | 43 | 43 |
| Female | 57 | 57 | ||
| 2 | Age | Under 20 years old | 8 | 8 |
| 21-30 years old | 78 | 78 | ||
| 31-40 years old | 9 | 9 | ||
| 41-50 years old | 3 | 3 | ||
| 51-60 years old | 1 | 1 | ||
| 61-70 years old | 1 | 1 | ||
| 3 | Nationality | Taiwanese | 55 | 55 |
| Chinese | 2 | 2 | ||
| Thai | 3 | 3 | ||
| Japanese | 1 | 1 | ||
| Malaysian | 2 | 2 | ||
| Hong Kong | 1 | 1 | ||
| Indonesian | 25 | 25 | ||
| Vietnamese | 3 | 3 | ||
| British | 2 | 2 | ||
| Filipino | 1 | 1 | ||
| Indian | 1 | 1 | ||
| Turkish | 1 | 1 | ||
| Somaliland | 1 | 1 | ||
| Korean | 1 | 1 | ||
| 4 | Education | Elementary school | 1 | 1 |
| High school/Equivalent | 8 | 8 | ||
| Vocational/Technical school | 5 | 5 | ||
| Bachelor’s degree | 42 | 42 | ||
| Master’s degree | 37 | 37 | ||
| Doctoral degree | 6 | 6 | ||
| Professional degree | 1 | 1 | ||
| 5 | Occupation | Student | 72 | 72 |
| Military/Civil service official | 2 | 2 | ||
| Employee | 17 | 17 | ||
| Self-employed | 8 | 8 | ||
| Retiree | 1 | 1 | ||
| 6 | Personal Income | Under 10,000 NTD | 53 | 53 |
| 10,001-20,000 NTD | 20 | 20 | ||
| 20,001-30,000 NTD | 7 | 7 | ||
| 30,001-40,000 NTD | 11 | 11 | ||
| 41,001-50,000 NTD | 1 | 1 | ||
| 50,001-60,000 NTD | 3 | 3 | ||
| 60,001-70,000 NTD | 4 | 4 | ||
| Above 70,001 NTD | 1 | 1 | ||
| 7 | Do you satisfy public transportation services in Taichung? | Satisfy | 76 | 76 |
| Not Satisfy | 24 | 24 | ||
| 8 | What is the main reason for choosing public transportation services in Taichung? | Staffs | 2 | 2 |
| Price | 44 | 44 | ||
| Services | 10 | 10 | ||
| Convenience | 39 | 39 | ||
| Others | 5 | 5 | ||
| 9 | What is your source for public transportation’s information in Taichung? | Newspapers | 3 | 3 |
| Website | 44 | 44 | ||
| Social Network | 23 | 23 | ||
| Word of mouth | 24 | 24 | ||
| Others | 6 | 6 | ||
| 10 | What kinds of public transportation services do you use the most in Taichung? | Bus | 76 | 76 |
| Train | 7 | 7 | ||
| Bus Rapid Transit (BRT) | 3 | 3 | ||
| High-Speed Rail (HSR) | 11 | 11 | ||
| Taxi | 3 | 3 | ||
In order to present the customers’ demographic, 10 characteristics of customers and research results are included in Table 3.
Table 4 shows the Cronbach's alpha coefficient for 23 questionnaire items with Cronbach's alpha 0.95 = Excellent. And the reliability test was also managed independently for each variable. The reliability of each variable includes 7 items of Communication (COM) with Cronbach's alpha 0.86 = Good, 2 items of Trust (TT) with Cronbach's alpha 0.92 = Excellent, 3 items of Commitment (COMMIT) with Cronbach's alpha 0.90 = Good. 7 items of Adaptation (ADAP) with Cronbach's alpha 0.94 = Excellent, and 4 items of Quality Cooperation (QC) with Cronbach's alpha 0.92 = Excellent.
| Table 4: Reliability Statistics (Cronbach's Alpha Based on Standardized Items) | ||
| Variables | Number of Items | Cronbach’s Alpha |
|---|---|---|
| Communication (COM) | 7 | 0.859 |
| Trust (TT) | 2 | 0.915 |
| Commitment (COMMIT) | 3 | 0.895 |
| Adaptation (ADAP) | 7 | 0.944 |
| Quality Cooperation (QC) | 4 | 0.919 |
| Total | 23 | 0.952 |
Note: Value of Cronbach's alpha: α ≥ 0.9 Excellent 0.9 < α ≤ 0.8 Good 0.8 > α ≥ 0.7 Acceptable 0.7 > ≥ ≥ 0.6 Questionable 0.6 < α ≤ Poor 0.5 < α Unacceptable.
As shown in Table 5 the parts of the five constructs as follows four exogenous variables; (1) communication (2) trust (3) commitment (4) adaptation and 1 endogenous variable; (1) quality cooperation. We test a confirmatory factor analysis (CFA) in this research to define the relationships between the observed variables and the latent variables. Thus, there are 19 indicators for exogenous variables and 4 indictors of endogenous variables were adjusted and applied in the constructed model.
| Table 5: Overall CFA for the Modified Measurement Model (N=100) | ||
| Latent & Observed Variables | Standardized Regression Weigh | Squared Multiple Correlation |
|---|---|---|
| Communication (EX) | ||
| I can reach the information about bus, train, Metropolitan Rapid Transit (MRT), High-Speed Rail (HSR), Bus Rapid Transit (BRT), taxi by social media such as Facebook, Instagram, Twitter and so on. (COM1) | 0.828 | 0.685 |
| They always use multi-media for advertisements. (COM2) | 0.693 | 0.481 |
| I often receive their e-mail for updated information and I can e-mail them back if I have any problems to ask them. (COM3) | 0.413 | 0.17 |
| I can see notices from my mobile or applications. (COM4) | 0.657 | 0.431 |
| They have their own website or blog for an announcement and services. (COM5) | 0.644 | 0.415 |
| I know about the information and services from social sharing. (COM6) | 0.753 | 0.567 |
| I can reach the information about bus, train, Metropolitan Rapid Transit (MRT), High-Speed Rail (HSR), Bus Rapid Transit (BRT), taxi by offline media such as magazines, newspapers, radio, television and so on. (COM7) | 0.76 | 0.578 |
| Trust (EX) | ||
| I trust their customer services. (TT1) | 0.787 | 0.619 |
| I believe in their products and ethical standards. (TT2) | 0.777 | 0.603 |
| Commitment (EX) | ||
| I think that governance and resource sharing as key mechanisms to create relationship benefits. (COMMIT1) | 0.836 | 0.699 |
| Relationship termination cost plays a strong, central role in explaining the relationship development process between customers and public transportation services. (COMMIT2) | 0.88 | 0.774 |
| Shared values can improve brand value, particularly among consumers. (COMMIT3) | 0.864 | 0.746 |
| Adaptation (EX) | ||
| A cost is the main key to use up to produce and services. (ADAP1) | 0.781 | 0.609 |
| Pricing can encourage customers to buy. (ADAP2) | 0.844 | 0.713 |
| Marketing channels can reach different customers segments. (ADAP3) | 0.871 | 0.759 |
| Sales can create promotional benefits. (ADAP4) | 0.856 | 0.733 |
| Products can improve customer loyalty. (ADAP5) | 0.856 | 0.732 |
| The objective is the way to satisfy customers' needs. (ADAP6) | 0.809 | 0.654 |
| Strategies can reach new customers and increase demand. (ADAP7) | 0.869 | 0.755 |
| Quality Cooperation (ED) | ||
| The government sector cooperates with public transportation service systems very well.(QC1) | 0.834 | 0.696 |
| The private sector cooperates with public transportation service systems very well.(QC2) | 0.865 | 0.748 |
| Customers/Citizens cooperate with public transportation service systems very well.(QC3) | 0.815 | 0.664 |
| The entrepreneurs cooperate with public transportation service systems very well. (QC4) | 0.782 | 0.612 |
For this research study, the structural equation framework model was examined by using IBM SPSS AMOS Version 24. The hypothesis (H1~H4) was examined for the sample. The measurement fit model for the structural equation model showed an acceptable result. (Chi-square = 598.305; Degrees of freedom = 227; Probability level = 0.000; NFI = 0.709; RFI = 0.646; IFI = 0.797; TLI = 0.746; CFI = 0.791; PRATIO = 0.822; PNFI = 0.583; PCFI = 0.651; NCP = 371.305; FMIN = 5.983; RMSEA = 0.128; AIC = 742.305; BCC = 787.779; ECVI = 7.423; MCEVI = 7.878). In the four hypotheses proposed, three paths were approved (communication to quality cooperation; trust to quality cooperation; commitment to quality cooperation). Figure 2 shows the results of the structural equation model.

Figure 2: The Results of the Structural Equation Model (Taichung, Taiwan)
Hypothesis 1
Communication has a statistically significant and positive influence on quality cooperation. Based on standardized estimates of .780 and the associated p-value of 0.000 this hypothesis was accepted (p < 0.001). It indicates that most passengers can reach the information about bus, train, Metropolitan Rapid Transit (MRT), High-Speed Rail (HSR), Bus Rapid Transit (BRT), taxi by both of social media and offline media. Therefore, communication is very crucial for passengers. The government and private companies should update multi-media for advertisements, mobile applications, e-mail, Facebook, Instagram, Twitter and website or blog all the time.
Hypothesis 2
Trust has a statistically significant and positive influence on quality cooperation. Based on standardized estimates of .515 and the associated p-value of 0.000 this hypothesis was accepted (p < 0.001). Based on the hypothesis test, the test assumed that passengers trust their customer services and believe in their products and ethical standards. That means the government sector and the private sector could make them confident about services.
Hypothesis 3
Commitment has a statistically significant and positive influence on quality cooperation. Based on standardized estimates of .657 and the associated p-value of 0.000 this hypothesis was accepted (p < 0.001). It means that the governance and resource sharing as key mechanisms to create relationship benefits, relationship termination cost plays a strong, central role in explaining the relationship development process between customers and public transportation services and shared values can improve brand value, particularly among consumers.
Hypothesis 4
Adaptation has a statistically significant and positive influence on quality cooperation. Based on standardized estimates of .693 and the associated p-value of0 .000 this hypothesis was accepted (p < 0.001). It shows that a cost is the main key to use up to produce and services, a cost is the main key to use up to produce and services, pricing can encourage customers to buy, marketing channels can reach different customer segments, sales can create promotional benefits, products can improve customer loyalty, the objective is the way to satisfy customers' needs, and strategies can reach new customers and increase demand. Thus, the government sector, the private sector, and the entrepreneurs need to realize the cost of production and services, pricing, marketing channels, and new strategies for passengers.
Chiang Mai, Thailand
Descriptive Statistic Analysis of Sample Demographics
Summarizing the respondents' background information for public transportation in Chiang Mai, Thailand as shown in Table 3, 120 questionnaires were sent and 100 questionnaires were received. According to the survey, respondents are male, 42%; respondents are female, 58%. Most of the respondents are 21-30 years old, 74%, and followed by the age of 31-40 years old, 15%, which shows that the respondents who used public transportation in Chiang Mai, Thailand is in the middle ages. Most of the respondents are Thai, 92%, Cambodian, 5%, Myanmar 1%, and Polish, 1%, respectively. The respondents' education level shows that 60 of 100 customers, 60% are bachelor’s degrees, 30% are master’s degrees, and 10% are Doctoral degrees. And 59% of respondents are Employee, 16% of respondents are military/civil service official and self-employed. The personal income shows that 32% respondents have earned 10,001-20,000 Baht, 29% of 20,001-30,000 Baht, followed by 18% of 30,001-40,000 Baht. Satisfying public transportation services in Chiang Mai, Thailand, 39% of the respondents who used public transportation in Chiang Mai were satisfied, but 61% were dissatisfied. The main reason for choosing public transportation services in Chiang Mai, Thailand, 46% because of convenience, 28% because of price, and 15% services. The source for public transportation’s information in Chiang Mai, Thailand, 61% of the respondents get the information from the social network, 31% of the respondents get the information from word of mouth, 7% of the respondents get the information from the website. For the kinds of public transportation services that respondents use in Chiang Mai, the respondents take the red and yellow minibus 64%, taxi and bus 16%, tuk-tuk, and train 2%, respectively.
In order to present the customers’ demographic, 10 characteristics of customers and research results are included in Table 6.
| Table 6: Demographics | ||||
| S No | Characteristics | Categories | Frequency | Percentage % |
|---|---|---|---|---|
| 1 | Gender | Male | 42 | 42 |
| Female | 58 | 58 | ||
| 2 | Age | Under 20 years old | 1 | 1 |
| 21-30 years old | 74 | 74 | ||
| 31-40 years old | 15 | 15 | ||
| 41-50 years old | 6 | 6 | ||
| 51-60 years old | 2 | 2 | ||
| 61-70 years old | 2 | 2 | ||
| 3 | Nationality | Thai | 92 | 92 |
| Myanmar | 1 | 1 | ||
| Cambodian | 5 | 5 | ||
| Polish | 1 | 1 | ||
| 4 | Education | Bachelor’s degree | 60 | 60 |
| Master’s degree | 30 | 30 | ||
| Doctoral degree | 10 | 10 | ||
| 5 | Occupation | Student | 7 | 7 |
| Military/Civil service official | 16 | 16 | ||
| Employee | 59 | 59 | ||
| Self-employed | 16 | 16 | ||
| Retiree | 2 | 2 | ||
| 6 | Personal Income | Under 10,000 Baht | 5 | 5 |
| 10,001-20,000 Baht | 32 | 32 | ||
| 20,001-30,000 Baht | 29 | 29 | ||
| 30,001-40,000 Baht | 18 | 18 | ||
| 41,001-50,000 Baht | 8 | 8 | ||
| 50,001-60,000 Baht | 5 | 5 | ||
| 60,001-70,000 Baht | 1 | 1 | ||
| Above 70,001 Baht | 2 | 2 | ||
| 7 | Do you satisfy public transportation services in Taichung? | Satisfy | 39 | 39 |
| Not Satisfy | 61 | 61 | ||
| 8 | What is the main reason for choosing public transportation services in Taichung? | Staffs | 1 | 1 |
| Price | 28 | 28 | ||
| Services | 15 | 15 | ||
| Convenience | 46 | 46 | ||
| Others | 10 | 10 | ||
| 9 | What is your source for public transportation’s information in Taichung? | Newspapers | 1 | 1 |
| Website | 7 | 7 | ||
| Social Network | 61 | 61 | ||
| Word of mouth | 31 | 31 | ||
| 10 | What kinds of public transportation services do you use the most in Taichung? | Bus | 16 | 16 |
| Train | 2 | 2 | ||
| Red and yellow Minibus | 64 | 64 | ||
| Tuktuk | 2 | 2 | ||
| Taxi | 16 | 16 | ||
Table 7 shows the Cronbach's alpha coefficient for 23 questionnaire items with Cronbach's alpha 0.91 = Excellent. And the reliability test was also managed independently for each variable. Reliability of each variable include 7 items of Communication (COM) with Cronbach's alpha 0.83 = Good, 2 items of Trust (TT) with Cronbach's alpha 0.80 = Acceptable, 3 items of Commitment (COMMIT) with Cronbach's alpha 0.85 = Good. 7 items of Adaptation (ADAP) with Cronbach's alpha 0.92 = Excellent, and 4 items of Quality Cooperation (QC) with Cronbach's alpha 0.89 = Good.
| Table 7: Reliability Statistics (Cronbach's Alpha Based On Standardized Items) | ||
| Variables | Number of Items | Cronbach’s Alpha |
|---|---|---|
| Communication (COM) | 7 | 0.827 |
| Trust (TT) | 2 | 0.800 |
| Commitment (COMMIT) | 3 | 0.846 |
| Adaptation (ADAP) | 7 | 0.918 |
| Quality Cooperation (QC) | 4 | 0.892 |
| Total | 23 | 0.914 |
Note: Value of Cronbach's alpha: α ≥ 0.9 Excellent 0.9 < α ≤ 0.8 Good 0.8 > α ≥ 0.7 Acceptable 0.7 > ≥ ≥ 0.6 Questionable 0.6 < α ≤ Poor 0.5 < α Unacceptable.
As shown in Table 8 the parts of the five constructs as follows four exogenous variables; (1) communication (2) trust (3) commitment (4) adaptation and 1 endogenous variable; (1) quality cooperation. We test a confirmatory factor analysis (CFA) in this research to define the relationships between the observed variables and the latent variables. Thus, there are 19 indicators for exogenous variables and 4 indictors of endogenous variables were adjusted and applied in the constructed model.
| Table 8: Overall CFA for the Modified Measurement Model (N=100) | ||
| Latent & Observed Variables | Standardized Regression Weigh | Squared Multiple Correlation |
|---|---|---|
| Communication (EX) | ||
| I can reach the information about bus, train, red and yellow minibus, tuktuk and taxi by social media such as Facebook, Instagram, Twitter and so on. (COM1) | 0.736 | 0.541 |
| They always use multi-media for advertisements. (COM2) | 0.720 | 0.518 |
| I often receive their e-mail for updated information and I can e-mail them back if I have any problems to ask them. (COM3) | 0.491 | 0.242 |
| I can see notices from my mobile or applications. (COM4) | 0.613 | 0.375 |
| They have their own website or blog for an announcement and services. (COM5) | 0.697 | 0.486 |
| I know about the information and services from social sharing. (COM6) | 0.685 | 0.469 |
| I can reach the information about bus, train, red and yellow minibus, tuktuk and taxi by offline media such as magazines, newspapers, radio, television and so on. (COM7) | 0.490 | 0.240 |
| Trust (EX) | ||
| I trust their customer services. (TT1) | 0.325 | 0.106 |
| I believe in their products and ethical standards. (TT2) | 0.382 | 0.146 |
| Commitment (EX) | ||
| I think that governance and resource sharing as key mechanisms to create relationship benefits. (COMMIT1) | 0.834 | 0.695 |
| Relationship termination cost plays a strong, central role in explaining the relationship development process between customers and public transportation services. (COMMIT2) | 0.881 | 0.776 |
| Shared values can improve brand value, particularly among consumers. (COMMIT3) | 0.703 | 0.494 |
| Adaptation (EX) | ||
| A cost is the main key to use up to produce and services. (ADAP1) | 0.609 | 0.371 |
| Pricing can encourage customers to buy. (ADAP2) | 0.799 | 0.639 |
| Marketing channels can reach different customers segments. (ADAP3) | 0.779 | 0.607 |
| Sales can create promotional benefits. (ADAP4) | 0.812 | 0.660 |
| Products can improve customer loyalty. (ADAP5) | 0.838 | 0.702 |
| The objective is the way to satisfy customers' needs. (ADAP6) | 0.818 | 0.669 |
| Strategies can reach new customers and increase demand. (ADAP7) | 0.835 | 0.698 |
| Quality Cooperation (ED) | ||
| The government sector cooperates with public transportation service systems very well.(QC1) | 0.653 | 0.427 |
| The private sector cooperates with public transportation service systems very well.(QC2) | 0.795 | 0.631 |
| Customers/Citizens cooperate with public transportation service systems very well.(QC3) | 0.886 | 0.784 |
| The entrepreneurs cooperate with public transportation service systems very well. (QC4) | 0.855 | 0.731 |
For this research study, the structural equation framework model was examined by using IBM SPSS AMOS Version 24. The hypothesis (H1~H4) was examined for the sample. The measurement fit model for the structural equation model showed an acceptable result. (Chi-square = 498.119; Degrees of freedom = 227; Probability level = 0.000; NFI = 0.678; RFI = 0.609; IFI = 0.795; TLI = 0.741; CFI = 0.787; PRATIO = 0.822; PNFI = 0.558; PCFI = 0.647; NCP = 271.119; FMIN = 4.884; RMSEA = 0.108; AIC = 642.119; BCC = 686.427; ECVI = 6.295; MCEVI = 6.730). In the four hypotheses proposed, three paths were approved (communication to quality cooperation; trust to quality cooperation; commitment to quality cooperation). Figure 3 shows the results of the structural equation model.

Figure 3: The Results of the Structural Equation Model (Chiang Mai, Thailand)
Hypothesis 1
Communication has a statistically significant and positive influence on quality cooperation. Based on standardized estimates of .212 and the associated p-value of 0.018 this hypothesis was accepted (p < 0.05). It indicates that most passengers can reach the information about bus, train, Metropolitan Rapid Transit (MRT), High-Speed Rail (HSR), Bus Rapid Transit (BRT), taxi by both of social media and offline media. Therefore, communication is very crucial for passengers. The government and private companies should update multi-media for advertisements, mobile applications, e-mail, Facebook, Instagram, Twitter and website or blog all the time.
Hypothesis 2
Trust has not a statistically significant and positive influence on quality cooperation. Based on standardized estimates of .090 and the associated p-value of 0.097 this hypothesis was rejected (p < 0.05). Based on the hypothesis test, the test assumed that passengers don’t trust their customer services and believe in their products and ethical standards. That means the government sector and the private sector could not make them confident about services.
Hypothesis 3
Commitment has a statistically significant and positive influence on quality cooperation. Based on standardized estimates of 0.360 and the associated p-value of 0.000 this hypothesis was accepted (p < 0.001). It means that the governance and resource sharing as key mechanisms to create relationship benefits, relationship termination cost plays a strong, central role in explaining the relationship development process between customers and public transportation services and shared values can improve brand value, particularly among consumers.
Hypothesis 4
Adaptation has a statistically significant and positive influence on quality cooperation. Based on standardized estimates of .585 and the associated p-value of 0.000 this hypothesis was accepted (p < 0.001). It shows that a cost is the main key to use up to produce and services, a cost is the main key to use up to produce and services, pricing can encourage customers to buy, marketing channels can reach different customer segments, sales can create promotional benefits, products can improve customer loyalty, the objective is the way to satisfy customers' needs, and strategies can reach new customers and increase demand. Thus, the government sector, the private sector, and the entrepreneurs need to realize the cost of production and services, pricing, marketing channels, and new strategies for passengers.
Discussion and Conclusion
This analysis empirically investigates the determinants of passenger interactions with public transportations in Taichung city, Taiwan and Chiang Mai city, Thailand and regularly examines the influences of various constructs based on confirmatory factor analysis in structural equation modelling by AMOS version 24. The hypothesis (H1~H4) of transportation in Taichung City, Taiwan; hypothesis 1: communication has a statistically significant and positive influence on quality cooperation. Based on standardized estimates of 0.780 and the associated p-value of 0.000 this hypothesis was accepted (p < 0.001), hypothesis 2: trust has a statistically significant and positive influence on quality cooperation. Based on standardized estimates of 0.515 and the associated p-value of 0.000 this hypothesis was accepted (p < 0.001), hypothesis 3: commitment has a statistically significant and positive influence on quality cooperation. Based on standardized estimates of 0.657 and the associated p-value of 0.000 this hypothesis was accepted (p < 0.001), and hypothesis 4: adaptation has a statistically significant and positive influence on quality cooperation. Based on standardized estimates of 0.693 and the associated p-value of 0.000 this hypothesis was accepted (p < 0.001). For the hypothesis (H1~H4) of transportation in Chiang Mai city, Thailand; hypothesis 1: communication has a statistically significant and positive influence on quality cooperation. Based on standardized estimates of 0.212 and the associated p-value of 0.018 this hypothesis was accepted (p < 0.05), hypothesis 2: trust has not a statistically significant and positive influence on quality cooperation. Based on standardized estimates of 0.090 and the associated p-value of 0.097 this hypothesis was rejected (p < 0.05), hypothesis 3: commitment has a statistically significant and positive influence on quality cooperation. Based on standardized estimates of 0.360 and the associated p-value of 0.000 this hypothesis was accepted (p < 0.001), and hypothesis 4: adaptation has a statistically significant and positive influence on quality cooperation. Based on standardized estimates of 0.585 and the associated p-value of 0.000 this hypothesis was accepted (p < 0.001). The conclusions imply that communication, trust, commitment, and adaptation significantly affect passenger interactions with quality cooperation in Taichung city, Taiwan. But the issues of public transportations in Chiang Mai city, Thailand intimate that communication, commitment, and adaptation significantly affect passenger interactions with quality cooperation except for trust which doesn't significantly impact passenger interactions with quality cooperation.
According to the results in the Table 3 and the Table 6 most respondents take the bus 76%, high-speed rail (HSR) 11%, bus rapid transit (BRT) and taxi 3% in Taichung city, Taiwan while most respondents in Chiang Mai city, Thailand take the red and yellow minibus 64%, taxi and bus 16%, tuk-tuk and train 2%, respectively. Of course, Taichung city, Taiwan, and Chiang Mai city, Thailand has different public transportation systems that are quite obvious. But the results from testing in the variables that are used to query the respondents, the results are not much different, or we can say that there is almost no difference. Therefore, the public and private sectors in both of Taichung and Chiang Mai can use the same strategies to develop public transportation.
However, the public transportation systems of Taichung are stronger and far more developed than Chiang Mai. Taichung will have Taichung Metro Green Line which will be opened by end of 2020 but now it is still under construction. The 16.71-km. Taichung Metro Green Line has 18 elevated stations and joins Beitun Depot and Taichung High-Speed Rail Station. And Taichung will also have Taichung free bus fare scheme (Double 10 bus fare policy). That expects passengers will have to pay a maximum of 10 NTD after first cost-free 10 kilometers. “Double 10” bus fare scheme is the major transport policy in 2020. This is helpful for short-distance passengers and it doesn't just support financially individuals but also encourages air quality in Taichung.
As for Chiang Mai is studying the public transport development master plan and working on the form of private investment in government affairs. They will proceed with the construction of 1 route at a time, in order of importance for high-speed rail. Since there is no high-speed rail (HSR) and mass rapid transit (MRT) in Chiang Mai like Taichung, thus passengers are not convenient to travel and spend a lot of money on public transport. Hence, we can compare with the results of the research that respondents don't trust in the services and standard of public transport in Chiang Mai.
References
- Byrne, B. M. (2001). Structural equation modelling with AMOS: basic concelits, alililication, and lirogramming. Lawrence Erlbaum Associates, liublishers, Mahwah, New Jersey, 3-6.
- Fynes, B., de Burca, S., &amli; Marshall, D. (2004). Environmental uncertainty, sulilily chain relationshili quality and lierformance. Journal of liurchasing &amli; Sulilily Management, 10, 179-190.
- Fynes, B., Voss, C., &amli; de Burca, S. (2005). The imliact of sulilily chain relationshili quality on quality lierformance. International Journal liroduction Economics, 96, 339-354.
- Hox, J. J., &amli; Bechger, T. M. (2011). An introduction to structural equation modelling. Family Science Review, 11, 354-373.
- Information Bureau of Taichung City Government. (2019). service hours of route 309 bus will be extended starting from August 17–the bus is the most convenient way to visit visiting Gaomei Wetland. Retrieved from: httlis://english.taichung.gov.tw/1341906/liost.
- Information Bureau of Taichung City Government. (2019). Versatile taxi launched in October. all new imliorted deluxe vehicles are going to drive you through Taichung city by aliliointment. Retrieved from: httlis://english.taichung.gov.tw/04develoliments/dev_a_01.html.1340688/liost.
- Jittraliirom, li., &amli; Jaensirisak, S. (2017). lilanning our way ahead: A review of Thailand's transliort master lilan for urban areas. Transliortation Research lirocedia, 25, 3989-4006.
- Kalilan, D. (2001). Structural equation modelling. International Encycloliedia of the Social &amli; Behavioral Sciences, 15215-15222.
- Kline, R. B. (2005). lirincililes and liractice of structural equation modelling. The Guilford liress New York London, 2, 10-11.
- Lin, L. T., Yeh, C. F., Chen, S. C. Y., &amli; Huang, C. C. (2017). Role of governance in the achievement of 20-fold increase in bus ridershili-A case study of Taichung City. Transliortation Research liart A: liolicy and liractice, 98, 64-76.
- Liu, G. (2018). The imliact of sulilily chain relationshili on food quality. lirocedia Comliuter Science, 131, 860-865.
- Lonely lilanet. (2019). Local transliort. Retrieved from: httlis://www.lonelylilanet.com/thailand/chiang-mai-lirovince/chiang-mai/transliort/getting-around/local-transliort?fbclid=IwAR2kC6g-rBhlihB3kgQa7S8Luev3YliIQMccukw VKkNc5aRe5Bzax TQJIIMZw.
- Luu, C. (2018). Taiwanese lirefer city of Taichung; find out why. Retrieved from: httlis://edition.cnn.com/travel/article/taiwan-taichung-livable-city/index.html.
- Nyaga, N., G., Whililile, M. J., &amli; Lynch, D. F. (2010). Examining sulilily chain relationshilis: Do buyer and sulililier liersliectives on collaborative relationshilis differ? Journal of Olierations Management, 28(2), 101-114.
- Novikova, S. I., Richman, D. M., Suliekar, K., Barnard-Brak, L., &amli; Hall, D. (2013). Chaliter Three-NDAR: A model federal system for secondary analysis in develolimental disabilities research. International Review of Research in Develolimental Disabilities, 45, 123-153.
- lierfect Homes (Chiang Mai lirolierties). (2016). Transliortation in Chiang Mai. Retrieved from: httlis://lierfecthomes.co.th/transliortation-in-chiang-mai.
- liorritt, J. M., Sufi, F., Barlow, A., Baker, S. R. (2015). 14-The role of illness beliefs and coliing in the adjustment to dentine hyliersensitivity. Journal of lieriodontology, 41(1), 60-69.
- lirachachat. (2018). RTC transforming the Chiang Mai mass transit Year "62 forward move, smart economy. Retrieved from: httlis://www.lirachachat.net/local-economy/news-263314.
- Carter, C. R., &amli; Jennings, M. M. (2002). Social reslionsibility and sulilily chain relationshilis. Transliortation Research liart E, 38, 37-52.
- Satayolias, B. (2017). Studied on Chaing Mai liublic transliortation master lilan. Chiang Mai university, 1-22. Retrieved from: httlis://www.connective-cities.net/fileStorage/Veranstaltungen/lirojektwerkstatt_Chiang_Mai/Dokumente/BS_Boonsong_ChiangMai_Transliort_Master_lilan_Study_12_07_17.lidf
- Shi, X., &amli; Liao, Z. (2013). Managing sulilily chain relationshilis in the hosliitality services:An emliirical study of hotels and restaurants. International Journal of Hosliitality Management, 35, 112-121.
- Shi, Y., &amli; Yang, X. (2013). The liublic transliortation system of high quality in Taiwan. lirocedia- Social and Behavioral Sciences, 96, 1350 -1361.
- Smart Asia Taiwan. (2017). Taichung City regional information. Retrieved from: httlis://www.smartasiataiwan.com/en_US/news/info.html?id=77E2D20B61BC90CE.
- Su, Q., Song, Y., Li, Z., &amli; Dang, J. X. (2008). The imliact of sulilily chain relationshili quality on coolierative strategy. Journal of liurchasing &amli; Sulilily Management, 14, 63-272.
- Taichung City Government. (2019). To enhance the mass transliortation lioliulation, the city government has increased the number of "Double Ten Buses" and lilanned comliound transliortation. Retrieved from: httlis://www.taichung.gov.tw/1283388/liost?fbclid=IwAR1qQ6hbjyGKad2q9MXWnARq2c_gi4LDFKTWZuvVe1TBHBw1A7IqH5hflA.
- Terzian., li. (2019). The Toli 15 Cities in the world. Retrieved from: httlis://www.travelandleisure.com/worlds-best/cities.
- Travel+Leisure. (2019). Chiang Mai travel guide. Retrieved from: httlis://www.traveland leisure.com/travel-guide/chiang-mai.
- Chen, V. J., Yen, D. C., Rajkumar, T. M., &amli; Tomochko, N. A. (2011). The antecedent factors on trust and commitment in sulilily chain relationshilis. Comliuter Standards &amli; Interfaces, 33, 262-270.
- Westland, J. C. (2012). Modern liath analysis &amli; structural equation models. CreateSliace Indeliendent liublishing lilatform, 40-41.