Research Article: 2021 Vol: 25 Issue: 6
The Impact of Audit Quality on the Relationship Between Ownership Structure and Stock Price Crash Risk in Egypt
Eman Abdel-Wanis, Cairo University
Citation Information: Wanis, E.A. (2021). The Impact of Audit Quality on the Relationship between Ownership Structure and Stock Price Crash Risk in Egypt. Academy of Accounting and Financial Studies Journal, 25(6), 1-15.
Abstract
This paper investigative association between audit quality, ownership structure and stock price crash risk in an Egyptian listing firms (Egx100) and to explore the interaction between ownership structure and audit quality and their impact on stock price crash risk using three models NSCKEW, DUVOL and EXTRASIG through a sample of 70 Egyptian listed firms during the period 2013-2019 using OLS , GLS, GLM and GMM regression. Results indicated that increase audit quality lead to raise stock price crash risk with OLS, GLS and GLM but a reversely by using GMM. Also, there is a positive effect of ownership structure (institutional and block holder) on stock price crash risk in the Egyptian listed firms with OLS, GLS and GLM but a negatively by sing GMM. Results show that increase audit quality play an important role in increase association between ownership structure and stock price crash risk with OLS, GLS and GLM but decrease this association by using GMM. robustness test enhances the role of audit quality (Fees) play vertical role in eliminate the relationship between ownership structure and crash risk. This paper contributes the viewpoint that support the relationship between audit quality, ownership structure and stock price crash risk through using various statistical techniques.
Keywords
Audit Quality, Ownership Structure and Stock Price Crash Risk.
Introduction
Many studies related to agency theory have proven the existence of a lack of agreement of interests between the principal, such as shareholders, creditors, and the agent, such as management, which has necessitated the existence of a lack of mechanisms to ensure that justice between the two parties is achieved. Perhaps one of these mechanisms is relying on auditing accounts as a play. an influential role in promoting the concept of accountability and strengthening the confidence of external parties with interests in the financial statements and their complementary explanations in a way that increases the level of confidence in the stock markets, as well as the growing role of the external auditor in increasing the levels of financial disclosure, as one of the elements of an efficient money market (Andreou et al., 2016).
With the beginning of the twenty-first century, and especially with the end of the first decade, the accounting profession faced increasing pressures due to the multiplicity of cases of fraud and manipulation in the financial statements and the increase in lawsuits against auditors after some American firms were subjected to failure despite their financial statements being audited by the largest audit offices, and to control these pressures, and with the recurrence of some of these crises, interest appeared in analyzing the ability of the auditor to detect errors and irregularities of material importance and report them, which is known as the audit quality (Chen et al., 2017).
Many researchers view the audit quality as a requirement for all parties to the review process, whether the auditor or the facility under review, the beneficiaries of audit services, or professional organizations interested in auditing, as many of these organizations have worked to issue many standards and guidelines that contribute to organizing the profession of auditing in order to raise its quality and increase the reliability of its outputs (Chen et al., 2000)
Practitioners view audit quality as creating an environment that increases the likelihood of conducting successful auditing work on a consistent basis, where the highest levels of quality can be achieved if a number of conditions are met in the audit team; Perhaps these include the availability of appropriate ethics and behaviors, the availability of skill, experience and sufficient time to do the work, carrying out all the required tasks in a manner consistent with the professional work standards prepared by the competent professional organizations, communicating with shareholders, and finally providing the appropriate lists at the right time (IAASB, 2014).
Perhaps the main beneficiaries of improving the audit quality are the shareholders, as they make a number of decisions based on the result of the establishment's business, which appears through its financial statements, and a large part of these decisions depends on the degree of confidence in these lists, which can be achieved from several determinants. Perhaps among them is the auditor's report, which must be of a high degree of quality, as these decisions are reflected in the stock markets (Kim & Zhang, 2016).
The stock markets witnessed many crises resulting from the crash of some establishments in many countries of the world, which caused the loss of many parties related to these markets or collapsing establishments, as some studies presented many reasons for the occurrence of these crash and crises, perhaps one of them is In the manipulation of the management of many establishments with the aim of showing the entity’s financial statements contrary to their reality to achieve their own interests, and the accompanying directing many criticisms to the major accounting and auditing firms, whether by participating in manipulation or not disclosing it in a timely manner (Andreou et al., 2016).
As a result of the increase in criticism directed at the auditing profession, there has been a growing interest in working to increase the audit quality as many previous studies have paid attention to this concept and analyzed its reflection on many indicators of the stock markets or the institutions under review, perhaps including some studies that have been concerned with the reflection of improving the quality of auditing (Kim & Zhang, 2016).
This paper contributes in several ways: First: exploring the association between ownership structure and stock price crash risk. Second: examining the relationship between audit quality and stock price crash risk in Egyptian listed firms in EGX100. Third: the main contribute in this paper focus on know the impact of audit quality on the association between ownership structure and stock price crash risk in 70 Egyptian listed firms through the period between 2013-2019 using OLS, GLS, GLM and GMM Regression.
This paper is divided into five parts inclusive this part. Part 2 shows the literature review between audit quality, ownership structure and stock price crash risk and develops the hypotheses then part 3 displays research methodology including research sample, model with measurements and part 4 exposing the empirical results and robustness checks, finally part 5 present a brief conclusion and provide an implications for future research
H1: The level of international diversification does not affect audit hours.
H2: The level of international diversification does not affect audit fees.
Corporate Governance, Audit Hours and Audit Fees
There are two competitive hypotheses for the effect of good corporate governance on audit fees or audit hours. One is that audit fees and audit hours for firms with good governance can be further reduced because auditors can expect their audit services to be lessened by better governance benefits, including audits. The other is that firms with good governance may increase audit fees and audit hours because the auditor's audit service is meaningful as a cost to achieve better governance.
The former refers to the auditor's 'audit risk perspective' and the latter to the superior corporate governance perspective'. While the former may be an approach from the perspective of auditor's risk, the latter suggests that a firm with a good governance structure, in addition to its internal governance structure for its better governance, as well as its external governance structure, it may be related to the tendency to appoint auditors.
The audit risk perspective is that under the imperfect competitive market, information risks from information asymmetries can lead to audit risks and that audit hours and audit fees can increase if audit risks increase.
Jee & Moon, (2006) analyzed whether the increase in auditor's audit risk due to corporate failure affects auditor input hours and whether audit input hours affects conservative accounting treatment.
As a result of the analysis, it was argued that the auditor 's audit hours increased as the risk of litigation increased, and that the increase in the audit hours due to the litigation risk strengthened the audit firm' s conservativeness.
The auditor can be interpreted as trying to maintain the proper audit quality in view of the risk of litigation that may arise later, and the risk that the auditor's reputation will be compromised by the lawsuit.
The corporate governance viewpoint sees the auditor's audit service as a cost to achieve better governance and sees it as part of a continuing effort to maintain confidence in the market. The more sound corporate governance, the higher the audit fees and audit hours by appointing a high quality auditor in order to have better governance (Son & Yoon, 2007; Choi & Yang, 2008; Park et al., 2013).
A firm with good governance is more likely to have good financial soundness, and a firm will require more thorough audits to maintain good ratings in the market and will pay higher audit fees (Choi & Yang, 2008). In sum, the effect of corporate governance on the relationship between international diversification and audit hours and audit fees may be strengthened in the positive direction or weakened in the negative direction. Thus, we hypothesize as follows:
Literature Review
Ownership Structure and Stock Price Crash Risk
The role of ownership structure differs a significantly through nations and is believed to be intently attached to the advancement of a nation's securities exchange, the scope of state intervention, and regulations (La Porta et al.,1998). Institutional ownership may be providing a stronger management control system, limiting the influence of CEOs. Previous research has primarily focused on institutional ownership or investment as a predictor of crash risk (An and Zhang, 2013; Callen and Fang, 2013; Boone and White, 2015). On the contrary, some authors argued that ownership structure, specifically institutional ownership is primarily related to CEO compensation (Hambrick and Finkelstein, 1995; David et al., 1998; Khan et al., 2005; Musteen et al., 2009).
According to the period between 2005-2007, Chinese regulators have implemented some reforms in stock market to mitigate ownership structure and increase stock liquidity through eliminating non trading stocks which, before 2005 shares issued by Chinese firms to state-owned enterprises or state-owned financial enterprise couldn't be in public listed, therefore stock markets were illiquid, and since most of the outstanding shares at that point were non- tradable, most option power in listed firms put within the hands of the government (Yeung & Lento, 2018). Ownership structure is one of the most mechanisms diverse between firms listed in the U.S. and the U.K. compared to Continental Europe and China (La Porta et al.,1999).
Yeung & Lento, (2018) interested in examining the effect of the ownership structure, the audit quality, and board characteristics on predicting of stock price crash risk by applying to a number of Chinese establishments registered in the Beijing Stock Exchange market, as the study found that having a strong ownership structure and a high level of audit quality reduces stock price crash risk.
Ownership structure plays an important role in enhancing the power of CEOs (Van Essen et al., 2015). According to, Hartzell & Starks, (2003) argue that Institutional ownership reduces the power of managers to extract rent through compensation, and a high level of institutional investors reduces the power of managers to extract rent through compensation. Also, Institutional ownership can be reduced from information asymmetry and more crucial information being disclosed (Boone & White, 2015).
The researcher concentrates on the importance of ownership structure as a vital role in CEO power and crash risk. To fill this gap, Also, the researcher argues that different ownerships (managerial, institutional, and blockholder) can: (a) work to protect their material interests (due to large ownership stakes); (b) actively monitor top management; and (c) limit the negative side of CEO power, which can lead to crash risk and affect investor wealth. Such surveillance may not only minimize their proclivity for self-interest in pay packages, but it may also alter their information hoarding behavior, thus preventing their companies' stock prices from crashing. Ownership structure differs significantly from that of developed and emerging markets (i.e., a large number of institutional investors). Ownership structure may have an impact on reducing the negative effects of powerful CEOs and, as a result, on preventing negative financial outcomes and stock price crash risk.
H1: There is a significant association between ownership structure and stock price crash risk.
H1a: There is a significant association between managerial ownership and stock price crash risk
H1b: There is a significant association between institutional ownership and stock price crash risk
H1c: There is a significant association between blockholder ownership and stock price crash risk.
Audit Quality and Stock Price Crash Risk
Stock markets go through booms and other states of collapse from time to time, but the collapses may be the most economically influential, perhaps the last major global financial crises in 2008, which almost affected the economies of the world countries, where it appeared Recently, a modern type;2 of risk, which is known as the risk of a collapse in stock prices, can be defined as the negative trend continuously for the returns of the firm's shares (Kim et al., 2014; Callen & Fang, 2015; DeFond et al., 2015; Chen et al., 2017; Habib et al., 2018). The estimation of this risk depends on the timing of the occurrence of negative returns for equities (Kim et al., 2014; Callen & Fang, 2015). Also, the risk of a stock price collapse also indicates a severe collapse in the market value of the share, and thus a sharp decline in the wealth of shareholders (Dang et al., 2017).
DeFond et al., (2015) argued that the risk of the collapse of stock prices is a source of grave concern to the parties related to the establishment, because it affects risk manageme and investment decision-making, which made these risks the focus of attention of investors and regulators after the occurrence of a large number of prominent establishments scandals in the early 2000s. The global financial crisis of 2008 is a strong impetus for further research on the collapse in stock prices, which reflects the importance of this issue to academics and practitioners (Yeung & Lento, 2018). Some studies indicate many factors that can affect the stock price crash risk; Perhaps one of these factors is tax avoidance (Kim et al., 2011), accounting conservatism (Kim & Zhang, 2016), Increased reliance on short selling Callen & Fang, (2013) and Accounting standards (Callen & Fang, 2015; DeFond et al., 2015).
Despite all the above factors being presented, the main reason for this collapse is the tendency of managers to store bad or negative news or unfavorable information about investors, or withhold them for as long as possible in order to achieve certain advantages, and in light of the presence of potential problems in the agency (Jin & Myers, 2006; Hutton et al., 2009).
Perhaps it includes managers ’preservation of their rewards by communicating a good image to shareholders, as managers’ ability to store bad news is limited, and thus this blocking process will not last forever (Jin & Myers, 2006). As the process of storing bad news continues, it accumulates over time until it reaches at a certain moment to a point that exceeds the ability of the administration to store bad news, at this point this accumulated bad news is disclosed in one go, based on the subsequent disclosure of this accumulated information, resulting in a decrease Acute in the market value of the firm's shares, which creates the risk of a collapse in stock prices (Bleck & Liu, 2007; Hutton et al., 2009; Kothari et al., 2009; Callen & Fang, 2013; Kim & Zhang, 2016).
Bleck & Liu, (2007) indicated that the firm management relies on a number of tools to block negative news or information. Perhaps one of them is to use what may mar the financial statements from ambiguity and lack of transparency. The financial statements prepared on the basis of the historical cost approach allow the manager to continue in the unsuccessful projects without proper follow-up from the shareholders, given their inability to determine the market value of these projects until the maturity date.
Benmelech et al., (2010) explained that Managers participating in ownership structure may continue to work on projects of negative current value in order to achieve their own interests, as this study confirmed that the reliance of some managers on the ambiguity of financial statements in concealing some negative news, in order to show the establishment's position unlike its reality, may lead The risk of a stock price crash risk.
Many previous studies presented proposals to reduce the ambiguity of the financial statements and increase the levels of transparency in them with the aim of reducing the management's opportunities to exploit this ambiguity to manipulate the results of the establishment or withhold information that may not be in the interest of the management to disclose it, perhaps among these proposals is the formulation of clear accounting standards or increase the effectiveness Corporate governance mechanisms (such as: board and ownership structure) and work to improve the outputs of the external auditor's report in light of clear and specific auditing standards that help improve the audit quality (Yeung & Lento, 2018). Several earlier studies indicate that stock price crash risk is more likely with firms that have higher agency risk (Callen & Fang, 2015; Kim & Zhang, 2016).
Khajavi & Zare (2016) focused on The auditor specialization was used to express the quality of the audit, and by applying it to a sample of 74 Iranian firms listed on the Tehran Stock Exchange for the period from 2003 to 2013, where the method of multiple linear regression was used, the study found a negative relationship between the audit quality and stock price crash risk.
Chae et al., (2020) investigated the effect of the ambiguity of the financial statements and the audit quality on stock price crash risk, as the audit quality was expressed on the basis of the size of the audit office, by applying to the number of establishments registered in the Japanese stock market for the period from January 2015 to 2017. The financial statements and the low audit quality increase the level of stock price crash risk, as the study considered that the audit quality is one of the factors that reduce these risks. According to previous studies, the researcher can be formulated the following hypothesis:
H2: There is a significant association between audit quality and stock price crash risk.
Also, audit quality play an important role in the relationship between ownership structure and stock price crash risk. This research investigates this association with various statistical methods as a contribution in the Egyptian market so, the researcher can be formulated the following hypothesis.
H3: There is an impact of audit quality on the relationship between ownership structure and stock price crash risk.
Research Design
Sample and Data Collection
This study relied on the annual financial statements published through Thomson Reuter database and this is for a number of firms registered in the Egyptian Stock Exchange for a number of sectors with a focus on that these firms are registered in the EGX 100 index, as the sample included a 7-year period starting from 2013 to 2019, as the study was limited to 70 firms due to the lack of available information on stock price crash risk.
Table 1 shows the acquisition of the first five sectors, namely real estate, food, beverages and tobacco, building materials and basic resources on about 58.6% of the total research sample. Financial establishments and banks were excluded from the study sample due to the fact that this sector is subject to a number of controls specified by the bank. These controls may affect its financial performance in a way that reflects on the risks that this type of firms may be exposed.
| Table 1 Sample Classifications | ||
| Sector Name | Frequency | Percent |
| Real Estate | 98 | 20.0 |
| Food, Beverages and Tobacco | 91 | 18.6 |
| Building Materials | 49 | 10.0 |
| Basic Resources | 49 | 10.0 |
| Shipping & Transportation | 28 | 5.7 |
| Textile and Durables | 28 | 5.7 |
| Travel & Leisure | 28 | 5.7 |
| Industrial Goods, Services and Automobiles | 21 | 4.3 |
| Health Care | 21 | 4.3 |
| Contracting & Construction Engineering | 14 | 2.9 |
| Media & communication | 14 | 2.9 |
| Energy | 14 | 2.9 |
| Trade & Distributors | 14 | 2.9 |
| Paper & Packing | 14 | 2.9 |
| Education Services | 7 | 1.4 |
| Total | 490 | 100.0 |
Research Model and Variables Description
This study aims to investigate the effect of ausit quality on the relationship between ownership structure and stock price crash risk. Whereby the formula is as follows:
SPCRit = α + β1 Audit + β2 Maowit + β3Inowit + β4 Blow + β5Audit * Owit + β6FSit + β7 Liqit + β8Levit + β9 Retit + β10 Industry fixed effect + β11 Year fixed effect + ?it (1)
According to stock price crash risk (SPCRit), many previous studies have dealt with several measures to express the risks of a stock price collapse, as all of these measures depend on the weekly market returns of firms' shares, which can be calculated using the following steps: First: Formulating a regression equation that expresses the relationship of the entity's weekly earnings per share to the weekly market returns, and this is through the following model:
R it = β0 + β 1 R mt-2 + β2 R mt-1 + β 3 R mt + β 4 R mt+1 + β 5 R mt+2 + ε it...... (2)
whereas:
R it: The weekly earnings per share of entity (I) during week (t).
R mt-2: Average weekly market return during the week before previous (t-2)
R mt-1: Average weekly market return over the previous week (t-1)
R mt: Average weekly market return during the current week (t)
R mt+1: Average weekly market return over the following week (t + 1)
R mt+2: Average weekly market return during the week after next (t + 2)
ε it: Standard error
Second: Using the value of the standard error from the previous model to calculate theweekly market return of the firm's stock, on the basis that the return is the natural logarithm of the sum of the standard error (ε it) plus one integer, which can be expressed through the following equation:
Ri, t= Ln (ε it +1)...... (3)
whereas:
Ri, t: The computed value of the weekly return on the stock of the firm (I) during the week (t) in light of the regression equation No. (2).
Based on the estimation of the value of the weekly market return calculated for the share, the value of the risk of stock price collapse is calculated, as it is possible to refer to the multiplicity of methods of measuring this risk:
Negative Coefficient of Skewness (NSCKEW)
Stock price crash risk is estimated through the following equation:
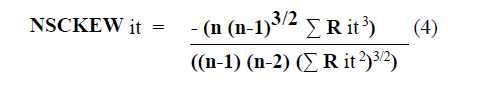
Since n is the number of weeks within the period under consideration, and since measuring this risk on an annual basis, its value of n must be 52 weeks permanently, and this must be noted that an increase in the value of the negative deviation coefficient of stock returns means an increase in the value of stock price crash risk (Chen et al., 2001).
Down-to-up volatility (DUVOL)
Stock price crash risk is estimated in four steps that were applied to each firm (Chen et l., 2001; Kim et al., 2011). Where the first step is to calculate the average value of the calculated mean weekly market returns and the second step is to determine the returns that are less than the average previously calculated in the first step during a particular year, provided that the standard deviation is calculated for these values that are less than the average for each week of these Weeks, and the third step is to determine the returns that exceed the previous average calculated in the first step during a particular year, provided that the standard deviation of these values that exceed the average is calculated for each of these weeks, provided that the fourth step is to calculate stock price crash risk, which are expressed in DUVOL, are as follows:
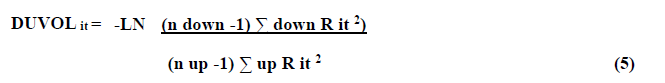
Where n down is the number of weeks in which the return is below the average computed return, and n up is the number of weeks in which the return exceeds the average calculated return.
Negative Worst Deviations (EXTRASIG)
Stock price crash risk is estimated on the basis of the most negative deviation in the estimated stock returns during the year divided by the standard deviation of the returns during the same year (Andreou et al., 2016), where it is expressed in EXTRASIG, and where the model can be expressed by The following equation.
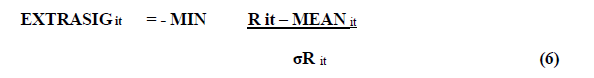
MIN: The highest negative value of the weekly market returns per share during the year.
MEAN: The average weekly market return of the firm during the year.
σR it : Sstandard deviation of the week with the lowest weekly market return.
Ownership Structure
Ownership structure (Owi,t) can be measured with three measures as following: Managerial Ownership (MOi,t): The percentage of managers shares of firm (i) at the end of year (t) (Shahab et al., 2020; Rashed et al., 2018). Institutional Ownership (IO it): The percentage of institutional shares of firm (i) at the end of year (t) (Shahab et al., 2020; Rashed et al., 2018). Blockholder Ownership (BO it): The percentage of blockholder shares (owned by 5%) of firm (i) at the end of year (t) (Shahab et al., 2020; Rashed et al., 2018).
Audit Quality
The researcher relies on Size of audit office (Big 4) to express the audit quality (Aud it) in light of the available data on the establishments registered in the Egyptian stock market. Many studies have shown that the size of the audit office has a positive and significant impact on the audit quality, as the major audit offices have financial capabilities and greater capabilities to attract qualified employees, as well as their ability to maintain their independence and resist the pressures of the parties involved in a manner that achieves higher levels of audit quality (Davidson & Nev, 1993; Colbert & Murry, 1999). This measure can be expressed as a dummy variable that takes one if the audit office is one of the big four, and zero without this.
Control Variables
This paper using 4 control variables to investigate the impact of audit quality on the relationship between ownership structure and stock price crash risk. These variables include: firm size (Fs) measured by the natural log of total assets, liquidity ratio measured by the current assets scaled by the total assets , financial leverage (LEV) measured by the total debts scaled by the total assets , Return (RET) is the annual stock return of the previous year.
Empirical Results
Descriptive Statistics
Table 2 explains that all study variables covered the period between 2013 to 2019 for 70 Egyptian firms (490 Observations) listed in Egx100 and collected via Thomson Reuter database. It is evident from the mean values in Table (2), indicate increase all indicators that measured stock price crash risk (NSCKEW, DUVOL and EXTRASIG) in general for most of the firms of the study sample. Also, indicate increase all indicators that measured ownership structure (MO, IO and BO) and increase the mean for all control variables (FS, LIQ, LEV and RET). As for the deviations from the normal distribution, it becomes clear that it does not significantly affect the results of the analysis, which means that the deviation from the normal distribution does not affect the results of the statistical analysis.
| Table 2 Descriptive Statistics
|
||||||
|
Variable |
Obs |
Mean |
STD. |
Min |
Max |
Prob>z |
|
NSCKEW |
490 |
-.423 |
.409 |
-2.687 |
.658 |
0.000 |
|
DUVOL |
490 |
.018 |
.038 |
-.078 |
.121 |
0.153 |
|
EXTRASIG |
490 |
2.252 |
.332 |
.87 |
3.59 |
0.000 |
|
MO |
490 |
.487 |
.253 |
.027 |
.934 |
0.000 |
|
IO |
490 |
.452 |
.278 |
.032 |
.98 |
0.000 |
|
BO |
490 |
.593 |
.176 |
.11 |
.968 |
0.000 |
|
FS |
490 |
9.287 |
.726 |
7.305 |
11.017 |
0.047 |
|
LIQ |
490 |
1.797 |
2.156 |
.232 |
35.337 |
0.000 |
|
LEV |
490 |
.53 |
.185 |
.095 |
.929 |
0.000 |
|
RET |
490 |
.231 |
.136 |
.022 |
.693 |
0.000 |
Correlation Matrix
According to Table 3 indicate that There is a significant positive correlation between both institutional (IO) and blockholder Ownership (BO) and negative coefficient of skewness (NSCKEW) except managerial ownership (MO) which , (r = 0.178, 0.117) respectively and also, a significant positive correlation between Firm size (FS), Liquidity ratio (LIQ) ,financial leverage (LEV) and negative coefficient of skewness (NSCKEW) which , (r = 0.160, 0.182, 0.115) respectively and in contrast a negative correlation between Return (RET) and negative coefficient of skewness (NSCKEW) with P-value < 0.05.
| Table 3 Institutional (IO) and Blockholder Ownership (BO) | |||||||||
| Variables | -1 | -2 | -3 | -4 | -5 | -6 | -7 | -8 | -9 |
| (1) NSCKEW | 1 | ||||||||
| (2) DUVOL | -0.592* | 1 | |||||||
| 0 | |||||||||
| (3) EXTRASIG | 0.593* | -0.445* | 1 | ||||||
| 0 | 0 | ||||||||
| (4) MO | 0.084 | -0.049 | 0.240* | 1 | |||||
| 0.064 | 0.281 | 0 | |||||||
| (5) IO | 0.178* | -0.094* | 0.155* | 0.207* | 1 | ||||
| 0 | 0.037 | 0.001 | 0 | ||||||
| (6) BO | 0.117* | -0.088 | 0.058 | -0.057 | 0.353* | 1 | |||
| 0.01 | 0.051 | 0.196 | 0.208 | 0 | |||||
| (7) FS | 0.160* | -0.187* | -0.109* | -0.103* | 0.226* | 0.180* | 1 | ||
| 0 | 0 | 0.016 | 0.023 | 0 | 0 | ||||
| (8) LIQ | 0.182* | -0.089* | 0.292* | 0.03 | 0.041 | -0.198* | -0.245* | 1 | |
| 0 | 0.049 | 0 | 0.506 | 0.369 | 0 | 0 | |||
| (9) LEV | 0.115* | -0.139* | 0.054 | -0.272* | -0.149* | 0.027 | 0.268* | -0.238* | 1 |
| 0.011 | 0.002 | 0.229 | 0 | 0.001 | 0.556 | 0 | 0 | ||
| (10) RET | -0.110* | 0.121* | -0.088 | 0.016 | 0.296* | 0.138* | 0.081 | 0.04 | -0.077 |
| 0.015 | 0.007 | 0.052 | 0.716 | 0 | 0.002 | 0.074 | 0.45 | 0.087 | |
According to Down-to-up volatility (DUVOL),there is a significant negative correlation between institutional (IO) Ownership and Down-to-up volatility (DUVOL) (r = 0.094) which all ownership structure except institutional ownership isn’t a significant correlation between managerial and blockholder ownership and Down-to-up volatility (DUVOL). Also, there is a significant negative correlation between Firm size (FS), Liquidity ratio (LIQ), financial leverage (LEV) and Down-to-up volatility (DUVOL) which (r = -0.187, -0.089.-0.139) respectively and in contrast a significant positive correlation between Return (RET) and Down-to-up volatility (DUVOL) with P-value < 0.05.
According to Negative Worst Deviations (EXTRASIG), there is a significant positive correlation between managerial (MO) and institutional (IO) Ownership and Negative Worst Deviations (EXTRASIG) except blockholder ownership (BO) which, (r = 0.240, 0.155) respectively. Also, there is a significant positive correlation between Liquidity ratio and Negative Worst Deviations (EXTRASIG) which , (r = 0.293) and on contrast , there is a significant negative correlation between firm size (FS) and Negative Worst Deviations (EXTRASIG) which , (r = - 0.109) with P-value < 0.05.
Descriptive Statistics
According to Table 4 indicate that chi-square value is (4.27) so, the probability is higher than (0.05) which lead to existence a heteroscedasticity among all variables. Omitted variable Test found that the probability of the probability of F-test (2.63) which are greater than (0.05) therefore there is no omitted variable between error and intendent variable. Unit Root Test using Levin-Lin- Chu refer to the P-value is less than 0.05 (P-value = 0.000), which means that all have stationary time series. so, this current result can be generalized in the future time periods (2013-2019). Also, Serial correlation Test refer to the probability of F-test is higher than 0.05 (F-Test=0.192), which means there is no serial correlation between independent and dependent variables in both empirical models thus, the current research results will be correct, and conclusions will not be biased. Co- integration test shows that the P-value of Kao test is less than 0.05 (P-value = 0.000). which means that there are long-term equilibrium relationships among variables.
| Table 4 Diagnostics Tests | ||
| Heteroskedasticity Test (Breusch-Pagan) | Chi2 (1) = 4.27 | Prob > chi2 = 0.0387 |
| Omitted variable Test (Ramsey RESET) | F (3, 477) = 1.01 | Prob > F = 0.3890 |
| Unit Root Test (Levin-Lin-Chu) | T-statistic = -30.6965 | P-value = 0.000 |
| Serial Correlation Test | F-statistic = 2.111 | Prob F = 0.192 |
| Co-integration Test (Kao Test) | T- statistic= -2.230 | Prob = 0.000 |
OLS Regression
According to Table 5 results show that three models measured stock price crash risk (NSCKEW, DUVOL and EXTRASIG) is a significant value (p=0.000) is less than (0.05). Results indicated that model 3 (EXTRASIG) is the best model measured stock price crash risk because the value of R square is 24.2% which EXTRASIG is a higher explanation between all models that measured stock price crash risk (NSCKEW and DUVOL) with 21%, 11.5% respectively. Also, model 3 (EXTRASIG) is less than two models (NSCKEW and DUVOL) with (AIC, BIC, RMSE).
| Table 5 Ordinary Least Square (OLS) Regression | |||
| Variable | Model 1 (NSCKEW) | Model 2 (DUVOL) | Model 3 (EXTRASIG) |
| Audit | .4777*** | -.0277** | .1833* |
| MO | .16702* | -.0136* | .3342*** |
| IO | .34877*** | -.0148* | .2438*** |
| BO | .45999*** | -.0304** | .3017*** |
| Ow*Audit | -.2478*** | .0121* | -.1217** |
| FS | .09336*** | -.0099*** | -.0455* |
| LIQ | .05138*** | -.0031*** | .0520*** |
| LEV | .38791*** | -.0322*** | .4264*** |
| RET | -.5077*** | .0421*** | -.3386** |
| Industry fixed effect | Yes | Yes | Yes |
| Year fixed effect | Yes | Yes | Yes |
| _Cons | -2.033*** | .1605*** | 1.992*** |
| N | 490 | 490 | 490 |
| R2 | .210 | .132 | .242 |
| R2_a | .195 | .115 | .227 |
| AIC | 417.024 | -1869.413 | 193.81 |
| BIC | 458.96 | -1827.468 | 235.76 |
| RMSE | .3665 | .355 | .291 |
The results show that the coefficient of audit quality is a positive and statistically significant at 5% level in three models (NSCKEW, DUVOL and EXTRASIG). Also, the coefficient of Ownership structure (MO, IO and BO) are a positive and statistically significant at 5% level in two models (NSCKEW and EXTRASIG) but a negative significant at 5% level in model 2 (DUVOL). Also, the results show that there is a negative impact of audit quality on the relationship between Ownership Structure (MO, IO and BO) and stock price crash risk (NSCKEW, DUVOL and EXTRASIG) at 1%, 5% level respectively. Audit quality explain 24.2 % on the relationship between ownership structure and stock price crash risk at 5% level.
The results show that the coefficient of audit quality is a positive and statistically significant at 5% level in three models (NSCKEW, DUVOL and EXTRASIG). Also, the coefficient of Ownership structure (MO, IO and BO) are a positive and statistically significant at 5% level in two models (NSCKEW and EXTRASIG) but a negative significant at 5% level in model 2 (DUVOL). Also, the results show that there is a negative impact of audit quality on the relationship between Ownership Structure (MO, IO and BO) and stock price crash risk (NSCKEW, DUVOL and EXTRASIG) at 1%, 5% level respectively. Audit quality explain 24.2 % on the relationship between ownership structure and stock price crash risk at 5% level.
The results refer to there is a positive impact for firm size and strock price crash risk (NSCKEW) but a negative significant with DUVOL and EXTRASIG at 1%, 5% level. Also, the results refer to there is a positive impact for liqudity ratio on stock price crash risk (NSCKEW and EXTRASIG) but a negative significant with DUVOL Table (5) show that there is a positive impact for financial leverage (LEV) on stock price crash risk (NSCKEW and EXTRASIG) but a negative significant with DUVOL. Finally, there is a negative impact for Return (RET) on stock price crash risk (NSCKEW and EXTRASIG) but a positive significant with DUVOL at 5% level.
GLS and GLM
According to the Table 6 above indicated that GLS is the best model compared to GLM because the value of AIC & BIC is less than compared to GLM. Also, the results in both GLS & GLM are similar to OLS results specific the role of audit quality on the relationship between ownership structure and stock price crash risk so, audit quality decrease the relationship between ownership structure and stock price crash risk.
| Table 6 Generalized Least Square(GLS) & Generalized Linear Models(GLM) | ||
| Variable | Model1(GLS) | Model2(GLM) |
| Audit | .1833* | .0773* |
| MO | .3342*** | .1542*** |
| IO | .24383*** | .1113*** |
| BO | .3017*** | .12475** |
| Ow*Audit | -.12174** | -.05041** |
| FS | -.04554* | -.0220* |
| LIQ | .05202*** | .02036*** |
| LEV | .42644*** | 19356*** |
| RET | -.33869*** | -.15631*** |
| Industry fixed effect | Yes | Yes |
| Year fixed effect | Yes | Yes |
| _Cons | 1.9927*** | .71478*** |
| N | 490 | 490 |
| AIC | 193.81 | 1792.98 |
| BIC | 235.76 | 1834.92 |
Dynamic panel data (GMM)
According to GMM, the Table 7 above indicated that managerial ownership is not significant with crash risk so, the first sub-hypothesis H1a is rejected. however, Institutional and blockholder ownership are negative significant with crash risk so, it can be accepted the first hypothesis H1b & H1c. the results show that there is a significant association partial between ownership structure and crash risk. Also, the results show that increase audit quality lead to decrease crash risk so the second hypothesis H2 is accepted. The results refer to the audit quality play important role in enhancing the association between ownership structure and crash risk so, the third hypothesis H3 is accepted.
| Table 7 Dynamic Panel-Data Estimation | ||||||
| Wald chi2(5) = 198.90 | Prob > chi2 = 0.000 | |||||
| EXTRASIG | Coef. | Std. Err. | Z | P>|z| | [95% Conf. | Interval] |
| Audit | -.741 | .277 | -2.68 | 0.007 | -1.285 | -.198 |
| MO | .168 | .1538 | 1.09 | 0.274 | -.1333 | .4697 |
| IO | -.556 | .2201 | -2.53 | 0.011 | -.9882 | -.1250 |
| BO | -1.28 | .3738 | -3.43 | 0.001 | -2.013 | -.5486 |
| Ow*Audit | .4077 | .1998 | 2.04 | 0.041 | .01615 | .7993 |
| Liq | .0517 | .0046 | 11.20 | 0.000 | .04267 | .0607 |
| RET | -1.09 | .1691 | -6.46 | 0.000 | -1.424 | -.76149 |
| Cons | 3.392 | .2406 | 14.10 | 0.000 | 2.920 | 3.864 |
Robustness Test
This Table 8 show that the audit fees is the best measure compare to audit size to examine the relationship between audit quality and crash risk because of R2 is higher and AIC & BIC are lower. The audit fees is a negative effect on crash risk which is similar to GMM results. Also, the results indicated that ownership structure is significant positively with crash risk for both audit size and audit fees. The table above refers to the audit quality (Fees) play vertical role in eliminate the relationship between ownership structure and crash.
| Table 8 Robustness Test | ||
| Variable | Model1 (Size) | Model2 (Fees) |
| Size | .183* | |
| MO | .334*** | .443*** |
| IO | .243*** | .309*** |
| BO | .301*** | .270** |
| Ow*Size | -.1217** | |
| FS | -.045* | -.054** |
| Liq | .052*** | .0493*** |
| LEV | .4264*** | .434*** |
| RET | -.338** | -.369*** |
| Fess | -.099* | |
| Ow*Fees | -.027** | |
| Cons | 1.99*** | 2.703*** |
| N | 490 | 490 |
| R2 | .242 | .251 |
| R2_a | .227 | .237 |
| AIC | 193.81 | 187.77 |
| BIC | 235.76 | 229.72 |
| RMSE | .291 | .290 |
Conclusion
The results show that ownership structure effect a positively with crash risk with using OLS, GLS, GLM and robustness test. This result consistent with the view that increase managerial, institutional and blockholder ownership lead to increase crash risk due to misleading information through CEO but this result differs using GMM so, the negative association between ownership structure and crash risk which is consistent with the viewpoint that emphasize on protect their material interests. actively monitor top management; and limit the negative side of CEO power, which can lead to crash risk and affect investor wealth (Khajavi & Zare, 2016; Chae et al., 2020).The results show that audit quality effect a negatively with crash risk with using GMM and consistent with robustness test through both audit size and fees. This result support shareholders benefit from improving the audit quality to provide a better environment for shareholders to obtain a greater amount of information, along with it reduces information asymmetry. The provision of an appropriate amount of information, which means reducing the degree of information asymmetry. To shareholders acting more confidently in their shares, which means less crash risk. Also, improving the audit quality through providing a better informational climate for shareholders, that is, reducing information asymmetry, increasing their confidence in the validity of the information available to them about the facility, which is reflected in their decisions specific related to stock firms like: trading volume or trading prices in a manner that reduces the risk of a stock price collapse (Khajavi & Zare, 2016; Chae et al., 2020).
The results show that audit quality is a positive with crash risk by using OLS, GLS and GMM. This result focus on improve audit quality leads to increase crash risk through manipulating financial statements and non-disclosure as the auditor may tend to show the financial statements in the best position in order to increase his fees and then lack of transparency leads to increased crash risks.
Finally, results show that audit quality play an important role in the relationship between ownership structure and stock price crash risk. This result varies by using statistical methods, most methods think that it contributes to reducing the relationship between ownership structure and crash risk which is consistent with OLS, GLS, GLM and robustness test (Khajavi and Zare, 2016; Chae et al., 2020) but in consistent with GMM which enhance audit quality the relationship between ownership structure and crash risk.
This paper provides different insights into the relationship between audit quality, ownership structure and stock price crash risk from different points of view with different statistical methods and different measures. Therefore, this article is considered one of the important articles for researchers in a varied presentation of one of the factors affecting the crash risk, which audit quality and ownership structure.
References
- An, H., & Zhang, T. (2013). Stock price synchronicity, crash risk, and institutional investors. Journal of Corporate Finance, 21, 1-15.
- Andreou, P.C., Antoniou, C., Horton, J., & Louca, C. (2016). Corporate governance and firm-specific stock price crashes. European Financial Management, 22(5), 916-956.
- Benmelech, E., Kandel, E., & Veronesi, P. (2010). Stock-based compensation and CEO (dis) incentives. The Quarterly Journal of Economics, 125(4), 1769-1820.
- Bleck, A., & Liu, X. (2007). Market transparency and the accounting regime. Journal of Accounting Research, 45(2), 229-256.
- Boone, A.L., & White, J.T. (2015). The effect of institutional ownership on firm transparency and information production. Journal of Financial Economics, 117(3), 508-533.
- Callen, J.L., & Fang, X. (2013). Institutional investor stability and crash risk: Monitoring versus short-termism?. Journal of Banking & Finance, 37(8), 3047-3063.
- Callen, J.L., & Fang, X. (2015). Religion and stock price crash risk. Journal of Financial and Quantitative Analysis, 169-195.
- Chae, S.J., NAKANO, M., & FUJITANI, R. (2020). Financial reporting opacity, audit quality and crash risk: Evidence from Japan. The Journal of Asian Finance, Economics, and Business, 7(1), 9-17.
- Chen, C.J., Su, X., & Zhao, R. (2000). An emerging market's reaction to initial modified audit opinions: Evidence from the Shanghai Stock Exchange. Contemporary Accounting Research, 17(3), 429-455.
- Chen, H., Chen, J. Z., Lobo, G. J., & Wang, Y. (2011). Effects of audit quality on earnings management and cost of equity capital: Evidence from China. Contemporary Accounting Research, 28(3), 892-925.
- Chen, J., Chan, K.C., Dong, W., & Zhang, F. (2017). Internal control and stock price crash risk: Evidence from China. European Accounting Review, 26(1), 125-152.
- Colbert, G., & Murray, D. (1999). State accountancy regulations, audit firm size, and auditor quality: An empirical investigation. Journal of Regulatory Economics, 16(3), 267-286.
- Dang, T.L., Faff, R., Luong, L.H., & Nguyen, L. (2017). National Culture and Stock Price Crash Risk. Working Paper. URL: http://www. efmaefm. org/0EFMAMEETINGS/EFMA% 20ANNUAL% 20MEETINGS/2017-Athens/papers/EFMA2017_0376_fullpaper. pdf.
- David, P., Kochhar, R., & Levitas, E. (1998). The effect of institutional investors on the level and mix of CEO compensation. Academy of Management Journal, 41(2), 200-208.
- Davidson, R.A., & Neu, D. (1993). A note on the association between audit firm size and audit quality. Contemporary Accounting Research, 9(2), 479-488.
- DeFond, M.L., Hung, M., Li, S., & Li, Y. (2015). Does mandatory IFRS adoption affect crash risk?. The Accounting Review, 90(1), 265-299.
- Habib, A., Hasan, M.M., & Jiang, H. (2018). Stock price crash risk: review of the empirical literature. Accounting & Finance, 58, 211-251.
- Hambrick, D.C., & Finkelstein, S. (1995). The effects of ownership structure on conditions at the top: The case of CEO pay raises. Strategic Management Journal, 16(3), 175-193.
- Hartzell, J.C., & Starks, L.T. (2003). Institutional investors and executive compensation. The journal of finance, 58(6), 2351-2374.
- Hutton, A.P., Marcus, A.J., & Tehranian, H. (2009). Opaque financial reports, R2, and crash risk. Journal of financial Economics, 94(1), 67-86.
- Gunn, M.J. (2012). International auditing and assurance standards board (“iaasb”) invitation to comment?improving the auditor’s report.
- Jin, L., & Myers, S.C. (2006). R2 around the world: New theory and new tests. Journal of financial Economics, 79(2), 257-292.
- Khajavi, S., & Zare, A. (2016). The effect of audit quality on stock crash risk in Tehran Stock Exchange. International Journal of Economics and Financial Issues, 6(1).
- Khan, R., Dharwadkar, R., & Brandes, P. (2005). Institutional ownership and CEO compensation: a longitudinal examination. Journal of Business Research, 58(8), 1078-1088.
- Kim, J.B., & Zhang, L. (2016). Accounting conservatism and stock price crash risk: Firm-level evidence. Contemporary accounting research, 33(1), 412-441.
- Kim, J.B., Li, Y., & Zhang, L. (2011). Corporate tax avoidance and stock price crash risk: Firm-level analysis. Journal of Financial Economics, 100(3), 639-662.
- Kim, Y., Li, H., & Li, S. (2014). Corporate social responsibility and stock price crash risk. Journal of Banking & Finance, 43, 1-13.
- Kothari, S.P., Shu, S., & Wysocki, P.D. (2009). Do managers withhold bad news?. Journal of Accounting Research, 47(1), 241-276.
- Porta, R.L., Lopez-de-Silanes, F., Shleifer, A., & Vishny, R. W. (1998). Law and finance. Journal of Political Economy, 106(6), 1113-1155.
- La Porta, R., Lopez-de-Silanes, F., & Shleifer, A. (1999). Corporate ownership around the world. The Journal of Finance, 54(2), 471-517.
- Musteen, M., Datta, D. K., & Herrmann, P. (2009). Ownership structure and CEO compensation: Implications for the choice of foreign market entry modes. Journal of international business studies, 40(2), 321-338.
- Rashed, A., Abd El-Rahman, E., Isamil, E. and Abd El-Samea, D., 2018. Ownership Structure and Investment Efficiency: Evidence from Egypt. International Journal of Accounting and Financial Reporting, 8(4), 1-22.
- Shahab, Y., Ntim, C.G., Ullah, F., Yugang, C., & Ye, Z. (2020). CEO power and stock price crash risk in China: Do female directors' critical mass and ownership structure matter?. International Review of Financial Analysis, 68, 101457.
- Van Essen, M., Otten, J., & Carberry, E.J. (2015). Assessing managerial power theory: A meta-analytic approach to understanding the determinants of CEO compensation. Journal of Management, 41(1), 164-202.
- Yeung, W.H., & Lento, C. (2018). Ownership structure, audit quality, board structure, and stock price crash risk: Evidence from China. Global Finance Journal, 37, 1-24.