Research Article: 2021 Vol: 25 Issue: 4S
The Impact of Core Competence of Audit Companies & Offices on Audit Quality through Examining Earning Quality of Banks in Iraq Stock Exchange
Dr. Iman Shakir Mohammed, Al-Iraqia University
Dr. Wafaa Abdameer Hassan, University of Baghdad
Dr. Fayhaa Abdulla Yaqoob, University of Baghdad
Citation Information: Mohammed, I.S., Hassan, W.A., & Yaqoob, F.A. (2021). The impact of core competence of audit companies & offices on audit quality through examining earning quality of banks in Iraq stock exchange. Academy of Accounting and Financial Studies Journal, 25(S4), 1-18.
Abstract
The problem of the research is companies pay no attention to the selection of auditors who have a good level of core competence, that enable them to perform the task of auditing with high quality and its impact on the quality of its profits, as many studies have addressed the impact of Audit Quality in Earning Quality, The aim of the current study to find a relationship between and impact of Core Competence on audit firms and audit offices in Audit Quality through Earning Quality of audited companies. In order to achieve the objectives of the study, a model was found to measure the relationship and impact of Core Competence for companies and audit offices in the quality of audit companies in Iraq Stock Exchange, as well as the development of a model to measure the relationship and impact of the quality of audit in earnings Quality, and then apply this model to a sample of banks In Iraq Stock Exchange for the period from 2006 to 2018, companies and audit offices in charge of auditing banks sample study. The most important results of the study are the existence of a significant relationship and influence of the quality of audit in the earnings quality of banks in Iraq Stock Exchange, and the existence of a relationship and significant impact of the Core Competence of the companies and audit offices in Iraq on the quality of audit of Iraqi banks.
Keywords
Core Competence, Audit Quality, earnings Quality, Knowledge, discretionary accruals, Banks in Iraq Stock Exchange, Audit Companies & Offices in Iraq.
Introduction
Businesses and audit companies are paying attention to building the core competence of human capabilities and capabilities through devoting administrative efforts and allocating the necessary resources to promote and enhance them through paying attention to workers, in terms of acquiring knowledge, experience and skill, as well as the use of technological capabilities through the provision of hardware and software and training of workers To keep pace with the rapid developments in the business world and the prompt decision-making and drafting of information in a manner that guides management towards the best decision, and to raise the level of operational and strategic performance as well as achieving accuracy and speed in making financial statements accessible to external beneficiaries and give them reliability, and gain a qualitative leap in achieving a competitive advantage. One of the reasons for assuring the reliability of the financial statements is that companies should hire an external auditor with a high level of ability and reputation in the labor market to enhance Audit Quality and enhance earnings quality of the audited companies.
This has led to attention of auditing companies to provide the necessary resources to build Core Competence and build capabilities to cope with the rapid changes and development in the business market. Han, (1999) stated that the survival and growth of companies depends on competitive advantage and core competence management, and that companies with systematically structured core competence face no difficulties despite changing their surrounding environment, that's why companies are investing their resources to enhance their core competence .
Therefore, the Following Questions May be Raised
- Is there a relationship and impact between audit quality factors and earnings quality?
- Is there a relationship and impact between Core Competence factors for companies and audit offices in Iraq and the audit quality of Banks in audited Iraq Stock Exchange?
- Is there a relationship and impact between Core Competence factors for companies and audit offices in Iraq on Earnings Quality for Banks in Iraq Stock Exchange?
Research Hypotheses
H0: There is a significant effect relationship of the audit quality on the earnings quality for the Banks in Iraq Stock Exchange with the stability of other factors.
H0: There is a significant effect relationship of core competency for companies and audit offices in Iraq on the audit quality for Banks in Iraq Stock Exchange with the stability of the other factors.
H0: There is a significant effect relationship of core competency for companies and audit offices in Iraq on the Earning quality for Banks in Iraq Stock Exchange with the stability of the other factors.
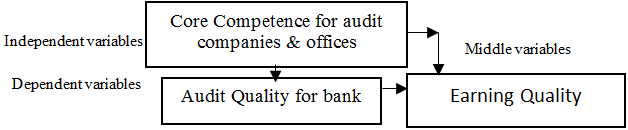
Model of Research
Theoretical Framework
Background and Previous Research
This study contributes to the literature related to finding a model for measuring the relationship of the core capacity of companies to audit and influence the quality of profits and work to develop this model by applying it to a sample of banks registered in the Iraq Stock Exchange, although there are few studies that have studied this relationship in different contexts. About the current study. The study (Sattam, 2016) focused on measuring the impact of the quality of financial reporting on profit distribution policies and its reflection on the market value of companies and suggested a model for measuring the impact of the quality of financial reporting on profit distribution policies and its reflection on the market value of companies listed on the Iraq Stock Exchange. (Saeb, 2018) Statement of the impact of voluntary disclosure on the quality of financial reporting, and follow the method of preparing a list of the required information and applying it to each company to know whether the company discloses information or not, (Menshid, 2020) relied in his research on four main models for measurement, as the first model reflects the assumed relationship between the independent variables represented in the characteristics of The quality of the audit (the size and reputation of the company or audit office, specialization in the client's activity, the client retention period, the total assets of the client and the return on the assets of the client) and measuring the extent of its impact on the main dependent variable represented by the quality of financial reporting and its three entries (Quality of earnings, quality of application of standards and quality of accounting information). Jones, (1991) model amended by Dechow et al. (1995) to measure the Quality of earnings by measuring total receivables, discretionary entitlements, and non-choice receivables. And the study Lobo et al. (2018) examined the relationship between innovation and the quality of financial reports and the implications for the quality of the audit for this relationship by measuring the quality of financial reporting by measuring the abnormal benefits and measuring the absolute and signed MBE quality and the likelihood of meeting Or exceed analyst earnings expectations based on the quality of the auditor, is the big four auditor or auditor specializing in the industry, audit efforts, for which we measure audit fees are abnormal. Company characteristics, audit metrics, auditor, customer relations, fixed effects, year, and use standard errors of binary Direction in his tests.
Most of the goals of previous research were to measure the extent of corporate management practices in managing profits and measuring the impact of the quality of the audit on the quality of profits or the quality of the financial reports, which is the main guide for taking many decisions by the relevant parties, which requires that these reports contain correct and fair information in order to achieve the purpose for which they were prepared.
Core Competencies : The term "core competency" was cited in a pioneering article in 1990 by (Prahalad & Hamel, 1990) (Boguslauskas & Kvedaraviciene, 2009) by (Al-Baghdadi & Al-Atwi, 2014). Core competency means the company's knowledge of how it performs its business and how it can define the company's competency as the product of accumulated experience and education in the company, which results in the knowledge and skills required to accomplish the business real proficiency in the performance of the company's internal activities. Core competence is the creative implementation and performance of the company's activity and is a solid, stable, non-incidental and emergent character which ensures the company's profitability and competitiveness (Thompson & Strickland, (2003:122). The management is keen on providing the academic and creative skills with superior mental abilities in the creation of solutions, the ability to achieve economic value added to the organization, and therefore the learning process is one of the most important processes on which the organization achieves its objectives and the more successful the company to manage this process at various levels. Organizational structure has become more effective in achieving its organizational objective .Yugiong & Fuquan, (2013) The core competencies are reflected in the management's ability to align regulatory skills and technological pathways. Core Competence is a combination of the employees' personal skills and techniques, and attention is paid to intangible assets as well tangible assets (Sheikhli, 2009:72).
The core competency, resources and potentials of the organization contribute to the enhancement of competitive advantage and superiority over its competitors (Hitt & Hoskisson, 2003: 396). Thus the knowledge, skills, experiences, abilities and behaviors that are derived from the different functional factors and which are one of the important factors of all employees in the organization regardless of their level of job. Katima (2005:13) Which are used to improve the performance of the organization in a way that helps workers to complete their work efficiently Agamada & Odejimi, (2013:75). Today's ICT is a foundation for enchancing Core Competence and a basis for the organization's real evolution and its ability to make profound structural changes in competitiveness (Coyne & Stephen, 2004).
Additinally, it helps the company to adapt to the fundamental rapaid and unexpected environmental changes, by strategically developing and strengthening strategic resources and potentials in the present and in the future in order to improve the organization's resilience and adaptability to change.(Aaker & Mascarenhas,1984). The core competency is knowledge, experience, skill, technology, and information (Greaver, 1999).
Knowledge is a noune derived from the verb "know" and refers to the ability to distinguish or ocqaire, thus it is all that is defined or understood. Ashmawi, (2010: 222) (Harris & Hendersen) sees knowledge as one of the core factors of an integrated chain, beginning with the reference, and then into the data, then to information, then to knowledge, then to wisdom, and the latter is the basis of innovation (Hijazi, 2014: 46) From"tsoukasladimirou," that knowledge is of a personal character, and that individual competencies are permanently possessed of knowledge, ability to apply, and translation. Knowledge, learning, and information processing are resources that contribute to value creation. The maintenance, use and development of these strategic resources to create a sustainable competitive advantage has become one of the most important areas of competitive strategic analysis. (Grimand, 2002: 2)
Experience is like knowledge something a person can acquire but the difference is that experience comes from practicing. The expert is the one who has done a job until he becomes familiar with it, and is an extensive knowledge of a specific task acquired from training and practice and usually accompanied by certain level Of intelligence but not always connected to the intelligent individual(Nonka, 1994: 19).
Skill: The ability to perform functions that are unique, effective, and at low cost, skills can be either moral or physical, and the skills necessary to facilitate complex operations, perform various tasks and duties, and solve problems (Al-Khafaji,2013). The skills required of accountants and auditors are analytical skills, communication skills, organizational skills, technology use skills.
Technology and information technology, which includes scientific and practical expertise, specific methods, procedures, experience, equipment and development capabilities (Coyne & Stephen, 2004). The computer is the core of a technology, and the true strength of ICT lies in its ability to make profound structural changes In competitiveness, the accelerated technological progress has an important impact on competition and the most obvious example of this is the rapid results achieved in the fields of computer and information technology. (Daft, 2004), Technology provides new business opportunities and new ways to deliver services and communicate with customers. The strength of ICTs lies in its ability to make structural and profound changes in the economy through its ability to code knowledge and make it user-friendly and highly productive. Improve product quality and reduce cost.
Audit quality: There are many reasons for considering audit quality, including the desire of the external auditor to give confidence and credibility to a report addressed to the beneficiaries and achieve high reputation in the market profession, as well as the desire of the management of the company to give confidence in their financial statements and thus gain the confidence of shareholders and investors and all relevant parties and the willingness of professional organizations to ensure that the audit profession fulfills its responsibility to all parties involved. Caneghem, (2004) and DeAngelo, (1981, p.186) defines audit quality as a common probability that is evaluated by the market and performed by a particular auditorIn this definition, quality requires both the competence and independence of the auditor. Without sufficient efficiency, the auditor may not be able to detect errors or irregularities, without a high level of independence, the auditor may not be prepared to report the results by virtue of its independence and sufficient efficiency, the auditor must be able to identify and report on material errors, thereby completing the audit with high quality. Many researchers have used this dual approach to increase audit quality determination with details of efficiency and independence, while others adopt audit quality features (Seyyed, 2012) as the auditor's ability to detect and report material errors, the above emphasize two key audit quality aspects: the auditor's effort and independence, and others determine the quality of the audit through the accuracy of the information reported by the auditors, )Trueman & Titman,1986) and (Behn & Choi, 2008) point out that high quality audit will improve the reliability and accuracy of financial statements and give investors rationalization of their investment decisions and accurate valuation of the company. Schauer, (2002,78) notes that "higher quality audit increases the likelihood that the financial statements will more accurately reflect the financial position and results of the entity being audited". Quality audit is part of the quality of the accounting information disclosed (Clinch, 2010). Francis, (2009) states that the highest quality audit is concluded by the possibility that the auditor issues an audit report on business continuity and accuracy of the report in anticipation of bankruptcy of The customer, the degree to which customers demonstrate profit management behavior, Audit quality is sometimes equal the quality of profits. The main idea is to ensure the reliability of information by maintaining a high quality of profit. (Koh et al., 2013).
Factors that are likely to have an impact on the quality of the audit service may be divided into factors attributable to the same service provider (audit firm), factors associated with the service provider (the audited firm), and some related to other entities or causes. (Tawjari & Na'abi, 2008), A number of researchers presented a number of indicators, including the size of the audit firm, the sector specialization, the reputation of the auditing firm, work pressures, discretionary accruals, audit fees, quality of Accrual or continuity views, or meeting or achieving the quarterly profit goal as an audit agent of Audit Quality. We provide evidence of the validity of these procedures by assessing whether they are able to predict successfully the alleged deficiencies in auditing the engagements that are subject to litigation when compared whit audit quality by reducing total accruals . Accordingly, the following factors were adopted in this study:
The size of the audit company, The study Chen et al. (2013) examined the relationship between the size of the audit company and Audit Quality and financial performance, the relationship appeared positive in national, regional and local audit firms. But in national companies higher than regional and local companies. The study of Beasley & Petroni, (2001) confirmed that the size of the audit office is a factor in the focus of the audit profession market, and that the major audit companies have the qualities of specialization in the audit process and be a competitive factor for other companies and offices, and thus can meet the needs of the client even if they Complex and specialized. Arens et al. (2008) classified audit firms into four sizes, the big4 international companies, national companies, large local firms, and small local firms.
Sectoral specialization of an audit firm previous studies examine (Balsam et al., 2003, Reichelt & Wang 2010, Lowensohn et al., 2007) the existence of a positive relationship between the industrial specialization and Audit Quality, one of the reasons for this positive relationship is the presence of industry experience for audit companies specialized in the industry to improve the evidence impact on the experience and efficiency of audit companies and performance. The specialization comes from the audit of many companies in the same sector, so auditors need good experience and high to become experts in the processes and procedures related to this sector, (O'Keefe et al, 1994) expects that audit firms specialized in a particular sector have considerable experience And significant investment in technology adopted in this sector or activity and is likely to provide relatively high quality services. (Gul et al., 2000( ,(DeFond et al., 2000), (Krishnan & Yang, 2003) found that sector-based specialization of audit firms reduces the discretionary accruals and improve the quality of corporate accounting numbers. (Carcello & Nagy, 2004) expect a negative relationship Between the auditor's competence and the reporting of fraudulent financial statements.
Audit Company Reputation
The company's reputation is the ethical behavior enjoyed by the auditors during their professional career, and the techniques used. Whenever the company uses modern information technology and high-performance computer software, and the high level of resources available and increase the degree of training and experience of employees whenever the company's reputation is positively affected in the audit market, and the company's reputation is affected Negative number of judicial complaints against audit firms and firms in the courts, high reputation costs provide an incentive to move the company to a high quality audit firm (Dopuch & Simunic 1980, DeAngelo, 1981, Klein & Leffler, 1981).
Work Pressures
The auditors' work is primarily the result of a conflict between limited audit resources and a gradual workload during a limited period of time (Lo'pez & Peters, 2012). Previous studies (Landsbergis, 1988), (Fletcher & Jones, 1993) find that Work is positively connected with the intensity of business requirements, and is negatively associated with control over work. Moreover, work monitoring is useful in improving job satisfaction and job performance.(Greenberger et al., 1989), (Dwyer & Ganster, 1991) stated that all listed companies disclose their audited financial statements before 30/4, which means that auditors face clear pressure for a specified period of time because they must terminate All audit work on time and issuing a fair audit report. Audit is usually more complex when the audited group is larger, auditors will have a greater workload and it takes longer to complete the audit, so time pressure is more pronounced. An audit period may be one of these factors to assess the audit risk. During the initial audit of a new customer, the auditor must have a thorough understanding of the client's operational characteristics, accounting policies, industry development and other information. In this case, the auditor needs to save more initial audit costs in the new client, including business hours, human and material resources. The more customers the auditor takes, the greater the workload, the few hours of work and the audit resources he can spend on each client, especially new clients. The more direct the conflict between job demand and labor control, the more intense the conflict, the more likely the work pressure and negative effects will be. The more negative the audit results will be, the more sufficient evidence and the efficiency of the audit judgment. On the other hand, in the initial audits of the continuing clients, given the overall workload and stress, the effectiveness of the controls on work orders tends to improve with the following audit, accumulation of experience and knowledge gained through familiarity and mastery of specific information from clients and industry. The improvement in efficiency is then mitigated by the negative effects of working pressure on audit quality (Huanmin & Shengwen, 2016).
Financial Reporting Quality
The financial reporting aims at providing the appropriate and reliable financial information about the company to its beneficiaries for the purpose of making appropriate and timely decisions. Therefore, the quality of financial reporting is achieved through reflection of the qualitative characteristics of accounting information on the financial statements provided to the beneficiaries. In all directions, by looking at the literature on measuring the quality of financial reporting, there are three trends of measurement (Choi & Pae, 2001,407)
First: Using profit management by using receivables
Second: measuring the degree of accounting reservation (by looking at the literature showing that the accounting reservation needs to be properly assessed or an appropriate realization of the bad news from the good news)
Third: measuring how the receivables can be accurately predicted and linked to cash flow from future operations. The majority of researchers have argued that the quality of financial reporting starts with the quality of profits and that the best measure of financial reporting quality is the quality of profit (Schipper & Vincent, 2003).
Earnings Quality
Managers and shareholders are the most beneficial, managers may not work in the interest of shareholders (Jensen & Meckling,1976),specifically (Arrunada,2000) mentioned If managers' compensation is tied to corporate performance, managers have a motive to report profits wrongly, so the demand for audit services arises from the need to reduce information asymmetry among stakeholders such as (shareholders, creditors, public authorities, employees, customers, and lenders). High auditing with low levels of asymmetry in information and low levels of "performance uncertainty". Therefore, audit quality must be negatively associated with profit management. Xu & Nord,(2003) noted that the key factors influencing the quality of information are closely related to the core competence of human factors, system factors, regulatory factors, and external factors. As for the estimation of profit management (Dechow et al., 1995) noted that the administration often focuses on the use of discretionary accruals for the purpose of manipulation of profits. Accordingly, many models have been found to reveal profit and accrual management by separating discretionary accruals from non- discretionary accruals, that allow to manipulate profits by management will leads to lose earnings quality and affects on investment decisions of data users.
In examining the relationship between profit management and audit quality, many existing studies have used the Jones model or the modified Jones model (Becker et al., 1998; Krishnan, 2003). Applied Study Based on what has been exposed in the theoretical aspect to research on the problem of the study and its objectives and hypotheses, it is possible to construct the study of the phenomenon by applying models that are compatible with the phenomenon, then analyzing the data and testing hypotheses. This study developed three models.
Mechanism of Measurement of Study Variables: The variables of the study were measured Core Competence factors and the audit quality factors through a survey questionnaire that was sent to the audit companies and offices that are in charge for auditing the private banks for the period 2006-2018. As well as the adoption of the database of the Iraq Stock Exchange to measure the variables of earning quality and audit quality factors. Earnings Quality was based on (Dechow et al. 1995), to measure discretionary accruals for a sample of Iraqi private banks.
First model: To measure the impact and relationship between the Audit Quality factory as independent variable, the Earnings Quality as a dependent variable.
 (1)
(1)
EQ: Earnings Quality The dependent variable
Sizei,t: Size of audit company, that audits the company i in year t. It was measured by the number of partner auditors and the number of associate auditors in the audit firm.
Specializationi,t:The audit firm is assigned to Company i in year t. A fictitious variable if the bank is audited by a company or a specialist audit office, takes the number 1 or 0.
Reputationi,t:The reputation of the audit firm,which audited the company i in year t. Measured by the number of complaints filed against the company or audit office, since all companies did not have issues raised, the technology and software used were adopted as well as the training of employees. A fictitious variable if the bank is audited by a company or an audit office has the possibilities of technology and software take the number 1 and 0.
Work pressure i,t The work pressure of the audit firm that audited the company i in year t. It is calculated by (number of clients audited by the audit firm plus other services and checks performed by the audit office) Divided number of auditors.
Leverage i,t: leverage equal total liabilities Divided total assets of company i in year t.
ROI,i,t Rate of return on investment equal Net Profits Divided Net Equity of the Company i in the year,t.
CurrRatioi,t: Current Ratio equal Current assets Divided current liabilities of the company i per year t.
To measure the earnings quality, representing the total Accrual and discretionary accruals & nondiscretionary accruals, as in equation (2)
TACC = DACC + NDACC (2)
TACC: Total accruals DAC:discretionary accrualsNDACC:nondiscretionary accruals.
TACC: Total accruals DAC:discretionary accrualsNDACC:nondiscretionary accruals.
TACCi,t = (ΔCAi,t – ΔCashi,t)-( ΔCLi,t – ΔIpaidei,t)-DEPi,t (3)
TACCi,t: represents the total accruals of company i in year t.
ΔCAi,t: is the change in current assets for Company i between year t and year t-1
ΔCashi,t: is The change in cash for company i is between year t and year t-1
ΔCLi,t :is the change in current liabilities for Company i between year t and year t-1
ΔIpaidei,t: is the change in the interest bearing Liabilities of company i between year t and year t-1
DEPi,t : depreciation & amortization.
Estimation of the values (a1, a2, a3,a4) in the regression model as in equation (4) Table (2)

| Table 1 Total Accruals (Tacc) for a Sample Of Iraqi Private Banks During The Period 2008-2017 |
|||
| Name of bank | AVERAGE | MEDIAN | STDEVA |
|---|---|---|---|
| BGUS | 58034476.87 | 7,154,228 | 3,051,795 |
| BMFI | 175688459 | -45,356,802 | 7,041,275 |
| BBOB | 166027346.7 | -3,717,197 | -30,000,709 |
| BIBI | 23385346.97 | -5,385,194 | -6,795,154 |
| BCOI | 49193099.08 | -5,464,653 | 15,302,650 |
| BROI | 74829779.88 | 22,097,710 | 23,562,347 |
| BIME | 81077451.54 | -23,208,521 | -14,330,618 |
| BASH | 67425233.1 | -18,373,438 | -39,888,485 |
| BMNS | 81077451.54 | -23,208,521 | -14,330,618 |
| BIIB | 96759422.9 | 6,907,809 | 21,302,749 |
| Table 2 A A Values of the First Model for the Nondiscretionary Accruals Receivables |
||||
| Name of bank | A | a1 | a2 | a3 |
|---|---|---|---|---|
| BGUS | 7606976 | -1.055 | -.740 | -.704 |
| BMFI | -91226853 | 1.244 | 12.475 | -2.718 |
| BBOB | -7317159 | .201 | .966 | 1.448 |
| BIBI | 164849 | 0.76 | 0.40 | -0.64 |
| BCOI | -9545507 | -1.542 | -5.508 | -3.862 |
| BROI | 36417643 | 5.314 | 61.770 | -6.941 |
| BIME | 36417643 | 5.314 | 61.770 | -6.941 |
| BASH | 42354345 | -.622 | -.173 | 2.178 |
| BMNS | 19040970 | -1.533 | -14.966 | -3.436 |
| BIIB | -5662244 | -1.034 | -.943 | -.398 |
Value are equated (a1, a2, a3, a4) in equation (5) to estimate discretionary accruals as in Table (3.4)

TACCi,t: Total accruals (drawn from equation (4)
Ai,t-1 Total assets of the company i for the year t-1.
ΔRev i,t changes in revenues for firm i between the years t and t-1;
ΔRec i,t changes in accounts receivable for firm i between the years t and t-1;
PPEi,t gross property, plant, and equipment for firm i in year t;
ROAi,t :the return on assets for firm i in year t.
The emergence of nondiscretionary accruals by negative indicates that the company follows a conservative accounting policy and vice versa.
Discretionary Accruals is a measure of quality management or earnings, so companies with negative Discretionary Accruals show a high quality of financial reports, or earnings quality, and vice versa (Bajra & ?ade?, 2018; Badolato et al., 2014; Kasznik, 1999).
Audit Quality factors were measured as in Table (5). The Discretionary Accruals that are extracted from Equation (5) are compensated , which represents the EQ Earnings Quality, In the first model.
Table 3 shows that the average nondiscretionary accruals for the private banks BMNS, BGUS, BIB, BASH and BCOL have been shown in negative terms. This indicates that their policy is conservative. BMFI, BBOB, BIBI, BROI, BIME, BMDI are the average nondiscretionary accruals However, its policy is not conservative.
| Table 3 Nondiscretionary Accruals (NDACC) |
|||
| Name of bank | AVG | MEDIAN | STDEVA |
|---|---|---|---|
| BGUS | -19,864,218 | -13,788,483 | 19770285.11 |
| BMFI | 65,050,177 | 74,967,883 | 29236209.7 |
| BBOB | 68,131,980 | 44,485,588 | 55967935.81 |
| BIBI | 4,835,951 | 4,544,404 | 10879083.54 |
| BCOI | -12,430,871 | -11,554,769 | 22571022.29 |
| BROI | 139,363,299 | 152,328,527 | 46064681.67 |
| BIME | 4,543,861,785 | 4,954,685,319 | 1235194981 |
| BASH | -8,674,091 | -5,047,591 | 12818135.52 |
| BMNS | -79,229,232 | -89,316,716 | 33793479.32 |
| BIIB | -13,088,566 | -9,381,758 | 14661843.58 |
As shown in Table 4, discretionary accruals, the average maturity of BMNS, BGUS, BIIB and BCOL banks showed a positive result. This indicates that these banks do not have a profit quality, ie they exercise profit management, BMFI, BBOB, BIBI, BIME, BASH, the average receivables were negative and this indicates that they do not exercise profit management because discretionary accruals appeared in negative value, meaning high quality earnings (Yaqoob, 2019).
| Table 4 Discretionary Accrual (DACC) |
|||
| Name of bank | AVG | MEDIAN | STDEVA |
|---|---|---|---|
| BGUS | 22,916,013 | 24,695,405 | 52858682.53 |
| BMFI | -58,008,902 | -115,722,502 | 193431193 |
| BBOB | -98,132,689 | -98,820,074 | 138802934.6 |
| BIBI | -11,631,105 | -22,879,760 | 27819292.86 |
| BCOI | 27,733,522 | 28,819,376 | 36661059.98 |
| BROI | -115,800,951 | -139,314,838 | 95164689.31 |
| BIME | -4,558,192,403 | -4,965,434,731 | 1208673539 |
| BASH | -31,214,394 | -7,833,427 | 66365363.81 |
| BMNS | 50,109,431 | 135,161,794 | 383101968.4 |
| BIIB | 34,391,314 | 6,006,350 | 93573131.61 |
Table 5, which includes the audit quality factors for audited banks by the audit firms and offices, the highest average audit quality was for B (3.09) company and the lowest average for L company (1.32), and The average earning quality (Y) of the companies audited by each auditor was approved during the period from 2006 to 2018, the data were analyzed by the adoption of the statistical program SPSS. The results were as follows:
| Table 5 Matrix of Audit Quality Factor for Audit Companies & Offices & AVG Earning Quality |
||||||||||
| audit companies & offices | Y | X1 | X2 | X3 | X4 | X5 | X6 | X7 CR |
AVG audit quality | |
|---|---|---|---|---|---|---|---|---|---|---|
| AVG Earnings Quality | Y | Size | Specialization | Reputation | Work pressure | Leverage | ROI | |||
| A | -707241373.6 | 1 | 10 | 1 | 1 | 3.5 | 0.73 | 0.082 | 3.2 | 2.79 |
| B | -848446451 | 1 | 13 | 1 | 1 | 3.2 | 0.68 | 0.071 | 2.7 | 3.09 |
| C | -283890225.9 | 1 | 9 | 1 | 0 | 3 | 0.67 | 0.063 | 2.4 | 2.30 |
| D | 20359830.19 | 0 | 8 | 0 | 0 | 1.1 | 0.54 | 0.051 | 2.5 | 1.74 |
| E | 17163111.47 | 0 | 6 | 0 | 1 | 1 | 0.54 | 0.04 | 1.8 | 1.48 |
| F | -81959814.19 | 1 | 8 | 1 | 0 | 2.2 | 0.25 | 0.083 | 2.1 | 1.95 |
| G | -52021173.63 | 1 | 9 | 1 | 1 | 2.8 | 0.34 | 0.075 | 3.2 | 2.49 |
| H | 41151520.87 | 0 | 6 | 0 | 0 | 1.9 | 0.42 | 0.031 | 1.7 | 1.44 |
| I | -106257909.9 | 1 | 8 | 1 | 1 | 2 | 0.36 | 0.061 | 2.6 | 2.15 |
| J | 22974957.03 | 0 | 5 | 0 | 0 | 1.8 | 0.73 | 0.032 | 2.2 | 1.39 |
| K | -5621924539 | 1 | 5 | 1 | 1 | 2.21 | 0.73 | 0.048 | 1.5 | 1.64 |
| L | 12292757.28 | 0 | 4 | 1 | 0 | 1.2 | 0.7 | 0.041 | 2.3 | 1.32 |
| M | 16086257.44 | 0 | 4 | 0 | 0 | 2.1 | 0.66 | 0.042 | 2.9 | 1.39 |
| N | -67754297.81 | 1 | 3 | 1 | 1 | 1.7 | 0.67 | 0.058 | 2.6 | 1.43 |
| If AVGEQ(-)=1 If AVGEQ (+)=0 |
||||||||||
Table 6 shows the mean and standard deviation of the research variables at the highest mean and standard deviation X1 (7, 2.77350) and the minimum mean and standard deviation X6 (0.0553, 0.01763).
| Table 6 The Average & Standard Deviation of Audit Quality & Earning Quality Descriptive Statistics |
|||
| Mean | Std. Deviation | N | |
|---|---|---|---|
| Y | .5714 | .51355 | 14 |
| x1 | 7.0000 | 2.77350 | 14 |
| x2 | .6429 | .49725 | 14 |
| x3 | .5000 | .51887 | 14 |
| x4 | 2.1221 | .77486 | 14 |
| x5 | .5729 | .16583 | 14 |
| x6 | .0553 | .01763 | 14 |
| x7 | 2.4071 | .51956 | 14 |
The correlation matrix, as in Table 7, shows the correlation between Earnings Quality and the dependent variable (mediator), and the independent variable was the Audit Quality factors. The results indicated that the highest correlation was X2, (0.861), followed by X6, X4, X3 (0.820, 0.702, 0.577), Factors (X1, X7, X5) had no correlation with Earnings Quality. By observing the type of correlation (Sig) is significant or not, the correlation between the dependent variable and the independent variables (x2, x6, x4, x3, x1) showed a strong correlation between (0.000-0.039) or less than 0.05. The variable X7 and X5 had no significant correlation with the dependent variable, (0.319, to 0.148).
| Table 7 Correlations for Audit Quality & Earnings Quality |
||||||||
| Y | x1 | x2 | x3 | x4 | x5 | x6 | x7 | |
|---|---|---|---|---|---|---|---|---|
| Pearson Correlation | 1.000 | .486 | .861 | .577 | .702 | -.138- | .820 | .301 |
| Sig. (1-tailed) | . | .039 | .000 | .015 | .003 | .319 | .000 | .148 |
The results of Table 8 show a summary of the model. The correlation coefficient between the earning quality variable and the Independent audit Quality variables. The simple correlation coefficient R reached (0.960) while the R2 (0.923) and the corrected R2- (0.832), which means that the independent variables explain about (0.960) of the variation in earning quality and standard error (0.210). Here is the acceptance of the null hypothesis and the rejection of the alternative hypothesis.
| Table 8 Correlation Coefficient Between Audit Quality & Earnings Quality |
||||
| Model | R | R Square | Adjusted R Square | Std. Error of the Estimate |
|---|---|---|---|---|
| 1 | .960a | .923 | .832 | 0.21039 |
Table 9, variance analysis, which can determine the explanatory force F, with a value of (10.208) and a level of significance (0.006) and the significance level is less than 0.05, and this indicates that we accept the null hypothesis and reject the alternative hypothesis, The regression is significant and not equal to zero, which unites the effect relationship between the variable Earnings Quality and the independent variables factors of Audit Quality.
| Table 9 ANOVA Analysis of Audit Quality & Earnings Quality |
||||||
| Model | Sum of Squares | Df | Mean Square | F | Sig. | |
|---|---|---|---|---|---|---|
| 1 | Regression | 3.163 | 7 | .452 | 10.208 | .006b |
| Residual | .266 | 6 | .044 | |||
| Total | 3.429 | 13 | ||||
In Table 10, we can define the value of the constant, the regression coefficients and their statistical indices for the independent variables and the t-test at the significant level P≤0.05, Therefore the regression equation can be obtained using non-standard Bata (Path).
| Table 10 The Value of Constant Coefficients and Regression Coefficients of Audit Quality & Earnings Quality |
||||
| Model | Unstandardized Coefficients | Standardized Coefficients | ||
|---|---|---|---|---|
| B | Std. Error | Beta | ||
| 1 | (Constant) | -.134- | .396 | |
| x1 | -.033- | .035 | -.179- | |
| x2 | .374 | .205 | .362 | |
| x3 | .231 | .128 | .234 | |
| x4 | .253 | .131 | .382 | |
| x5 | -.253- | .445 | -.082- | |
| x6 | 12.292 | 8.344 | .422 | |
| x7 | -.205- | .150 | -.208- | |
EQ= -.134+(-.033)*Size i,t +.374*Specialization i,t +.231* Reputation i,t + .253*Work pressure i,t +(-.253)*Leverage i,t + 12.292* ROI i,t + (-.205)* Curr Ratio i,t (1)
The second model: measuring the relationship between Audit Quality as a dependent variable, and the Core Competence factors as independent variables.
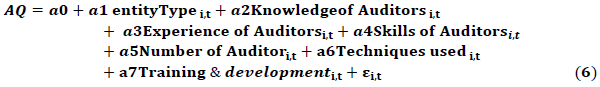
The core Competence was measured through a survey questionnaire that was sent to audit companies and offices.
AQ: Audit Quality: The results of equation (1) were adopted.
A0: (Alpha value) Audit Quality represents companies that do not have independent variables.
entity Type i,t: imaginary variable, imaginary variable, if the bank is audited by an audit company giving the number 1, if the bank is audited by an audit office that gives the number 0 to bank i in year t.
Knowledge of Auditors i,t: A real variable, if the bank is audited by an audit firm or an auditing office with knowledge measured according to the weights and according to the survey form.
Experience of Auditors i,t: Experience is a real variable, if the bank is audited by experienced auditors, and measured by weights.
Skills of Auditors i,t: if the bank is audited by skilled auditors, it is measured according to the weights.
Number of Auditors i,t: Number of auditors and the assistants in a company or audit office.
Techniques used i,t: f the bank is audited by a company or auditing office using a variety of techniques, measured by weights.
Development Certificates i,t: If the bank is audited by a company or audit office, the auditors and the assistants are awarded development certificates, which are measured according to the weights Core Competence was measured on the basis of the data collected through the survey questionnaire addressed to the 14 companies and audit firms that are concerned with the banks' audit of the sample from 2006 to 2018. The results of the Core Competence measurement were shown in Table 11.
| Table 11 Matrix of Audit Quality and Core Competence Factors |
|||||||||
| Audit companies & offices | Y | x1 | x2 | x3 | x4 | x5 | x6 | x7 | AVG Core Competence |
|---|---|---|---|---|---|---|---|---|---|
| Audit Quality | entity Type | Knowledge | experience | Skills | Number of auditors & assistants | Techniques used | Training & development | ||
| A | 1.194 | 1 | 25 | 20 | 40 | 10 | 6 | 5 | 15.29 |
| B | 0.999 | 1 | 28 | 21 | 45 | 13 | 0 | 4 | 16.00 |
| C | 0.815 | 1 | 25 | 31 | 46 | 9 | 6 | 6 | 17.71 |
| D | -0.142 | 1 | 14 | 15 | 20 | 8 | 4 | 6 | 9.71 |
| E | 0.138 | 0 | 13 | 12 | 18 | 6 | 4 | 3 | 8.00 |
| F | 1.059 | 0 | 22 | 14 | 26 | 8 | 3 | 3 | 10.86 |
| G | 1.062 | 1 | 28 | 23 | 35 | 9 | 7 | 4 | 15.29 |
| H | 0.075 | 1 | 20 | 16 | 25 | 6 | 4 | 0 | 10.29 |
| I | 0.839 | 1 | 23 | 18 | 30 | 8 | 8 | 5 | 13.29 |
| J | -0.086 | 1 | 25 | 17 | 26 | 5 | 6 | 1 | 11.57 |
| K | 0.963 | 0 | 20 | 17 | 20 | 5 | 5 | 3 | 10.00 |
| L | 0.267 | 0 | 13 | 12 | 13 | 4 | 3 | 1 | 6.57 |
| M | 0.020 | 0 | 10 | 11 | 13 | 4 | 4 | 3 | 6.43 |
| N | 0.813 | 0 | 20 | 17 | 13 | 3 | 4 | 1 | 8.29 |
Table 11 shows Audit Quality results drawn from Equation (1) and Core Competence factors. The core competency is measured based on the survey questionnaire distributed to audit firms and offices, The highest average for Core Competence was for C company (17.71) and the lowest average for M company (6.43), to find correlation and impact between Core Competence factors as an independent variable and Quality Audit as a dependent variable, data analysis based on SPSS.
| Table 12 Descriptive Statistics Audit Quality & Core Competence |
|||
| Mean | Std. Deviation | N | |
|---|---|---|---|
| Y | .7071 | .49242 | 14 |
| x1 | .5714 | .51355 | 14 |
| x2 | 20.4286 | 5.86665 | 14 |
| x3 | 17.4286 | 5.22883 | 14 |
| x4 | 26.4286 | 11.42005 | 14 |
| x5 | 7.000 | 2.77350 | 14 |
| x6 | 4.5714 | 1.98898 | 14 |
| x7 | 3.2143 | 1.92867 | 14 |
Table 12 shows the average and standard deviation of the Audit Quality & Core Competence variables. The highest mean and standard deviation is X4 (26.4286), (11.42005), the minimum mean and standard deviation X1 (.5714), (.51355).
| Table 13 Correlations for Audit Quality & Core Competence |
||||||||
| Audit Quality | Core Competence factors | |||||||
|---|---|---|---|---|---|---|---|---|
| Type entity | Knowledge | Experience | Skills | Number of assistants | Techniques used | Training & development | ||
| Pearson Correlation | Y | x1 | x2 | x3 | x4 | x5 | x6 | x7 |
| 1.000 | .087 | .686 | .541 | .575 | .530 | .123 | .375 | |
| Sig. (1-tailed) | . | .384 | .003 | .023 | .016 | .026 | .338 | .093 |
The correlation matrix, as shown in Table 13, shows the correlation between the dependent audit Quality variable and the independent variable Core Competence factorys, showing that the highest correlation is X2, Knowledge (0.686), Followed by X4, X3,X5,(0.575,0.541,0.530) a weak correlation was found with Audit Quality, with a correlation level of 0.375 to 0.087 (X7, X6, X1).
| Table 14 Correlation values between Audit Quality & Core Competence |
||||
| Model | R | R Square | Adjusted R Square | Std. Error of the Estimate |
|---|---|---|---|---|
| 1 | .934 | .873 | .725 | .24638 |
By observing the correlation type (Sig), it is whether significant or not it is found that a correlation between the dependent variable and the independent variables(X2 to X5),ranging from(0.003-0.026), which is less than 0.05. The remaining variables have no significant correlation with the dependent variable((X7, X6, X1),(.093 to .384).
The results of Table 14 indicate the correlation coefficient between the Audit Quality variable and the independent Core Competence variables. The simple correlation coefficient R reached (0.934) while the R2 (0.873) and R2 (0.725) Which means that the independent variables explain about 0.934 of the variation in the Audit Quality and the standard error( 0.24638). Here is the acceptance of the null hypothesis and the rejection of the alternative hypothesis.
Table 15 analysis of variance, which can determine the explanatory power F (5.900) and the significance level (0.023) and the significance level is less than 0.05 indicates that we accept the null hypothesis and reject the alternative hypothesis. The regression is significant and not equal to zero, which unites the effect relationship between the Audit Quality variable and the independent variables of Core Competence factors.
| Table 15 ANOVA Analysis for Quality Audit & Core Competence |
||||||
| Model | Sum of Squares | Df | Mean Square | F | Sig. | |
|---|---|---|---|---|---|---|
| 1 | Regression | 2.507 | 7 | .358 | 5.900 | .023 |
| Residual | .364 | 6 | .061 | |||
| Total | 2.871 | 13 | ||||
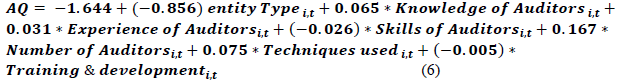
In Table 16 we can define the value of the constant, the regression coefficients and their statistical indices for the independent variables and the t-test at the significant level P≤0.05, Therefore the regression equation can be obtained using non-standard Bata (Path).
| Table 16 The Value of Constant Coefficients and Regression |
|||
| Model | Unstandardized Coefficients | ||
|---|---|---|---|
| B | Std. Error | ||
| 1 | (Constant) | -1.644- | .575 |
| x1 | -.856- | .240 | |
| x2 | .065 | .033 | |
| x3 | .031 | .044 | |
| x4 | -.026- | .032 | |
| x5 | .167 | .146 | |
| x6 | .075 | .074 | |
| x7 | -.005 | .109 | |
The third model: measuring the relationship between earning Quality as a dependent variable, and the Core Competence factors as independent variables.
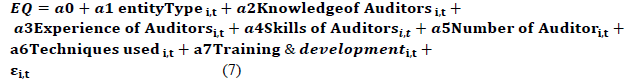
Data table 17 will be entered in the Spss statistical program to determine the effect of Core Competence factors on earning quality.
| Table 17 Matrix of Core Competence Factors and Earning Quality |
|||||||||
| audit companies & offices | Y | X1 | X2 | X3 | X4 | X5 | X6 | X7 | |
|---|---|---|---|---|---|---|---|---|---|
| AVG Earnings Quality | Y | entity Type | Knowledge | experience | Skills | Number of auditors & assistants | Techniques used | Training & development | |
| A | -707241373.6 | 1 | 1 | 25 | 20 | 40 | 10 | 6 | 5 |
| B | -848446451 | 1 | 1 | 28 | 21 | 45 | 13 | 0 | 4 |
| C | -283890225.9 | 1 | 1 | 25 | 31 | 46 | 9 | 6 | 6 |
| D | 20359830.19 | 0 | 1 | 14 | 15 | 20 | 8 | 4 | 6 |
| E | 17163111.47 | 0 | 0 | 13 | 12 | 18 | 6 | 4 | 3 |
| F | -81959814.19 | 1 | 0 | 22 | 14 | 26 | 8 | 3 | 3 |
| G | -52021173.63 | 1 | 1 | 28 | 23 | 35 | 9 | 7 | 4 |
| H | 41151520.87 | 0 | 1 | 20 | 16 | 25 | 6 | 4 | 0 |
| I | -106257909.9 | 1 | 1 | 23 | 18 | 30 | 8 | 8 | 5 |
| J | 22974957.03 | 0 | 1 | 25 | 17 | 26 | 5 | 6 | 1 |
| K | -5621924539 | 1 | 0 | 20 | 17 | 20 | 5 | 5 | 3 |
| L | 12292757.28 | 0 | 0 | 13 | 12 | 13 | 4 | 3 | 1 |
| M | 16086257.44 | 0 | 0 | 10 | 11 | 13 | 4 | 4 | 3 |
| N | -67754297.81 | 1 | 0 | 20 | 17 | 13 | 3 | 4 | 1 |
Table 18 shows the average and standard deviation of the Core Competence variables and earning quality. The highest mean and standard deviation is X4 (26.4286), (11.42005), the minimum mean and standard deviation X1 (.5714), (.51355).
| Table 18 Descriptive Statistics Core Competence & Earning Quality |
|||
| Mean | Std. Deviation | N | |
|---|---|---|---|
| y | .5714 | .51355 | 14 |
| x1 | .5714 | .51355 | 14 |
| x2 | 20.4286 | 5.86665 | 14 |
| x3 | 17.4286 | 5.22883 | 14 |
| x4 | 26.4286 | 11.42005 | 14 |
| x5 | 7.0000 | 2.77350 | 14 |
| x6 | 4.5714 | 1.98898 | 14 |
| x7 | 3.2143 | 1.92867 | 14 |
The correlation matrix, as shown in Table 19, shows the correlation between the independent Core Competence factors variable and the dependent variable earning quality, showing that the highest correlation is X2, Knowledge (0.704), Followed by X3, X4(0.681,0.571) a weak correlation was found with Audit Quality, with a correlation level of0.486, 0.411 to 0.183,.125(X5,X7,X6,X1).
| Table 19 Correlations for Core Competence & Earning Quality Factors |
||||||||
| Audit Quality | Core Competence factors | |||||||
|---|---|---|---|---|---|---|---|---|
| Type entity | Knowledge | Experience | Skills | Number of assistants | Techniques used | Training & development | ||
| Pearson Correlation | Y | x1 | x2 | x3 | x4 | x5 | x6 | x7 |
| 1.000 | .125 | .704 | .681 | .571 | .486 | .183 | .411 | |
| Sig. (1-tailed) | . | .335 | .002 | .009 | .016 | .039 | .266 | .072 |
By observing the correlation type (Sig), it is whether significant or not it is found that a correlation between the dependent variable and the independent variables(X2 to X4),ranging from(0.002-0.016), which is less than 0.05. The remaining variables have no significant correlation with the dependent variable((X5, X7,X6, X1),(.039 to .335).
The correlation matrix, as shown in Table 19, shows the correlation between the independent Core Competence factors variable and the dependent variable earning quality, showing that the highest correlation is X2, Knowledge (0.704), Followed by X3, X4(0.681,0.571) a weak correlation was found with Audit Quality, with a correlation level of0.486, 0.411 to 0.183,.125(X5,X7,X6,X1).
By observing the correlation type (Sig), it is whether significant or not it is found that a correlation between the dependent variable and the independent variables(X2 to X4),ranging from(0.002-0.016), which is less than 0.05. The remaining variables have no significant correlation with the dependent variable((X5, X7,X6, X1),(.039 to .335). The results of Table 20 indicate the correlation coefficient between the earning Quality variable and the independent Core Competence variables. The simple correlation coefficient R reached (0.937) while the R2 (0.878) and R2 (0.735) Which means that the independent variables explain about 0.937 of the variation in the earning Quality and the standard error( 0.26419). Here is the acceptance of the null hypothesis and the rejection of the alternative hypothesis.
| Table 20 Correlation Values Between Core Competence Factors & Earning Quality |
||||
| Model | R | R Square | Adjusted R Square | Std. Error of the Estimate |
|---|---|---|---|---|
| 1 | .937 | .878 | .735 | .26419 |
Table 21 analysis of variance, which can determine the explanatory power F (6.160) and the significance level (0.021) and the significance level is less than 0.05 indicates that we accept the null hypothesis and reject the alternative hypothesis. The regression is significant and not equal to zero, which unites the effect relationship between the earning Quality variable and the independent variables of Core Competence factors.
| Table 21 ANOVA Analysis Core Competence Factors & Earning Quality |
||||||
| Model | Sum of Squares | Df | Mean Square | F | Sig. | |
|---|---|---|---|---|---|---|
| 1 | Regression | 3.010 | 7 | .430 | 6.160 | .021 |
| Residual | .419 | 6 | .070 | |||
| Total | 3.429 | 13 | ||||
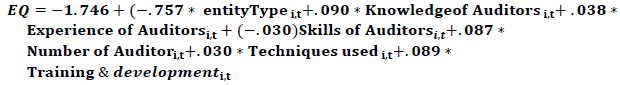
In Table 22 we can define the value of the constant, the regression coefficients and their statistical indices for the independent variables and the t-test at the significant level P≤0.05, Therefore the regression equation can be obtained using non-standard Bata (Path).
| Table 22 The Value of Constant Coefficients and Regression for Core Competence Factors & Earning Quality |
|||
| Model | Unstandardized Coefficients | ||
|---|---|---|---|
| B | Std. Error | ||
| 1 | (Constant) | -1.746- | .616 |
| x1 | -.757- | .257 | |
| x2 | .090 | .035 | |
| x3 | .038 | .047 | |
| x4 | -.030- | .034 | |
| x5 | .087 | .156 | |
| x6 | .030 | .079 | |
| x7 | .089 | .117 | |
By presenting the theoretical and practical side and the results of the application of the research models to measure the extent of the relationship and impact between the factors of Core Competence for companies and audit offices and audit Quality through Earnings Quality for private banks in Iraq Stock Exchange subject to audit and testing hypotheses The study reached conclusions The following:
Conclusion
- The majority of private banks in Iraq Stock Exchange do not practice profit management and are characterized by the quality of their profits by reaching a negative average of discretionary accruals for the period from 2007 to 2018, and some of them showed that the average discretionary accruals appear positive and this means a decrease in the quality of its profits.
- There is a discrepancy between the audit quality factors of audit companies and offices based on the audit of banks. This is shown by the results of the survey, and this is confirmed by the emergence of discretionary accruals positive value, which means that there is the possibility of a profit management for some banks under audit.
- The results of the survey revealed that the significant capacity factors vary between audit firms and offices and this has an impact on the quality of audit and discretionary accruals of the audited firms.
- The results showed statistical analysis that there is a significant correlation and effect of 0.960 and explanatory power of 10.208 between Earnings Quality for banks in Iraq Stock Exchange and Audit Quality factors.
- The results of statistical analysis showed that there is a significant relationship and effect of 0.934 and explanatory power of 5.900 between the core competence factors of audit companies and offices in the audit quality for banks under audit.
- The results of statistical analysis showed that there is a significant correlation and effect of 0.937 and explanatory power of 6.16, the factors of core competence of companies and audit offices in the earning quality of the banks under audit.
References
- Aaker, D.A., & Mascarenhas, B. (1984). The need for strategic flexibility. The Journal of Business Strategy, 5(2), 74.
- Agbada, A.O., & Odejimi, D.O. (2013). Core Competences and Optimising Bank Capital Management in Nigeria, International Journal of Financial Research, 4(1).
- Al-Baghdadi, A.H., & Al-Atwi, M.H.Y. (2014). Impact Core Competences in entrepreneurial marketing. AL-Qadisiyah Journal For Administrative and Economic sciences, 16(4).
- Arens, A.A., Elder, R.J., & Mark, B. (2012). Auditing and assurance services: an integrated approach. Boston: Prentice Hall.
- Arruñada, B. (2000). Audit quality: attributes, private safeguards and the role of regulation. European Accounting Review, 9(2), 205-224.
- Ashmawy, M. (2010). Strategic Management in Human Resource Development, Knowledge Foundation, Alexandria, Egypt, 222.
- Badolato, P.G., Donelson, D.C., & Ege, M. (2014). Audit committee financial expertise and earnings management: The role of status. Journal of Accounting and Economics, 58(2-3), 208-230.
- Bajra, U., & ?ade?, S. (2018). Audit committees and financial reporting quality: The 8th EU Company Law Directive perspective. Economic Systems, 42(1), 151-163.
- Beasley, M.S., & Petroni, K.R. (2001). Board independence and audit?firm type. Auditing: A Journal of Practice & Theory, 20(1), 97-114.
- Van Caneghem*, T. (2004). The impact of audit quality on earnings rounding-up behaviour: some UK evidence. European Accounting Review, 13(4), 771-786.
- Carcello, J.V., & Nagy, A.L. (2004). Client size, auditor specialization and fraudulent financial reporting. Managerial Auditing Journal.
- Clinch, G., Stokes, D., & Zhu, T. (2012). Audit quality and information asymmetry between traders. Accounting & Finance, 52(3), 743-765.
- DeAngelo, L.E. (1981). Auditor Size and Audit Quality, Journal of Accounting & Economics, 3(3), 183-199.
- DeFond, M.l., & Wong, T.J. (2000). Auditor industry specialization and market segmentation: evidence from Hong Kong, Auditing A Journal of Practice et Theory, 19(1), 51-66.
- Dopuch, N., & Simunic, D. (1980). The nature of competition in the auditing profession: adescriptive and normative view, Regulation and the Accounting Profession, 34(2),283-289.
- Francis, J.R., & Yu, M.D. (2009). Big 4 Office Size and Audit Quality, The Accounting Review, 84(5), 1521-1552.
- Frankel, R.M., Johnson, M.F., & Nelson, K.K. (2002). The relation between auditors' fees for nonaudit services and earnings management. The Accounting Review, 77(s-1), 71-105.
- Gul, A.F., Fung, K.Y.S., & Jaggi, S., (2009). Earnings Quality : Some evidence on the role of auditor tenure and auditors’ industry expertise, Journal of Accounting and Economics, 47, 265-287.
- Hit. A., Irrland, R., & Hoskisson, F. (2003). Strategic Management, Competitiveness and Globalization, south-western puplishers, 5th edition.
- Huanmin, Y., Shengwen, X. (2016). How does auditors’ work stress affect audit quality? Empirical evidence from the Chinese stock market, China Journal of Accounting Research, 9, 305–319.
- Jensen, M.C., & Meckling, W.H. (1976). Theory of the Firm: Managerial Behavior, Agency Costs and Ownership Structure. Journal of Financial Economics, 3, 305-360.
- Katima, S. (2005). Core competencies for riparian officials in developing the Mekong river: A Delphi study toward a modular training program, “Doctor” of education Silliman university.
- O’Keefe, T.R., King, R.D., & Gaver (1994). Audit Fees, industry specialization, and compliance with GASS reporting standard, Journal of Practice et Theory, 13, 41-55.
- Schipper, K., & Vincent, L. (2003). Earnings quality Accounting Horizons, Supplement, 97- 110.
- Seyyed, A.M., Mahdi, M., & Mohsen, K. (2013). An Investigation into the Relationship between Audit Committee and Audit Quality, Australian Journal of Basic and Applied Sciences, 6(10), 409-416.
- Titman, S., & Trueman. B. (1986). Information quality and the valuation of new issues", Journal of Accounting and Economics, 8(2), 159-172.