Research Article: 2025 Vol: 29 Issue: 2
The impact of Corporate Leverage on Financial Performance considering the Covid-19 period: Evidence from Saudi Industrial Firms
Hanoof Kadasah, King Abdulaziz University, Saudi Arabia
Heba Gazzaz, King Abdulaziz University, Saudi Arabia
Citation Information: Kadasah, H. Gazzaz, H., (2025). The Impact Of Corporate Leverage On Financial Performance Considering The Covid-19 Period: Evidence From Saudi Industrial Firms. Academy of Accounting and Financial Studies Journal, 29 DOI 10.5281/zenodo.17222352
Abstract
The paper investigates the effect of Operating and Financial Leverage on Financial Performance in the Saudi industrial sector. The study sample includes twenty-one listed and active firms from 2020 to 2023, considering the Covid-19 period. The study results showed that operating and financial leverage experienced significant fluctuations from 2020 to 2023, primarily due to the economic uncertainty caused by the Covid-19 pandemic. Companies adopted more conservative financial strategies, resulting in reduced loan and debt issuance. Additionally, the study runs Random Effects GLS (robust standard errors) to examine the effect of operating and financial leverage as well as year fixed impact on financial performance. The main results indicate that financial leverage has a significant and positive impact on the return on equity of Saudi industrial firms
Keywords
Operating Leverage, Financial Leverage, Financial Performance, Covid-19, Fixed and Random Effects.
Introduction
Financial performance is one of the key indicators that companies use to measure their success in terms of financial returns. It has gained significant attention from companies across various sectors as it provides a clear picture to all stakeholders about the efficiency of utilizing available financial resources (Matsoso & Benedic, 2016). According to (Dewi et al., 2023), a company's financial performance reflects its ability to meet the needs of its owners, shareholders, employees, regulatory bodies, investors, and other interested parties. It instills confidence that the company has enough financial capacity to meet its obligations and invests its resources wisely to preserve and grow them, ensuring business continuity and achieving desired growth rates.
Financial performance reveals the strengths and weaknesses of a firm's finances by establishing links between items in the balance sheet and the profit and loss account. The primary task involves selecting relevant information from the vast data in financial statements, organizing it to highlight significant relationships, and interpreting and drawing conclusions (Akmese et al., 2016).
Corporate leverage has been widely discussed and has garnered considerable attention in previous research. In structuring costs, companies generally experience significant barriers, which could influence net income, i.e., company performance (Istan et al., 2021). It involves fixed and variable costs, where fixed costs indicate operating leverage; higher fixed to total cost ratio suggests higher operating leverage, i.e., more dependence on fixed than variable costs. Companies with greater utilization of fixed assets incur substantial fixed costs, resulting in higher operating leverage (Dudycz, 2020).
Financial leverage can be defined as the ability of a company to generate greater returns compared to the costs. While financial leverage can be beneficial, it also conveys risks. It represents the extent to which an organization relies on borrowing from financial and banking institutions to finance its assets using fixed-income sources, such as loans or bonds. This reliance impacts the profits distributed to owners and, in turn, the level of risk they face from utilizing external funds to maximize shareholder returns (Almanaseer, 2024). Financial leverage, also known as long-term debt, forms the backbone of any business's capital structure. It differs from other types of capital in that creditors have claims against the company (Al Hawatmah & Shaban, 2023). They receive a fixed interest rate and are entitled to their principal in the event of the company's collapse. Transparency and satisfying long-term creditors require enhanced disclosures to eliminate uncertainties (Al Hawatmah & Shaban, 2023). Previous research suggests that moderate levels of operating and financial leverage are favorable for firm performance, while excessive leverage could deteriorate investor confidence and financial stability (Abor, 2005).
The aim of this study is to analyze the effect of operating and financial leverage on Saudi Arabian industrial companies’ financial performance. The industrial sector’s selection in this research was based on certain underlying factors, including the industrial sector’s significant contribution to GDP of the country, especially considering Saudi Vision 2030, aiming to reduce dependence on oil and diversify sources of income. Due to recent significant legislative and regulatory changes, supporting the sector via government support and incentives, an opportunity to assess the effect of these changes on industrial companies’ financial performance is created (Alhowirini et al., 2024). Moreover, the industrial sector has heavy reliance on investments due to highly capitalistic nature, which makes the sector vulnerable to fluctuations in energy prices and raw materials. The importance of studying operational and financial leverages’ impact on financial performance in the context of industrial companies is highlighted by these factors. Also, year fixed effects are included in the analysis to take into account the impact of Covid-19 and to test whether the pandemic had a significant influence on the Saudi industrial companies' business and thereby changed the operating and financial leverage roles in their financial performance, as measured by return on assets and return on equity. Pooled OLS recession and random effect GLS tests were applied following Al?Dabbas (2023) to examine the impact of corporate leverage on financial performance with year effect consideration. The main results indicate that financial leverage has a significant and positive impact on the return on equity of Saudi industrial firms. The reminder of the paper is organized as follows. Section 2 presents the theoretical framework, while Section 3 introduces the literature review to develop the hypotheses. Section 4 reports the methodology employed, Section 5 analyses the empirical results and Section 6 concludes.
Theoretical Framework
Operating leverage arises from fixed operating expenses in a firm's cost structure. It measures how effectively a firm uses fixed assets and expenses to generate sales (Dudycz, 2020). Operating leverage is high when a slight change in sales leads to a significant change in operating income, as fixed costs remain unchanged despite variations in sales levels (Istan et al., 2021). In the context of the effect on profitability, firms with high Operating leverage benefit disproportionately from increases in sales volume. Here, it is important to highlight the relevance of contingency theory with the assumption that the most advantageous level of operating leverage is determined by the firm's context, such as sector, competitive environment, and strategy. It must align with the firm's strategy, risk-bearing capacity, and the level of environmental uncertainty in the industry (Vaszkun & Koczkas, 2024). Financial leverage refers to the use of borrowed money to enhance returns to shareholders (Almanaseer, 2024). By utilizing debt financing, a firm can fund projects or investments that yield exceeds the cost of debt, thereby increasing the residual income for shareholders. Financial leverage enhances the potential return to shareholders and raises financial risk since debt service payments must be made regardless of a company's profitability. Several theories support this notion, which include Resource Dependency Theory, Agency Theory, Trade-off Theory, and Pecking Order Theory.
According to resource dependency theory, organizations require resources to maintain long-term viability. (Pfeffer & Salancik, 2003) opine that organizations can only get these resources from their surroundings, and other organizations wish to access the same resources. Simultaneously, it is stressed that the change strategies chosen by organizations to acquire resources increase their degree of reliance on the environment and other organizations (Jiang et al., 2022). Financial leverage or debt is a form of dependency on external capital markets. According to resource dependency theory, power is the ability of an actor to gain control over the resources that others require. This concept makes it clear that the disproportionate power that results from resource- based interactions puts pressure on the resource-dependent organization and necessitates that it comply with demands. In this regard, one of the organization's most significant environmental challenges is resource unpredictability. Resource concentration, resource availability uncertainty, and resource interconnectivity are the three sub-factors that fall under the umbrella of resource dependency (Jiang et al., 2022). Understanding the contract design for resolving agency issues and agency costs resulting from agency relations, particularly the delegation of decision-making to agents, is the primary goal of agency theory. Agency theory plays a part in financial accounting theory by explaining and forecasting the manager's decision to use accounting systems. Additionally, efficient contracting theory is increasingly based on agency theory. It is another foundation for comprehending profit management. One of the key hypotheses in economic and financial literature, spanning fields such as accounting, economics, political science, sociology, organizational behavior, and marketing, is the prevalence of wide agency difficulties in various types of organizations. To the study of operating and financial leverage, agency theory is highly relevant since it shows how the relationship between principals (owners/shareholders) and agents (managers) shapes leverage choices.
The trade-off theory assumes that while firms can utilize debt to finance their operations and potentially benefit from leverage, they must do so judiciously. In the event that the firm fails to utilize its debt optimally, it becomes increasingly likely to be subject to financial distress (Farooq et al., 2023). According to the concept, there is an equilibrium between a company's stability and its use of debt, or leverage. The percentage of a company's debt to equity is known as leverage. A company's profitability may be constrained by a lower leverage ratio, which creates a trade-off between the two aspects. Higher leverage could lead to bankruptcy; when earnings are unpredictable, businesses with high debt need to be more careful in debt payments. A company’s financial performance and long-term survival could have a detrimental effect due to excessive leverage.
Pecking order theory is another relevant theory, which proposes that businesses consider their sources of funding based on their specific hierarchy (Brealey et al., 2018). Debt financing is less expensive than equity financing and easier to acquire. Established companies prefer employing debt over equity, and consider equity finance as the last option (Myers & Majluf, 1984). Debt financing is preferred due to tax benefits and predictable set repayment schedules.
Literature Review and Hypothesis Development
To examine firm performance, financial performance is regarded as one of the most significant indicators, which assesses a company’s financial efficiency in using the resources of a company and fulfilling stakeholders’ objectives (Matsoso & Benedic, 2016; Dewi et al., 2023). Corporate leverage and financial performance have constituted a prominent area of research in finance (Enekwe et al., 2014). Leverage encompasses both operating and financial leverage, which significantly determines the nature of a firm's risk profile and its profitability, as measured by key metrics such as Return on Assets and Return on Equity, which are conventional benchmarks used to evaluate financial performance.
Recent empirical evidence from both international and Middle Eastern contexts indicates an indirect relationship between leverage (both operating and financial) and firms’ financial performance. This nuance is particularly pronounced in emerging market economies, such as Saudi Arabia. Several studies have examined the relationship between leverage and financial performance within the Saudi Arabian context.
(Alabdulkarim et al., 2024) studied the impact of operational and financial leverage on the market and book value of shares of banks listed on the Saudi Stock Market (Tadawul) from 2017 to 2019, considering the effect of company size, where the banking sector is a significant component of the Saudi economy, under some regulatory conditions and economic pressures. The results show that no financial and operating leverage effect on the book value of the stock was found. However, a positive relationship between operating leverage and the market value of the stock was found. In contrast, financial leverage did not affect the stock's market value and, consequently, did not affect financial decisions, which means that investors may view operational efficiency as a more significant determinant of bank valuation than financial leverage. Due to capital structure tradition and special regulatory environment of Saudi banks, financial leverage can be less relevant. In explaining both book and market values, the important role of firm size shows the significance of market power and scale economies in banking.
In the context of Saudi Arabia, previous research has examined the impact of COVID-19 on financial performance of businesses (Khojah, 2022). Such studies are important for estimating how global shocks can destabilize prevailing financial relationships and alter performance dynamics and leverage. It is observed that the relationship between leverage and financial performance in Saudi Arabia is significantly influenced by COVID-19. The negative effect on ROE and ROA suggests that during the COVID-19 pandemic, firms were not able to utilize leverage optimally due to significant economic challenges. The current research shows mixed findings regarding the effect of leverage on financial performance, which is influenced by methodological aspects, time or sector effects (Iqbal & Usman, 2018; Alabdulkarim et al., 2024). According to (Chen et al., 2018), sector characteristics’ changes can impact the leverage and performance relationship (Chen et al., 2018). Firm size and quality of reports also have crucial rounds (Alabdulkarim et al., 2024). Operating leverage tends to increase profits by magnifying returns in times of high demand (Chen et al., 2018). It has been argued that operating leverage in manufacturing firms increases profitability due to its fixed-cost structure. By increasing profits, operating leverage impacts financial performance when sales are high; however, operating leverage also increases risks when sales reduce. It has been concluded by Garcia et al. (2021) that high operating leverage is associated with higher profitability in good conditions. Based on the above discussion, the first hypothesis of the study is:
H1: There is a significant effect of operating leverage on the financial performance of Saudi industrial firms.
Previous research has observed a negative link between financial leverage and firms’ financial performance considering the fact that financial risk is created by higher interest payments (Ahmad et al., 2015). A study focusing on data extracted from Pakistan Stock Exchange finds a negative association between financial leverage and ROE, suggesting high debt has decreased shareholder returns (Iqbal & Usman, 2018). The study also finds a positive relationship between financial leverage and ROA, which is another performance indicator. It suggests that moderate use of debt improved asset utilization. It means that the effect of financial leverage could be different based on the capital structure employed or the financial metric used. Furthermore, in the context of Indonesian firms, (Husna et al., 2024) find a positive effect of all variables combined (financial leverage, along with intellectual capital and institutional ownership) on financial performance; however, the individual impact of financial leverage on performance was significant and negative.
It is observed that some studies indicated a negative relationship between financial leverage and firm performance, arguing that higher interest payments create financial risk (Ahmad et al., 2015). (Iqbal & Usman,. 2018) examined the impact of financial leverage on financial performance on Pakistan Stock Exchange over the period 2011–2015. Their findings revealed a significant negative relationship between financial leverage and return on equity, indicating that higher debt levels reduced shareholder returns. Conversely, they found a positive relationship between financial leverage and return on assets, suggesting that moderate use of debt can enhance asset utilization. These results imply that the impact of leverage on firm performance can differ depending on the financial metric used and the capital structure employed. Moreover, (Husna et al., 2024) examined the effects of intellectual capital, institutional ownership, and financial leverage on the financial performance of Indonesian Stock Exchange-listed banks during 2019-2022 using the principal indicator, return on equity. It was revealed that all factors combined have positive effects on financial performance and that intellectual capital and institutional ownership are positive and significant, but financial leverage was negative and significant.
On the contrary, a positive association with utilizing moderate financial leverage to improve external finance in the context of emerging markets is also reported (Chen et al., 2018). Thaddeus and Chigbu (2012) discovered that financial leverage enhances managerial efficiency and substantially influences banks' financial performance. It is recommended to utilize an optimum mix of debt and equity to improve financial performance and be competitive. The study by (Mansour et al., 2022) found a significant relationship between financial leverage and financial performance, as well as between financial leverage and investment efficiency. However, the study found that investment efficiency did not significantly mediate the connection between financial leverage and company financial performance. This means that financial leverage has a direct effect on the financial performance of Egyptian joint-stock firms. Moreover, (Abd-Elnaby et al., 2021) examined the interactive effect of financial leverage and the quality of financial reports on financial performance. The key finding was that the impact of financial leverage on financial performance is dependent on financial reporting quality. Good-quality financial reporting may enable firms to control and utilize leverage constructively and improve performance, while low-quality financial reporting is able to conceal the true impact of leverage, and hence decisions are at suboptimal levels and performance will be compromised. This finding considers the significance of transparency and governance in referring to the connection between leverage and performance. These findings align with those of (Dewi et al., 2023), who reported that a company's financial performance reflects its ability to meet the demands of its owners, shareholders, employees, regulatory bodies, investors, and other stakeholders. Excellent reporting is vital in meeting these various stakeholder demands. Therefore, the second hypothesis is:
H2: Financial leverage has a statistically significant impact on the financial performance of the Saudi industrial firms.
Studies indicated that Return on Assets and Return on Equity declined severely during the pandemic years (2020- 2021) leading to a loss of financial stability. The firm also possessed some weaknesses that needed to be addressed to ensure continuity and development, for instance, being unable to control operational expenses, which affected the firm's profitability and later showed partial recovery from 2022, once the markets settled.
Hence, the current study includes year fixed effects to control Covid’s impact and examine whether the pandemic has significantly impacted Saudi industrial firms' business and financial environment, thereby changing the role of operating and financial leverage on financial performance, as indicated by Return on Assets and Return on Equity (Khojah, 2022). Figure 1 show the conceptual framework of this study, which demonstrates the relationship between corporate leverage and financial performance in Saudi industrial firms with the consideration of the Covid-19 pandemic period from 2020 to 2023

Figure 1 Conceptual Framework
Methodology
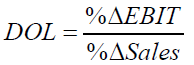
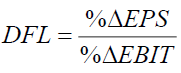
To examine the effects of operating and financial leverage on the financial performance of Saudi-listed industrial firms, a quantitative method was applied for the period 2020-2023 following Al?Dabbas (2013) approach. The study includes 21 Saudi Industrial firms from multiple sectors, including capital goods, commercial and professional services, and transportation1. The financial data, including operating leverage (DOL), financial leverage (DFL), and financial performance measured by return on assets (ROA) and return on equity (ROE), were computed based on manually collected data from the publicly provided financial statements of the firms. The variables extracted from the financial statements were earnings per share (EPS), earnings before interest and taxes (EBIT), revenue (sales), net income (NI), total equity (TE) and total assets (TA).
The total number is 21 not 22 as Al-khodari Sons Co. went bankrupt on 2021 and therefor were excluded.
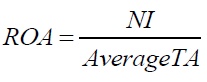
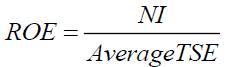
Following are the definitions and mathematical formulas of the main variables:
Operating Leverage (DOL) is the ratio of the percentage change in EBIT to the percentage change in sales.
Financial leverage (DFL) is the ratio between the percentage change in EPS and the percentage change in EBIT.
ROE is measured by dividing NI by TA.
ROE is the ratio between NI and average total shareholders’ equity (TSE).
The links between the leverage ratios (DOL and DFL) and performance indicators (ROA and ROE) were first assessed using pooled ordinary least squares (OLS) regression. Pooled OLS statistically measures the impact of one or more predictors on the dependent variable(s) (Wooldridge, 2016). The following are the proposed OLS regression equations:
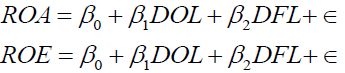
Where β is the coefficient, while ? is the error term
Considering the panel dataset, the study tested fixed and random effects models, which help address biases and heterogeneity (Wooldridge, 2010). A fixed effects (FE) model examines relationships between independent and dependent variables within an entity where each entity’s characteristics may influence the independent variables. It means FE assumes controlling individual characteristics that may bias or impact the independent or dependent variables, i.e., controlling time-invariant characteristics (Torres-Reyna, 2007). On the other hand, a random effects (RE) model assumes that the variation across entities is uncorrelated with the model’s independent variables and is assumed to be random (Torres-Reyna, 2007). Although pooled OLS is simpler than FE and RE regressions, it ignores the panel structure, treating all cases as a single dataset. It can be problematic when there is unobserved heterogeneity across entities or individuals and heteroskedasticity or autocorrelation within panels. Therefore, the unobserved heterogeneity will be tested using the Breusch-Pagan Lagrangian Multiplier (LM) Test, the Breusch– Pagan/Cook–Weisberg test for heteroskedasticity, and the Wooldridge Test assesses autocorrelation. The FE and RE models can be written as:
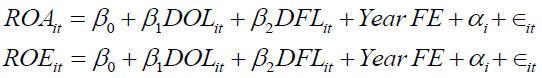
Where ROA and ROE are financial performance outcomes, DOL and DFL are corporate leverage measures, Year FE is a variable to control the effect of the Covid-19 period, β is the coefficient, α is the firm fixed effect, and ? is the error term.
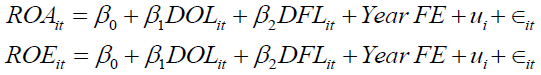
Where ROA and ROE are financial performance outcomes, DOL and DFL are corporate leverage measures, Year FE is a variable to control the effect of the Covid-19 period, β is the coefficient, u is the firm-specific random effect, and ? is the error term2.
EmpiricalAnalysis
To explore the dataset, the study performed descriptive statistics, which included computing averages, standard deviations, maximum and minimum values. The data on DOL, DFL, ROA and ROE of Saudi industrial firms were collected and analyzed from 2020 to 2023. See Table 1.
| Table 1 Descriptive Statistics | |||||
| N | Minimum | Maximum | Mean | Std. Deviation | |
| Panel A: Operating Leverage (DOL) | |||||
| 2020 | 21 | -36.86 | 22.52 | -1.9462 | 12.794 |
| 2021 | 21 | -126 | 84 | 2.311 | 43.9391 |
| 2022 | 21 | -126.69 | 9.36 | -7.0286 | 28.2808 |
| 2023 | 21 | -220 | 40.25 | -8.7903 | 51.2997 |
| Panel B: Financial Leverage (DFL) | |||||
| 2020 | 21 | -2.95 | 65.2 | 6.7171 | 15.7899 |
| 2021 | 21 | -16.7 | 10.58 | 0.3795 | 4.91994 |
| 2022 | 21 | -0.25 | 6.31 | 1.3286 | 1.91675 |
| 2023 | 21 | -1112.4 | 2.72 | -53.243 | 242.71 |
| Panel C: Return on Assets (ROA) | |||||
| 2020 | 21 | -0.29 | 0.17 | -0.0069 | 0.10543 |
| 2021 | 21 | -0.45 | 0.15 | -0.0043 | 0.1268 |
| 2022 | 21 | -0.63 | 0.15 | -0.0108 | 0.16525 |
| 2023 | 21 | -0.22 | 0.13 | 0.0098 | 0.08704 |
| Panel D: Return on Equity (ROE) | |||||
| 2020 | 21 | -1.48 | 0.31 | -0.0805 | 0.36615 |
| 2021 | 21 | -1.06 | 0.4 | -0.0641 | 0.34808 |
| 2022 | 21 | -0.28 | 2.76 | 0.18 | 0.60826 |
| 2023 | 21 | -0.61 | 0.29 | 0.009 | 0.20806 |
This table reports the mean, standard deviation, maximum, and minimum values for the main variables of Saudi industrial firms considering the Covid-19 period from 2020 to 2023. Panel A illustrates the operating leverage variable as the percentage change in EBIT to the percentage change in sales volume. Panel B show financial leverage as calculated by dividing the percentage change in EPS by the percentage change in EBIT. Panel C illustrates the return on assets measured by dividing net income by average total assets. Panel D shows the return on equity as a ratio of net income to average total shareholders’ equity.
The table shows the following: Panel A indicates an increase in the mean of the DOL from 2020 to 2021. However, it began to decline in 2022, which may be attributed to the repercussions of the Covid-19 pandemic and companies' efforts to mitigate financial risk. The downward trend continued, in 2023 indicating a decrease in investments. Panel B indicates a sharp decline in the DFL, which dropped from 2020 to its lowest level in 2021. The sharp drop in DFL is likely due to companies reducing debt to minimize financial risk. This was a response to the economic uncertainty that followed the Covid-19 pandemic. However, DFL slightly increased in 2022; this is likely due to the continuation of business operations for companies after the Covid-19 pandemic. However, in 2023, a sharp decline in DFL was observed, mainly due to a shift toward self-financing and high borrowing costs.
Moreover, from 2020-2021, Panel C shows a reduction in ROA, mainly due to the pandemic effect, which influenced the profitability. In 2022, ROA increased slightly as business operations resumed and gradual recovery was observed. During 2023, ROA continued to increased, showing greater investment returns and improved operational efficiency. An increased ROE was observed during 2021 in panel D compared to 2020 due to initial recovery from the pandemic. The ROE continued to rise due exceptional income or surge in profits in post pandemic recovery.
Panel C indicates a decline in the ROA from 2020 to 2021, which may be due to the lingering effects of the Covid- 19 pandemic, which continued to impact profitability. However, the ROA slightly increased thereafter in 2022, which could be attributed to the gradual recovery and resumption of business operations. The ROA continued to rise in 2023, reflecting improved operational efficiency and increased investment returns. Panel D indicates an increase in the ROE from the year 2020 compared to the year 2021 due to improved financial performance as companies recovered from the initial impact of the pandemic. The ROE continued to rise sharply afterwards, which could be attributed to a surge in profits or exceptional income during the post-pandemic recovery phase. The ROE then declined in 2023 due to reduced profitability or normalization of earnings after an unusually high return in the previous year.
Ordinary Least Squares Regression Analysis
Table 2 examines the effects of DOL and DFL on the firm's profitability measure, ROA, by initially running a pooled ordinary least squares (OLS) regression. The results indicate that DOL and DFL have no significant effect on ROA (F = 0.24, p = 0.7853). The model explains a negligible amount of variance in the outcome.
| Table 2 OLS Regression (ROA) | ||||
| ROA | Coefficient | Std. err. | t | P>t |
| DOL | -0.0001 | 0.0004 | -0.36 | 0.719 |
| DFL | 0.0001 | 0.0001 | 0.59 | 0.556 |
| Constant | -0.0028 | 0.0136 | -0.21 | 0.836 |
| F (2, 81) | 0.24 | |||
| Prob > F | 0.7853 | |||
| R-squared | 0.0059 | |||
| Adj R-squared | -0.0186 | |||
| Number of obs. | 84 | |||
This presents the results of estimating OLS regressions, where the return on assets is measured by dividing net income by average total assets. DOL is the operating leverage variable, represented by the percentage change in EBIT and the percentage change in sales volume. DFL is the financial leverage as calculated by dividing the percentage change in EPS by the percentage change in EBIT.
Table 3 examines the effects of DOL and DFL on the firm's profitability measure, ROE, by initially running a pooled ordinary least squares (OLS) regression. The results indicate that DOL and DFL have no significant effect on ROE (F = 1.37, p = 0.2605). The model explains a negligible amount of variance in the outcome. Considering the insignificant effects, the study performs additional tests.
| Table 3 OLS Regression (ROE) | ||||
| ROE | Coefficient | Std. err. | T | P>t |
| DOL | -0.0006 | 0.0012 | -0.46 | 0.648 |
| DFL | 0.0006 | 0.0004 | 1.58 | 0.117 |
| Constant | 0.0155 | 0.0455 | 0.34 | 0.734 |
| F (2, 81) | 1.37 | |||
| Prob > F | 0.2605 | |||
| R-squared | 0.0327 | |||
| Adj R-squared | 0.0088 | |||
| Number of obs. | 84 | |||
This presents the results of estimating OLS regressions, where the return one qulity is calculated as a ratio of net income to average total shareholders’ equity. DOL is the operating leverage variable, represented by the percentage change in EBIT and the percentage change in sales volume. DFL is the financial leverage as calculated by dividing the percentage change in EPS by the percentage change in EBIT.
Hausman Test
Considering the panel dataset of this study and the problems associated with running pooled OLS in panel data, the study tested fixed and random effects models, which address biases and heterogeneity. The fixed effects model controls for time-invariant unobserved heterogeneity, while the random effects model assumes random individual- specific variation (Wooldridge, 2010).
The Hausman test helps determine whether fixed effects or random effects are appropriate by testing whether predictors correlate with the unobserved effects. Table 4 argues that the Hausman test was insignificant (p > 0.05)for both outcomes (ROA and ROE). It means that the difference between fixed effects and random effects estimates is not systematic, and there is no correlation between the regressors and unobserved effects, suggesting that the random effect model is efficient and consistent, and can be used to study the impact of operating and financial leverage on financial performance.
| Table 4 Hausman Test | ||
| ROA | chi2(5) | 0.55 |
| Prob > chi2 | 0.9901 | |
| ROE | chi2(5) | 10.54 |
| Prob > chi2 | 0.0613 | |
This table presents the results of the Hausman test for return on assets and return on equity, where the return on assets is calculated by dividing net income by average total assets, and the return on equity is determined as a ratio of net income to average total shareholders’ equity.
Random Effects GLS Regression
Table 5 presents the random-effects GLS regression to investigate the impacts of DOL, DFL, and year fixed effects on ROA, considering the pandemic period. The results suggest that there are no statistically significant predictors, and the low R-squared value indicates limited explanatory power (< 0.01).
| Table 5 Random-Effects GLS Regression Results ROA | ||||
| Variable | Coefficient | Std. Error | z-value | p-value |
| DOL | -0.00011 | 0.00031 | -0.37 | 0.712 |
| DFL | 2.65E-05 | 9.58E-05 | 0.28 | 0.782 |
| Year 2021 | 0.00327 | 0.02894 | 0.11 | 0.91 |
| Year 2022 | -0.00434 | 0.02895 | -0.15 | 0.881 |
| Year 2023 | 0.01747 | 0.02953 | 0.59 | 0.554 |
| Constant | -0.00731 | 0.02766 | -0.26 | 0.792 |
| R-squared (Overall) | 0.0093 | |||
| Number of Observations | 84 | |||
This table presents the Random-Effects GLS Regression Results for the return on assets, which is measured by dividing net income by average total assets, covering the Covid-19 period from 2020 to 2023. DOL is the operating leverage variable calculated as the percentage change in EBIT and the percentage change in sales volume. DFL is the financial leverage as calculated by dividing the percentage change in EPS by the percentage change in EBIT.
Table 6 presents the random-effects GLS regression, which investigates the impacts of DOL, DFL, and year fixed effects on ROE, taking into account the pandemic period. The results suggest that there is no statistically significant effect of DOL on ROE. In contrast, the effect of DFL on ROE is marginally significant, with a coefficient of 0.00062 at a 10% significance level. Moreover, the year 2022 exhibited significant improvements, with a coefficient of 0.262 at a 5% significance level, where the model explained 9.6% of the variance based on the R-squared value. The results are consistent with previous studies, which have shown that Covid-19 pandemic caused significant disruptions to supply chains in Saudi Arabia’s industrial sector, affecting the availability of raw materials and spare parts, and prompting firms to adopt new operational strategies to maintain production and supply processes(Aljuaid et al., 2023) On the other hand, the recovery in 2022 was driven by the diversification of the economy, as outlined in Vision 2030, which attracted Foreign Direct Investment (FDI) and revitalized the industrial sector (Kane, 2021). Therefore, the financial leverage's marginally significant effect shows that higher debt financing is likely to increase equity returns.
| Table 6 Random-Effects GLS Regression Results ROE | ||||
| Variable | Coefficient | Std. Error | z-value | p-value |
| DOL | -0.00032 | 0.00122 | -0.26 | 0.795 |
| DFL | 0.00062 | 0.00037 | 1.65 | 0.098* |
| Year 2021 | 0.02166 | 0.12564 | 0.17 | 0.863 |
| Year 2022 | 0.26224 | 0.12569 | 2.09 | 0.037** |
| Year 2023 | 0.12447 | 0.12781 | 0.97 | 0.33 |
| Constant | -0.0853 | 0.08882 | -0.96 | 0.337 |
| R-squared (Overall) | 0.0955 | |||
| Observations | 84 | |||
This table presents the Random-Effects GLS Regression Results for the return on equity, which is measured by dividing net income by average total shareholders’ equity, covering the Covid-19 period from 2020 to 2023. DOL is the operating leverage variable calculated as the percentage change in EBIT and the percentage change in sales volume. DFL is the financial leverage as calculated by dividing the percentage change in EPS by the percentage change in EBIT.
**Statistical significance at the 5% level.
*Statistical significance at the 10% level.
At this point, the study compared RE models with the pooled OLS models tested earlier using the Breusch-Pagan Lagrange Multiplier (LM) test. It examines whether there are no company-specific effects, i.e., no unobserved heterogeneity. In other words, the test examines if the pooled OLS was sufficient (Breusch & Pagan, 1980). According to the results of the LM tests, in the case of ROA, the null hypotheses of no company-specific effects or panel-level effects were rejected, χ² (1) = 23.78, p < 0.001. This indicates that there was significant unobserved heterogeneity across companies, and a random effects model is statistically justified. On the other hand, when the ROE is tested, the test statistic is insignificant, χ²(1) = 0.00, p = 1.000, which suggests that there is no evidence of unobserved heterogeneity; therefore, pooled OLS is appropriate.
Moreover, in random effects models, testing for serial autocorrelation and heteroscedasticity is important to ensure the reliability, efficiency, and validity of the regression results (Preinerstorfer & Potscher, 2016). Testing for serial autocorrelation is important because serial autocorrelation (error terms are correlated over time) leads to biased standard errors, mis-specified dynamics, and inefficient estimators (Wooldridge, 2016). Therefore, the Wooldridge test was applied, and the coefficient estimates for ROA give strong evidence of negative 1st-order autocorrelation based on a significant coefficient for the lagged residual term (luhat= -1.08, p<0.01). Similar results are observed in the case of ROE, where substantial evidence of negative 1st-order autocorrelation is found(luhat= -1.04, p<0.01). This indicates a need for an AR correction.
Heteroscedasticity undermines inference and model efficiency, resulting in inefficient parameter estimates and biased model selection (Gazilas, 2024). Therefore, it is crucial to consider these issues to ensure that the results are not misleading. For detecting heteroskedasticity, the Breusch-Pagan/Cook-Weisberg test is used. When assessing ROA, the test statistic is statistically insignificant, χ² (1) = 2.59, p = 0.11. It means there is constant variance. On the other hand, in the case of ROE, the test statistic is statistically significant, χ² (1) = 10.46, p < 0.01. This means that correcting for heteroskedasticity is required to ensure valid inference for ROE only. In the following section, the AR correction for both ROA and ROE, and robust standard errors regression (to address heteroscedasticity) were reported for ROE.
AR Correction and Robust Standard Errors
To consider autocorrelation, the study applies random effect GLS regression AR (1) correction for ROA and ROE3. In the case of ROA, no significant predictors were observed with very low explanatory power. The AR (1) coefficient was 0.0596 suggesting minimal autocorrelation. It means that, in the ROA model, serial autocorrelation was not a major concern and AR (1) correction was likely unnecessary.
Similarly, when random effect GLS regression with AR (1) correction for ROE was run, no significant explanatory variables were observed . However, the AR (1) correction is appropriate. The AR(1) coefficient was -0.2685, indicating moderate negative autocorrelation. It also violates the OLS assumption; therefore, a GLS model would be considered. Here, it is important to highlight that previously, the Breusch-Pagan LM test found pooled OLS appropriate; however, the LM test did not assess AR (1) disturbances, and OLS would give biased standard errors. In this situation, random effect GLS with robust standard errors (SE) is recommended (Wooldridge, 2010) to examine the effect of DOL, DFL, and year fixed effects on ROE.
Therefore, Table 7 presents the results of using random effect GLS with robust standard errors to mitigate heteroskedasticity and correct for serial correlation. The results indicate that DOL has a statistically insignificant impact on ROE. On the other hand, DFL has a significant and positive impact on ROE, with a coefficient of 0.0006 at a 1% significance level. It suggests that a unit increase in DFL would increase ROE by 0.06%, after controlling for the year effect from 2021 to 2013, covering the pandemic period. On the other hand, the effect of Between- company differences explain a 51.2% variance in ROE, while the explanatory power of time-varying factors is limited, with an R-squared value of 5.8%.
| Table 7 Random-Effects GLS (Robust Standard Errors) | ||||
| Variable | Coefficient | Robust Std. Error | z-value | p-value |
| DOL | -0.0003 | 0.0005 | -0.62 | 0.533 |
| DFL | 0.0006 | 0.00005 | 11.79 | 0.000*** |
| Year 2021 | 0.0217 | 0.0658 | 0.33 | 0.742 |
| Year 2022 | 0.2622 | 0.1631 | 1.61 | 0.108 |
| Year 2023 | 0.1245 | 0.0829 | 1.5 | 0.133 |
| Constant | -0.0853 | 0.0827 | -1.03 | 0.302 |
| R-Squared Within | 0.058 | |||
| R-Squared Between | 0.512 | |||
| R-Squared Overall | 0.096 | |||
| N | 84 | |||
Overall, the empirical results reject Hypothesis H1, the operating leverage has a statistically significant impact on the financial performance of the Saudi industrial firms which aligned with previous research who has also observed the limited impact of DOL; for example, (Asraf & Desda, 2020) found no significant impact of DOL on firm profitability ratios, such as ROA and ROE. In Saudi Arabia, the post-2020 period introduced unique stressors (such as pandemic disruptions, oil price fluctuations), which amplified that leverage is a negative firm driver performance before as well as after the pandemic evidenced however, the effect grows more intense after the crisis. (Helmi et al., 2021). However, this result is not consistent with Al-Dabbas (2023), who found a significant positive impact of operating leverage on financial performance.
In contrast, accepting Hypothesis H2, the financial leverage has a statistically significant impact on the financial performance of the Saudi industrial firms which is consistent with previous studies where that DFL has a direct effect on ROE; during profitable periods, it amplified returns but during downturns, it increased risk (Aloshaibat, 2021; Al?Dabbas,2023). It means financial leverage increases the potential return to shareholders but also raises financial risk. It aligns with the trade-off theory which suggests that companies utilizing debt for financing their operations must ensure they can reap the benefits of leveraging capital effectively, i.e., a firm who is unable to manage its debt properly is likely to face financial distress (Farooq et al., 2023). According to Thaddeus and Chigbu (2012), financial leverage enhances managerial efficiency and has a significant influence on the financial performance of banks. It recommended the utilization of an optimum mix of debt and equity to improve financial performance. Previous research highlights several reasons that explain how financial leverage enhances ROE in the industrial sector. These include the tax shield effect, equity multiplier and strategic investment and growth (Astuti, 2021)
This table reports the robust standard error for a Random-Effects GLS regression on the return on equity, calculated as the ratio of net income to average total shareholders’ equity, considering the Covid-19 period from 2020 to 2023. DOL is the operating leverage variable calculated as the percentage change in EBIT and the percentage change in sales volume. DFL is the financial leverage as calculated by dividing the percentage change in EPS by the percentage change in EBIT, ***Statistical significance at the 1% level.
Conclusion and Recommendation
The research aims to examine the effect of operating and financial leverage on the financial performance, as measured by return on assets and return on equity, of Saudi industrial companies. The data was collected for 21 listed and active firms from 2020 to 2023, considering the pandemic period. Twenty-one firms make up the sample and are divided into three sectors: Capital Goods, Commercial and Professional Services, and Transportation.
The study concluded that the data reveals significant fluctuations in the operating leverage ratio of companies over the period from 2020 to 2023. After an increase in 2020-2021, a sharp decline was observed in the following years due to a shift towards more conservative financial strategies and a reduction in financial risk. The results revealed a trend in financial leverage, showing significant shifts, over the observed period, in corporate financing behavior. Initially, companies reduced their reliance on debt in response to the uncertainty caused by the Covid- 19 pandemic, aiming to lower financial risk. A modest recovery followed as business activities resumed, but a sharp decline occurred again, likely driven by rising borrowing costs, a move toward self-financing, and potential operational losses that reduced the capacity to maintain debt levels. Therefore, the results show that both financial and operating leverage were highly volatile in this time, mostly owing to economic uncertainty caused by the Covid-19 pandemic. The result is that firms used more conservative financing policies, hence less borrowing and issuing of Debt.
Moreover, the study runs random effects GLS (robust standard errors) to examine the effect of DOL, DFL, and year fixed effects on ROE. Results confirmed that the DFL has a significant and positive impact on ROE, thus supporting H2. On the other hand, H1 is rejected, i.e., DOL has no significant impact on ROE or ROA of Saudi Industrial firms. Based on the findings of the paper, it is recommended to the Saudi industrial firms to increase their proportion of long-term debt strategically in their capital structure for enhancing shareholder returns with a balance i.e. between debt and equity financing to maintain financial flexibility and reduce reliance on one source of capital.
End Notes
1https://200listedsecurities.saudiexchange.sa/Resources/200ListedSecurities/industrials/industrials_directory.htm.
2All tests are applied in STATA version 17.
Appendix
| Appendix 1 Random Effects GLS Regression With AR(1) Correction (ROA As Dependent Variable) | ||||
| Model Coefficients | ||||
| Variable | Coefficient | Std. Error | z-value | p-value |
| DOL | -0.00013 | 0.000302 | -0.42 | 0.675 |
| DFL | 1.75E-05 | 9.28E-05 | 0.19 | 0.851 |
| Constant | -0.00321 | 0.020261 | -0.16 | 0.874 |
| Model Diagnostics: | ||||
| Statistic | Value | |||
| R² (Within) | 0.0014 | |||
| R² (Between) | 0.0123 | |||
| R² (Overall) | 0.0041 | |||
| Observations | 84 | |||
| Number of Groups | 21 | |||
| Observations per Group | 4 | |||
| Variance Components: | ||||
| Parameter | Value | Interpretation | ||
| ρ_ar (AR1 coefficient) | 0.0596 | Minimal autocorrelation | ||
| σ_u (panel SD) | 0.0771 | Moderate panel-level variation | ||
| σ_e (error SD) | 0.0925 | |||
| ρ_fov (fraction of variance) | 0.4097 | 40.97% variance due to panel effects | ||
| θ | 0.468 | Transformation parameter | ||
| Random Effects GLS Regression with AR(1) Disturbances (ROE Model) | ||||
| Model Coefficients: | ||||
| Variable | Coefficient | Std. Error | z-value | p-value |
| DOL | -0.00057 | 0.001255 | -0.45 | 0.651 |
| DFL | 0.000393 | 0.000374 | 1.05 | 0.293 |
| Constant | 0.018392 | 0.044006 | 0.42 | 0.676 |
| Model Fit Statistics: | ||||
| Statistic | Value | |||
| R² (Within) | 0.0002 | |||
| R² (Between) | 0.4684 | |||
| R² (Overall) | 0.0321 | |||
| Observations | 84 | |||
| Number of Groups | 21 | |||
| Obs per Group | 4 | |||
| Variance Components: | ||||
| Parameter | Value | Interpretation | ||
| ρ_ar (AR1 coeff.) | -0.2685 | Moderate negative autocorrelation | ||
| σ_u (panel SD) | 0.1104 | |||
| σ_e (error SD) | 0.3903 | |||
| ρ_fov (panel var.) | 0.0741 | Only 7.4% variance from panel effects | ||
| θ | 0.1725 | |||
References
Abor, J. (2005). The effect of capital structure on profitability: an empirical analysis of listed firms in Ghana. The journal of risk finance, 6(5), 438-445.
Indexed at, Google Scholar, Cross Ref
Ahmad, N., Salman, A., & Shamsi, A. (2015). Impact of financial leverage on firms’ profitability: An investigation from cement sector of Pakistan. Research journal of finance and accounting, 6(7), 2222-1697.
Akmese, H., Aras, S., & Akmese, K. (2016). Financial performance and social media: A research on tourism enterprises quoted in Istanbul stock exchange (BIST). Procedia Economics and Finance, 39, 705-710.
Indexed at, Google Scholar, Cross Ref
Alabdulkarim, N., Kalyanaraman, L., & Alhussayen, H. (2024). The impact of firm size on the relationship between leverage and firm performance: evidence from Saudi Arabia. Humanities and Social Sciences Communications, 11(1), 1-12.
Indexed at, Google Scholar, Cross Ref
Al-Hawatmah, Z., & Shaban, O. S. (2023). The effect of financial leverage on company’s capital structure: Evidence from developing market. Corporate and Business Strategy Review, 4(2), 168-174.
Indexed at, Google Scholar, Cross Ref
Aljuaid, A. M., Shamsy, M. A., & Ghosh, A. (2023). The Impact of the Covid-19 Pandemic on Supply Chains (an Applied Study on the Industrial Sector in the Kingdom of Saudi Arabia-the Packaging Sector). Ijrsp, 4(46), 51-84.
Indexed at, Google Scholar, Cross Ref
Almanaseer, S. (2024). The Impact of Equity Financing on Financial Performance: Evidence from Jordan. Foundations of Management, 16(1), 157-176.
Indexed at, Google Scholar, Cross Ref
Aloshaibat, S. D. (2021). Effect of financial leverage on the financial performance of Jordanian public shareholding companies: Applied study on the financial sector of Jordan for the period of 2015-2019. International Journal of Economics and Financial Issues, 11(2), 47.
Indexed at, Google Scholar, Cross Ref
Asraf, A., & Desda, M. M. (2020). Analysis of the effect of operating leverage and financial leverage on companies profitability listed on Indonesia Stock Exchange. Ilomata International Journal of Management, 1(2), 45-50.
Indexed at, Google Scholar, Cross Ref
Astuti, W. A. (2021). Analysis of Company Size and Leverage on Profitability. In Proceeding of International Conference on Business, Economics, Social Sciences, and Humanities (Vol. 4, pp. 346-353).
Indexed at, Google Scholar, Cross Ref
Brealey, R. A., Myers, S. C., Allen, F., & Mohanty, P. (2018). Principles of corporate finance, 12/e (Vol. 12). McGraw-Hill Education.
Chen, Z., Harford, J., & Kamara, A. (2019). Operating leverage, profitability, and capital structure. Journal of financial and quantitative analysis, 54(1), 369-392.
Indexed at, Google Scholar, Cross Ref
Dewi, I. G. A. R. P., Dewi, C. I. R. S., & Yamawati, N. K. S. (2023). Financial Performance and Corporate Value With Good Corporate Governance As a Moderation of High and Low Profile Companies. International Journal of Social Science, 3(2), 129-142.
Indexed at, Google Scholar, Cross Ref
Dudycz, T. (2024). Operating leverage: A critical analysis of the concept and the methods of measurement: Apalancamiento operativo: Un análisis crítico del concepto y de los métodos de medición. Revista de Contabilidad-Spanish Accounting Review, 27(2), 195-211.
Farooq, M., Hunjra, A. I., Ullah, S., & Al-Faryan, M. A. S. (2023). The determinants of financial distress cost: A case of emerging market. Cogent Economics & Finance, 11(1), 2186038.
Indexed at, Google Scholar, Cross Ref
Gazilas, E. T. (2024). Does Urban Fixed-Line Telecommunication Density Influence Profitability and Operational Efficiency in Greece's Telecommunications Industry?. Finance, Accounting and Business Analysis, 6(2), 228-239.
Indexed at, Google Scholar, Cross Ref
Helmi, A., Abdullatif, M., & Basaif, M. S. (2021). The impact of firm characteristics on firm performance during the covid-19 pandemic: evidence from Saudi Arabia. Asian Economic and Financial Review, 11(9), 693-709.
Indexed at, Google Scholar, Cross Ref
Husna, A., Zulyana, M., Aryani, D. S., & Andriyani, I. (2024). The Influence Of Intellectual Capital And Leverage On Financial Performance In Banking Companies Listed On The Indonesian Stock Exchange. International Journal of Management and Business Economics, 3(1), 35-42.
Indexed at, Google Scholar, Cross Ref
Iqbal, U., & Usman, M. (2018). Impact of financial leverage on firm performance: Textile composite companies of Pakistan. SEISENSE Journal of Management, 1(2), 70-78.
Indexed at, Google Scholar, Cross Ref
Istan, M., Husainah, N., Murniyanto, M., Suganda, A., Siswanti, I., & Fahlevi, M. (2021). The effects of production and operational costs, capital structure and company growth on the profitability: Evidence from manufacturing industry. Accounting, 7(7), 1725-1730.
Indexed at, Google Scholar, Cross Ref
Jiang, H., Luo, Y., Xia, J., Hitt, M., & Shen, J. (2023). Resource dependence theory in international business: Progress and prospects. Global strategy journal, 13(1), 3-57.
Indexed at, Google Scholar, Cross Ref
Kane, F. (2021). Vision 2030 reforms fuel Saudi recovery from coronavirus pandemic, IMF says. Arab News.
Khojah, M. (2022). An analysis of impact of covid-19 pandamic on the economy of Saudi Arabia. Academy of Accounting and Financial Studies Journal, 26(6), 1-09.
Mansour, M., Al Amosh, H., Alodat, A. Y., Khatib, S. F., & Saleh, M. W. (2022). The relationship between corporate governance quality and firm performance: The moderating role of capital structure. Sustainability, 14(17), 10525.
Indexed at, Google Scholar, Cross Ref
Matsoso, M. L., & Benedict, O. H. (2016). Financial performance measures of small medium enterprises in the 21st century. Journal of economics, 7(2-3), 144-160.
Indexed at, Google Scholar, Cross Ref
Myers, S. C., & Majluf, N. S. (1984). Corporate financing and investment decisions when firms have information that investors do not have. Journal of financial economics, 13(2), 187-221.
Pfeffer, J., & Salancik, G. (2015). External control of organizations—Resource dependence perspective. In Organizational behavior 2 (pp. 355-370). Routledge.
Indexed at, Google Scholar, Cross Ref
Preinerstorfer, D., & Pötscher, B. M. (2016). On size and power of heteroskedasticity and autocorrelation robust tests. Econometric Theory, 32(2), 261-358.
Indexed at, Google Scholar, Cross Ref
Torres-Reyna, O. (2007). Panel data analysis fixed and random effects using Stata (v. 4.2). Data & Statistical Services, Priceton University, 112(1), 1-40.
Vaszkun, B., & Koczkas, S. (2024). Contingency theory. ResearchGate.
Wooldridge, J. M. (2010). Econometric analysis of cross section and panel data. MIT press.
Wooldridge, J. M. (2016). Introductory econometrics a modern approach. South-Western cengage learning.
Received: 01-Apr-2025, Manuscript No. AAFSJ-25-16032; Editor assigned: 02-Apr-2025, Pre QC No. AAFSJ-25-16032(PQ); Reviewed: 16- Apr-2025, QC No. AAFSJ-25-16032; Revised: 21-Apr-2024, Manuscript No. AAFSJ-25-16032(R); Published: 28-Apr-2025