Research Article: 2018 Vol: 24 Issue: 3
The Impact of Self-assessment System On Compliance Levels of Small And Medium Enterprises Case Study van Sales Company
Wadesango, University of Limpopo
Mutema, Midlands State University
Mhaka, Midlands State University
Keywords
Self-Assessment, Compliance, Small Enterprises, Medium Enterprises.
Introduction
The study aimed at assessing the effect of self-assessment systems on the compliance levels of SME’s. Various fiscal reforms aimed at broadening the tax base have been successfully introduced by Zimra and one of them is the Self-Assessment of Income Tax. Notable authors such as (Okello, 2014; Appah, 2013; Farik, 2016) are of the view that voluntary tax compliance is best achieved through a system of self-assessment. They also agree that the self- assessment system is efficient in administering cost reduction and they came up with a key assumption that self-assessment is based on the trustworthy of the tax payer for they know the profits they are making in their business.
However, critics argue that tax knowledge, simplicity of the tax legislation and effectiveness of the tax audits are factors that contribute to the compliance levels of SME’s. Scholars such as Dubin & Wilde (2014), James & Alley (2014), Dziro (2016), Baer & Silvani (2013) Chifamba (2015) argued that self-assessment on its own cannot increase compliance levels and other factors like tax knowledge of the tax payers, simplicity of the tax system, risk based tax audits and simple filing procedures should be present. Lack of knowledge can cause a tax payer to evade tax unknowingly (Erard & Feinstein, 2011).
The above researchers focused on the impact of self-assessment system in relation to some developed countries where there are stable economic environments and concluded that the self- assessment system enhanced with other factors brings compliance from SME’s, hence neglecting the fact that in developing countries with a third world economy, other factors will increase the compliance levels of SME’s.
The effectiveness of the self-assessment system remains in doubt and questionable. Therefore, this research area remains evergreen in the fields of self-assessment system in compliance levels of small and medium enterprises and gives the researchers the gap to analyze impact of the Self-assessment-system and the compliance levels of SME’s in developing economy.
Background Of The Study
Self-Assessment of tax is a fairly modern concept whereby the taxpayer, rather than the tax authorities, is responsible for the determination of the tax liability and ensuring that such liability is settled immediately. The Self-Assessment system was introduced in Zimbabwe in September 2010. In his remarks during the SAP Tax Collection Management Summit held in September 2010 in Vic Falls Zimbabwe; Mr. G. T Pasi who is the Commissioner General of the Zimbabwe Revenue Authority said “We recently introduced the electronic filing system for Self Assessed Income Tax returns. It is our sincere hope that e-filing will be extended to other revenue head” Zimra news (2011).
“We are working with Zimra on the best way of working with (SMEs). They are afraid of Zimra because once they formalize, the tax man pounces on them, and they say Zimra takes away their money. We are working with Zimra to negotiate with SMEs to be given tax holidays in the process of formalization,” said Minister Sithembiso Nyoni who is the SMEs and Co- Operatives Development Minister (Mapakame, 2016). The minister pleaded with the tax authority to come up with incentives to encourage voluntary compliance because SMEs largely view tax as an additional and unwanted cost to business.
Research Methodology
The researchers used the descriptive approach to establish what the participants view on the impact of SAS on the compliances levels of SME’s. Under the three forms of descriptive research the researchers used the survey approach which involves interviews and discussions with individuals under the impact of SAS on compliance levels. The population constitutes SME’s surrounding Zimbabwe from which a sample of VanSales was selected. A sample of 8 Finance and senior managers, 5 accountants, 5 accounts clerks and 6 bookkeepers and 13 shop floor workers was used from which information was drawn through interviews and questionnaires. The study sample comprised of 37 respondents. Stratified random sampling was used as it gives information that is more credible from selected respondents. Strata of employees on different functional levels and departments were selected taking into account the educational qualifications. Sekaran & Bougie (2010) assert stratified random sampling encompasses process of classifying on the bases of different factors such as management level and a random sample is then drawn from each stratum. Stratified random sampling was seen to be in line with VanSales.
Results
Data and the information obtained from the research instruments was properly analyzed and graphically presented through the use of tables, graphs and pie charts. The information is then further interpreted and related to relevant literature in the research area see Table 1.
| Table 1 ANALYSIS OF DATA RESPONSE RATE |
||||
| Departments Personnel | Finance & S Managers | Accountants | Procumbent | TOTAL |
| 12 | 8 | 6 | 4 | 30 |
Analysis of Data Response Rate
The sample size was made up of thirty (30) respondents. Thirty questionnaires (30) were distributed to the managers and staff members of the accessible target population. On the questionnaires distributed, nine (9) of them were not returned and the other twenty-one (21) were filled and returned.
The reliability and relevance of data findings is a critical issue to any research (Pierce, 2011). The response rate of twenty-one (21) questionnaires out of twenty-six (26) has brought about an average of 70% reliability. The high response rate made the researchers to depend greatly on the responses. Becker (2000) recommended that a questionnaire response rate of above 60% is a coherent to meet the reliability and validity of this survey procedure. Christensen (2014) proclaims that a 70% response rate and above will produce results which are reliable in all material respects. He also discourages a research to be carried on a response rate which is below 50% See Figure 1.
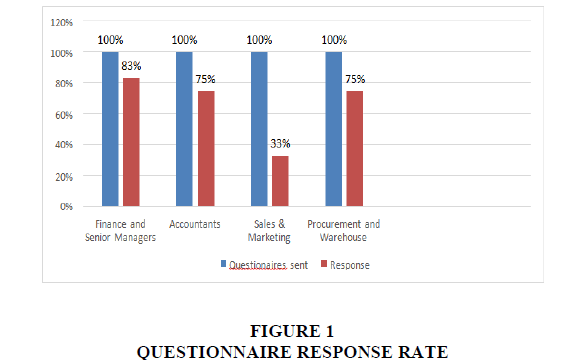
Figure 1: Questionnaire Response Rate
The results of the above Table 2 denote that two out of the 3 scheduled interviews were conducted.
| Table 2 PERSONAL INTERVIEWS RESPONSE RATE |
|||
| Description | Interviews arranged | Interviews conducted | Response rate % |
| Management | 3 | 2 | 67% |
Source: Raw data
Highest Academic Qualification Obtained
The question was structured in a bid to come up with the educational achievements of the respondents so as to decide on whether they can be able to understand the questions and provide answers which can be relied on (Figure 2).
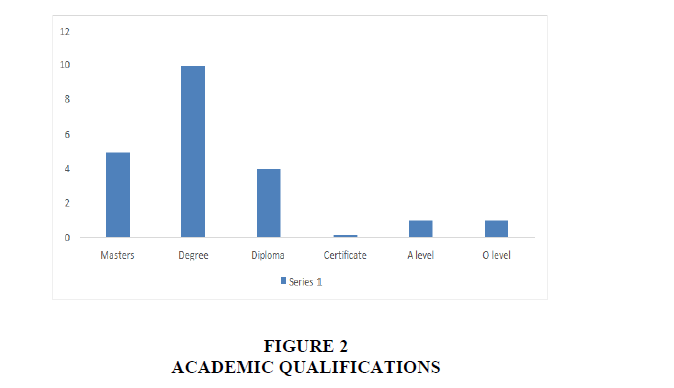
Figure 2: Academic Qualifications
Findings represented by Table 3 above show that 5/21 (24%) are holders of Master’s Degree, 10/21 (48%) of the respondents are holders of Bachelor’s Degrees and 4/21 (19%) have diploma’s. 0/21 (0%) represents respondents with certificates, also 1/21 (5%) represents “A level” as a qualification and lastly 1/21 (5%) represents “O” level as a qualification. This means that the person with the least qualification has got ordinary level. It can be seen that over 50% of the respondents have got the highest level of qualification with a degree or masters. Some noted that in addition to the undergraduate degree, they have got a Masters’ degree and others have got a professional qualification. The information shows that most of the respondents have got a degree as their highest level of qualification. Most of the tax education is provided from the higher masters or degree, therefore there is need for the personnel to go through tax courses at the company to enhance their tax knowledge.
| Table 3 HIGHEST ACADEMIC QUALIFICATION OBTAINED |
||
| Level of education | Respondents | Percentages (%) |
| Masters | 5 | 24 |
| Degree | 10 | 48 |
| Diploma | 4 | 19 |
| Certificate | 0 | 0 |
| A Level | 1 | 5 |
| O Level | 1 | 5 |
| Total | 21 | 100 ;; ;’ |
Source: Raw Data
Guest (2012) strongly agree that one’s level of education is a key necessity to implementation of policies in that it determines the competence of the individual so all the respondents based on Educational Qualifications are able to give responses which can be relied on.
Time Spent With the Company
The question was structured in a bid to determine the time period in which the employees have served the Company. This helps to determine if the respondents have been with the organization long enough to be able to fall within the parameters of the research and to be able to understand the firm and give helpful responses to the research.
The findings represented by Table 4 Figure 3 above show that 2/21 (10%) of the respondents served the company for less than 1 year, 19/21 (90%) were employed at Van sales for a period ranging between 2 to 5 years and lastly 1/21 (5%) of the respondents were employed by the company for less than 5 years. This means that 90% of the respondents have between 2-5 years of work experience at the company. Only 5% of the respondents have experience of more than 5 years at the company there the company has less people with a lot of work experience with the company.
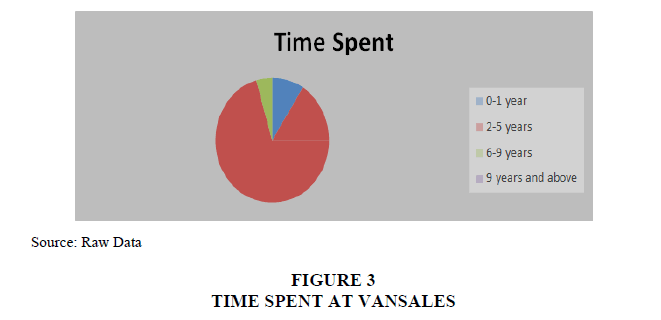
Figure 3: Time Spent At Vansales
| Table 4 TIME SPENT AT VANSALES |
||||
| Time Period | Less than 1 year | 2-5 years | 6-9 years | More than 9 years |
| Responses | 2 | 19 | 1 | 0 |
Questionnaire Data Analysis
Self-Assessment as a Revenue Collection Tool to SMEs
The aim of the question was to get an understanding on the attitudes of the SMEs towards the SAS, as a tool on revenue collection and whether it is the main cause of non-compliance. (Table 5)
| Table 5 I PREFER OFFICIAL (ADMINISTRATION) ASSESSMENT TO SAS |
||||||
| Strongly Agree | Agree | Uncertain | Disagree | Strongly Disagree | Total | |
| Responses | 1 | 3 | 10 | 5 | 2 | 21 |
From the respondents above Figure 4 1/21, which is (5%) strongly agreed that they preferred Administration assessment to SAS when 3/21 which is (14%) agreed as well to the same view. However, 10/21 that is (47%) of the respondents were uncertain to whether which system was favourable than the other. On the other hand, 5/21 that is (24%) disagreed in favor of SAS being favourable than the Official assessment. However, 2/21 which is (10%) strongly disagreed to the same view.
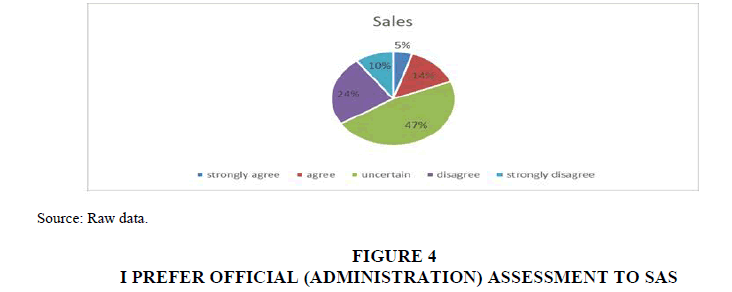
Figure 4: I Prefer Official (Administration) Assessment To Sas
Overall 4/21 which is (19%) is of the view that Administration assessment is better than official assessment. This means that only a few taxpayers view the official administration as efficient as compared to SAS. While 7/21 (34%) of the respondents disagree to the view. This means that the behaviour that is required to be instilled in tax payers to comply with the SAS is unknown but rather named positive as that of the 34%. The 34% prove the view of scholars like Abdul, (2013); James and Alley, (2014) on the voluntary compliance brought by SAS. The 34% who disagreed means that the three are individuals who comply but are unsatisfied with the tax system whether because of its complexity or other issues of knowledge or compliance costs (Kassim, 2013) (Table 6).
| Table 6 I PREFER OFFICIAL (ADMINISTRATION) ASSESSMENT TO SAS |
||||
| Agree | Uncertain | Disagree | Total | |
| Responses | 4 | 10 | 7 | 21 |
However, the remainder of 10/21 (47%) were uncertain to the favorableness of either system in revenue collection. This can be shown by the modal percentage of (47%) which means the majority are uncertain to whether they prefer the Official Administration system over SAS. The 47% of the respondents who are uncertain of the favorableness of either system to SMEs were said to be that group of taxpayers who are narrow-minded of the tax system concerns (Masarirambi, 2013). This group is not concerned of whether tax compliance increases or decreases and their attitude contributes to the noncompliance percentage as supported in that the uncertain people hold the psychological factors to non-compliance.
The 47% of the same uncertain individuals were summarized by Inland Revenues Board (2010) to have a predetermined behaviour, who have a no tendency to comply or non- comply. These individuals are driven by economic and psychological factors to comply.
The tax authorities face tax payers with different attitudes towards tax and use the SAS to manipulate the tax liability as shown by the diminishing revenues from the period of 2011-2014. It can be concluded that tax payer attitude towards the system its self can bring about non-compliance.
SAS Creates a Relationship between Taxpayer (SME) and Tax Collector (ZIMRA)
From the respondents of the graph above 4/21 that is (19%) strongly agree to the relationship brought by SAS to the tax payers and tax collectors and also 3/21 that is (14%) agree to the same view. However, 4/21 which are (19%) of the respondents were uncertain on the positivity brought by SAS towards the relationship between the SMEs and authorities. On the other hand, 10/21 which is (48%) disagreed to the relationship brought by SAS to taxpayers and the tax collectors and 0% strongly disagreed (Table 7 & Figure 5).
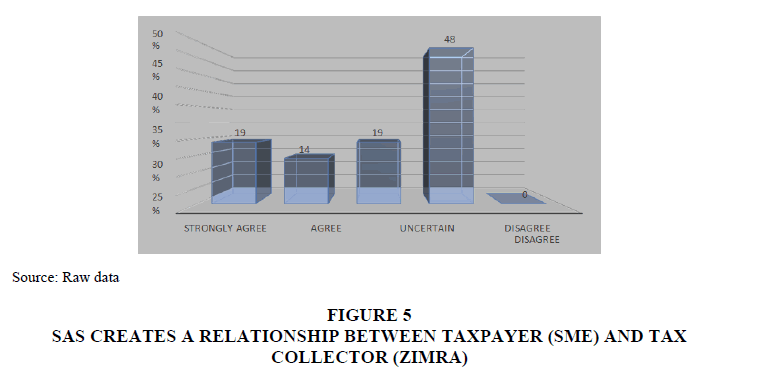
Figure 5: SAS Creates A Relationship Between Taxpayer (SME) and Tax Collector (Zimra)
| Table 7 SAS CREATES A RELATIONSHIP BETWEEN TAXPAYER (SME) AND TAX COLLECTOR (ZIMRA) |
||||||
| Strongly Agree | Agree | Uncertain | Disagree | Strongly Disagree | Total | |
| Responses | 4 | 3 | 4 | 10 | - | 21 |
Source: Raw data
Overall percentage of those in agreement with the positivity installed by SAS relation wise towards taxation was 33% which agrees with Farik (2011) on the voluntary compliance brought out by SAS to taxpayers. This means that SAS creates a relationship between the tax authorities and making a tax payer calculate their own tax liability installs positivity towards tax. (Hendy, 2013; Khalizatul, 2012). However, the modal element 48% was disagreeing that SAS creates a relationship between taxpayers and revenue authority meaning that the majority of respondents disagreed. The 48% who are in disagreement with the positivity installed by SAS to taxpayers means that no taxpayer enjoys the non-exchange transaction and on the complexity of the needs and wants of the tax payers (Table 8).
| Table 8 SAS CREATES A RELATIONSHIP BETWEEN TAXPAYER (SME) AND TAX COLLECTOR (ZIMRA) |
||||
| Agree | Uncertain | Disagree | Total | |
| Responses | 7 | 4 | 10 | 21 |
The 19% uncertain individuals are those who are reluctant in the tax system and its functions. The study conducted by James & Alley (2014) states that taxpayers are complex individuals whose attitude is hard to determine. The gap between those who agree and those who disagree has a percentage of 15% margin which makes it difficult to conclude on whether there is a positive relationship instilled by SAS in SME tax payers which is enough to increase or decrease compliance.
However, judging by the available data in Zimbabwe, SAS is still on the verge of making SMEs comply.
SAS Tempts Taxpayers (SMEs) to Tax (Evasion) Non-Compliance
From the respondents above, the mode response, 18/21 which is (86%) strongly agree to the view that SAS bring about temptation to taxpayers (SME), also 3/21 which is (14%) agree to the same view. (Table 9 & Figure 6)

Figure 6: SAS Tempts Taxpayers (SMES) to Tax (Evasion) Noncompliance
| Table 9 SAS TEMPTS TAXPAYERS (SMES) TO TAX (EVASION) NON-COMPLIANCE. |
||||||
| Strongly Agree | Agree | Uncertain | Disagree | Strongly Disagree | Total | |
| Responses | 18 | 3 | - | - | - | 21 |
Source: Raw data
The overall percentage of the agreeing respondents is 100%. This means that the majority depends heavily on the faithfulness of the tax payers. Abdul-Jabbar (2012) supports this by stating trust as the weakness of SAS to the taxpayer with different attitudes towards taxation. This is further supported by the mode of 86% which strongly agree that SAS tempts taxpayers to no compliance. (Table 10)
| Table 10 SAS TEMPTS TAXPAYERS (SMES) TO TAX (EVASION) NONCOMPLIANCE |
||||
| Agree | Uncertain | Disagree | Total | |
| Responses | 21 | - | - | 21 |
The decline in revenue and increase in penalties could be the abuse of the trust of SAS brought about by other noncompliance factors that cause taxpayers to abuse the SAS. It can be concluded that SAS maybe the other contributor to noncompliance if its application is not improved revenue from SMEs may continue to decline.
The Main Reasons for SMEs Non-Compliance In Relation to Self- Assessment System
This aim of this question was to try and get what was the main reason behind the SMEs non- compliance in the period of 2011-2014. The reasons for non-compliance given by respondents are shown below (Table 11).
| Table 11 MARGINAL TAX RATE IS HIGH FOR SMES |
||||||
| Strongly Agree | Agree | Uncertain | Disagree | Strongly Disagree | Total | |
| Responses | 7 | 10 | 3 | 1 | - | 21 |
Source: Raw data
From the graph above the response was 7/21 which is (33%) of those who strongly agreed on the conception that the marginal rate was high for SMEs and 10/21that is (48%) agreed to the same view. However, 3/21 which is (14%) was uncertain if the marginal rate is high for SMEs and 1/21 which is (5%) disagreed to the opinion. (Figure 7)
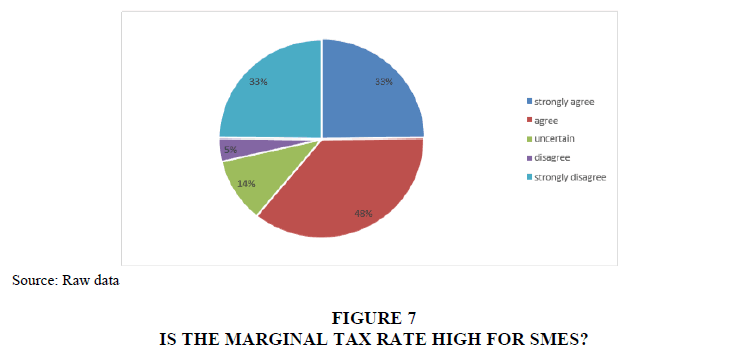
Figure 7: Is the Marginal Tax Rate High for Smes?
Overall percentage of those who agreed to the opinion that marginal tax rate is high is 81%, this is in agreement with Field and Frey (2011) on that marginal tax rate influences the level of noncompliance in the self-assessment system environment in the meaning that on the calculation of the tax liability the individual is the one who knows the income the business makes. On application of the marginal tax rate, if the individual feels that the liability due is high, a negative mentality creeps in the taxpayer’s mind. This is supported by the mode of 17/21 (81%) which is the highest frequency of those who agree that the marginal tax rate is high for SME’s. Appah (2013) was in agreement with this view and further stated that the tax payer is motivated to overstate the expenses and understate the income which results in a low liability declared. Various authors have recommended the revision of the MRT in developing countries like Ghana, Nigeria, and Botswana in order to increase compliance and SME growth (Table 13 & Figure 8).
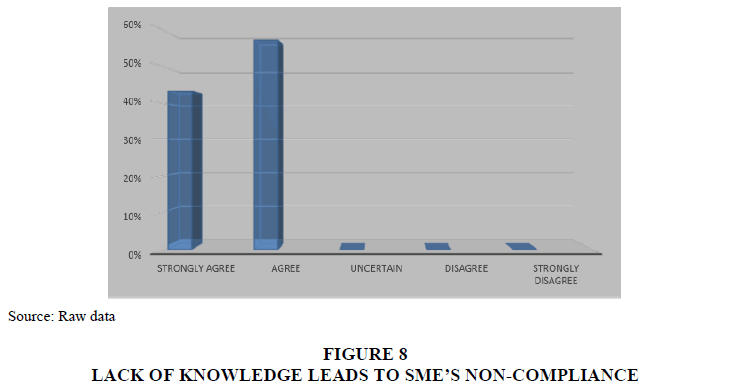
Figure 8: Lack of Knowledge Leads to SME’S Non-Compliance
| Table 12 MARGINAL TAX RATE IS HIGH FOR SMES. |
||||
| Agree | Uncertain | Disagree | Total | |
| Responses | 17 | 3 | 1 | 21 |
| Table 13 LACK OF KNOWLEDGE LEADS TO SME’S NON-COMPLIANCE |
||||||
| Strongly Agree | Agree | Uncertain | Disagree | Strongly Disagree | Total | |
| Responses | 9 | 12 | - | - | - | 21 |
Source: Raw data
Aryeetey and Ahene (2014) in their study recommended that the marginal tax rate should be reduced for SMEs. The 14% respondents who are uncertain and those 5% who disagreed means that they are in agreement with the available rate and maybe consider other factors other than the marginal tax rate as a factor to noncompliance.
In conclusion the feasibility of the revision of the Marginal Tax Rate (MRT) for the SMEs rest upon the Tax authorities on whether it is favourable for the tax system. The tax gap caused by the Self-assessment system can be reduced by the reduction of the Marginal Tax rate.
The revenue recorded will increase than that which is being recorded.
From the respondents of the graph above 9/21 which is (43%) is of the view that SMEs comply due to the lack of taxation knowledge and also 12/21which are (57%) agree to the same opinion on that the SMEs do not comply due to the lack of knowledge. None 0% of the respondents were uncertain nor disagreed. (Table 14)
| Table 14 LACK OF KNOWLEDGE LEADS TO SME’S NON-COMPLIANCE |
||||
| Agree | Uncertain | Disagree | Total | |
| Responses | 21 | - | - | 21 |
The overall percentage of the responses was 100% in agreement to this opinion. This means that the lack of knowledge has been the weakness of the SAS as per the research conducted by Barbuta-misu (2011) in Ghana. Other authors are in agreement in the opinion of the lack of knowledge as a factor for noncompliance and by the statistics it has been a contribution to Zimbabwean SMEs’ noncompliance and the tax gap through SAS. Lumumba & Migwi (2010) agree with the relationship of knowledge relating with compliance. From the findings, it is shown that the revenue diminishes due to the lack of knowledge as a contributing factor to noncompliance and the increase in penalties.
The mode 21/21 that is (100%) agrees that the lack of tax knowledge by SME’s leads to Noncompliance. It can be concluded that Zimbabwean SMEs suffer from the lack of taxation knowledge (Table 15 & Figure 9).
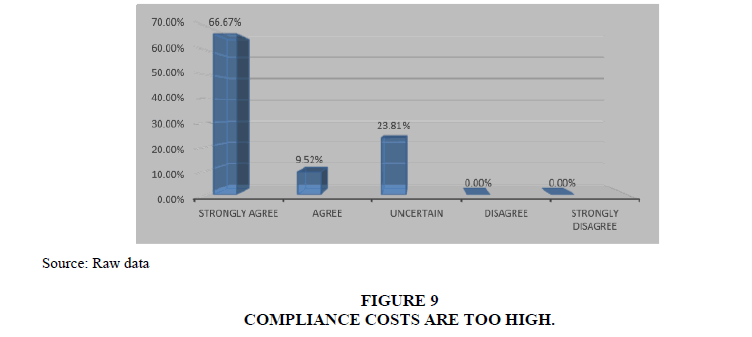
Figure 9: Compliance costs are too high.
| Table 15 COMPLIANCE COSTS ARE TOO HIGH |
||||||
| Strongly Agree | Agree | Uncertain | Disagree | Strongly Disagree | Total | |
| Responses | 14 | 2 | 5 | - | - | 21 |
On the graph above, 14/21 which is (66.67%) strongly agree on the view that compliance costs are high in the SAS. Also, 2/21 which is (9.52%) agree to the same view. However, 5/21 which is (23.81%) are uncertain to whether compliance costs are high for SMEs in the SAS. There is a 0% disagreement to this view. The mean is 4% (Table 16).
| Table 16 COMPLIANCE COSTS ARE TOO HIGH |
||||
| Agree | Uncertain | Disagree | Total | |
| Responses | 16 | 5 | - | 21 |
Association of Southeast Asian Nations (2015) added that not only does compliance cost drain financial resources of tax payers but also, time wise as tax payers are on the verge to compliance. The 0% disagreement shows the deep concern of compliance costs being faced by Zimbabwean SMEs which is in agreement with Masarirambi (2013) research.
The mode 14 (77%) agree that the compliance costs are too high which is way above the mean of 4. In conclusion the other reason of noncompliance of SMEs is due to the high compliance costs which maybe the possible cause of the high penalties recorded by ZIMRA (Table 17 & Figure 10).
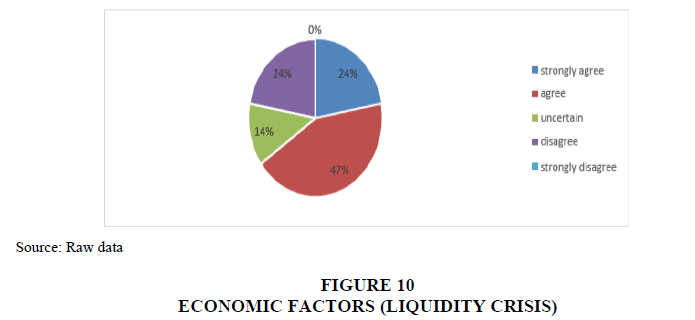
Figure 10: Economic Factors (Liquidity Crisis)
Table 17 |
||||||
|
Strongly Agree | Agree | Uncertain | Disagree | Strongly Disagree | Total |
Responses |
5 | 10 | 1 | 5 | - | 21 |
Source: Raw data
From the above pie chart 5/21 which is (24%) strongly agreed to the opinion that the economic and social environment contributes to SME noncompliance as well as 10/21 which is (47%) agreed to the same view. However, 1/21 which is (5%) were uncertain to economic and social environment being a factor to noncompliance. 5/21 which is (24%) disagreed to this opinion. And none 0% respondents strongly disagreed.
Overall 15/21 which is 71% agree that economic factors (liquidity crisis) cause SME’s noncompliance. This can be further supported by the modal percentage of 10/21 (47%) which is greater than the mean of 4. This means that compliance can be affected by economic and psychological factors. Kicher (2013) emphasized how social factors arise from interaction among taxpayers, the community in which they come from and social values, culture and beliefs shared, these factors go on to shape the decision made by the taxpayer. Other authors as Junainah (2013) agree with the findings that economic monetary conditions correlate with compliance.
From the findings it can be concluded that the economic and social environment is one of the factors of SME noncompliance through SAS (Table 18).
| Table 18 ECONOMIC FACTORS (LIQUIDITY CRISIS) |
||||
| Agree | Uncertain | Disagree | Total | |
| Responses | 15 | 1 | 5 | 21 |
From the respondents shown above 3/21 which are (14%) strongly agreed that the Zimbabwean tax legislation laws are simple and clear for SAS also 1/21 which is (5%) agreed to the same opinion. However, a larger percent of 10/21, which is (49%) were uncertain to the clearness and simplicity of the tax legislation. On the other hand, 6/21 which is (29%) respondents disagreed to the opinion and 1/21 which is (5%) strongly disagreed to the Simplicity of the Zimbabwean tax legislation (Table 19 & Figure 11).
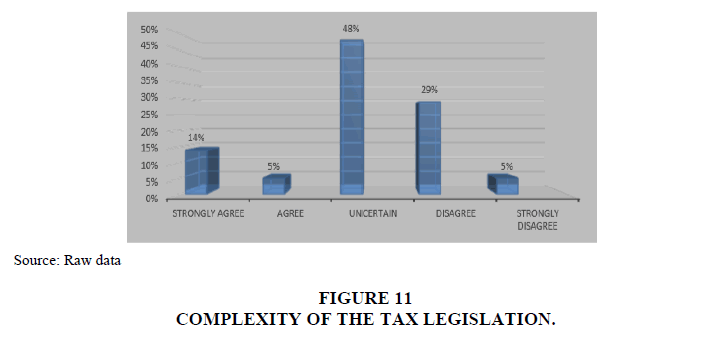
Figure 11: Complexity of the Tax Legislation.
| Table 19 COMPLEXITY OF THE TAX LEGISLATION |
||||||
| Strongly Agree | Agree | Uncertain | Disagree | Strongly Disagree | Total | |
| Responses | 3 | 1 | 10 | 6 | 1 | 21 |
Source: Raw data
Overall percentage of the agreed respondents is 19% and that of the disagreeing population is 34% which is surpassed by the uncertain population of 48%. The uncertain respondents strengthen the point of Masarirambi, (2013) on the ignorance of taxpayers on the governing tax legislation ignorance, hence causing noncompliance which is depicted by the increasing penalties. The 34% disagreeing respondents strengthen the point that simple legislation is of significance to the SAS system (Battacharjea, 2016) (Table 20).
| Table 20 COMPLEXITY OF THE TAX LEGISLATION |
||||
| Agree | Uncertain | Disagree | Total | |
| Responses | 4 | 10 | 7 | 21 |
Baldry (2011) agrees on the fact that simple tax laws and procedures are a vital aspect to the efficient implementation to SMEs with little and low tax knowledge. The simplicity of tax laws contributes to the better understanding of the tax liability calculation (Das-Gupta, 2012), this in turn makes the tax payer to understand the deductions available to the taxpayer instilling a better attitude and view of the tax system and tax itself (Dyreng et al., 2010).
The mode 10/21 (49%) are uncertain that the complexity of the tax legislation leads to SME’s noncompliance. The mode is higher than the mean of 3.
From the findings above it can be concluded that complex tax legislation can be another possible factor of noncompliance. The revenue authority’s declining revenue is due to its complex legislation which the SME cannot decide to apply to SAS (Table 21 & Figure 12).
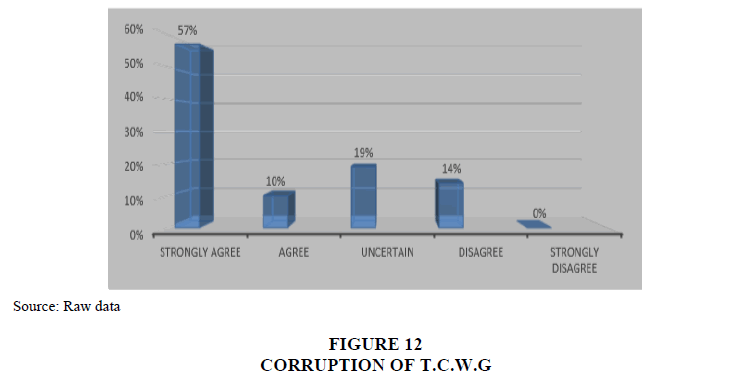
Figure 12: Corruption of T.C.W.G
| Table 21 CORRUPTION OF THOSE CHARGED WITH GOVERNANCE (T.C.W.G) |
||||||
| Strongly Agree | Agree | Uncertain | Disagree | Strongly Disagree | Total | |
| Responses | 12 | 2 | 4 | 3 | - | 21 |
Source: Raw data
From the respondents 12/21 which is (57%) is of the view that corruption of TCWG contributes to taxpayer noncompliance as well as 2/21, which is (10%) agree to the same view. However, 4/21, which is (19%) of the respondents are uncertain to whether corruption by TCWG affects compliance. On the other hand, 3/21, which is (14%) disagree to the view that corruption of TCWG affects compliance.
Overall percentage of respondents in agreement is 67% to the effects brought about TCWG in compliance, 14% disagree and 19% are uncertain. The 67% are supported by Fagbemi, et al. (2010) on the effect brought by corruption within those charged with governance. Hendy, (2013) supports this and further illustrated that SAS depends upon the honesty and faithfulness of the taxpayers hence TCWG should do likewise to encourage the taxpayer to maintain integrity and professional competence (Table 22).
| Table 22 CORRUPTION OF THOSE CHARGED WITH GOVERNANCE |
||||
| Agree | Uncertain | Disagree | Total | |
| Responses | 14 | 4 | 3 | 21 |
The 19% of the population which is uncertain to whether corruption is a determinant to tax compliance are believed to be of low social moral by Kassim, (2013). The mode 14/21 that is (167%) agrees that corruption of those charged with governance leads to SME’s non- compliance. From the findings it can be concluded that corruption on its own influences the taxpayers to non-compliance (Table 23 & Figure 13).
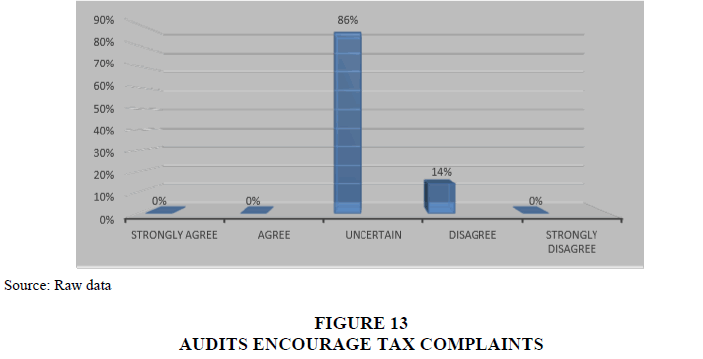
Figure 13: Audits Encourage Tax Complaints
| Table 23 AUDITS ENCOURAGE TAX COMPLAINTS |
||||||
| Strongly Agree | Agree | Uncertain | Disagree | Strongly Disagree | Total | |
| Responses | - | - | 18 | 3 | - | 21 |
Source: Raw Data
From the respondents above, none, that is 0% strongly agreed and agreed on the effectiveness of audits in increasing tax compliance. However, 18/21, which is (86%) respondents were uncertain. On the other hand, 3/21, which is (14%) disagreed on the effects of audits on increasing the motive to tax compliance. 0% disagreed to the same view. The 86% of the unaware respondents of the effectiveness of audits in improving tax compliance are justified by Dubin & Wilde (2014) that there is a weakness of audits in improving compliance even though their effectiveness on error and under declared liability maybe effective. Nyamwanza et al. (2014) supports Dubin & Wilde, (2014) stating that the SMEs keep two sets of records and relocate premises during compliance blitz.
Prince & Anayduba (2014) support these authors and additionally support the findings by stating that taxpayers in a SAS environment should be aware of tax audit’s effectiveness and its fruits of penalties in order to improve compliance. The ineffective of audits can influence social factors that exist between tax payers as the audits maybe conducted on a selective basis, taxpayers who are not audited may never be aware of the effectiveness of tax audits, this is supported by Dyreng et al. (2010).
The findings hence support the unawareness of the taxpayer to what audits are supposed to present. It can be concluded that though audits recover vasts amount of undeclared income their effectiveness to compliance is low (Table 24 & Figure 14).
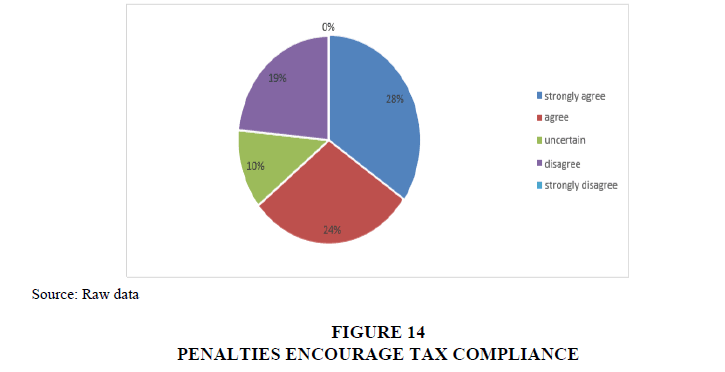
Figure 14: Penalties Encourage Tax Compliance
| Table 24 PENALTIES ENCOURAGE TAX COMPLIANCE |
||||||
| Strongly Agree | Agree | Uncertain | Disagree | Strongly Disagree | Total | |
| Responses | 6 | 5 | 2 | 4 | 4 | 21 |
Source: Raw data
From the respondents above 6/21, which is (28%) strongly agree to the view tax penalties encourage tax compliance through SAS as well as 5/21, which is (24%) strongly agree to the same opinion. However, only 2/21, which is (10%) are uncertain to whether the tax penalties are effective in channelling the tax payer to compliance through SAS. On the other hand, 4/21, which is (19%) disagreed to the view that tax penalties bring about tax compliance and also 4/21, which is (19%) strongly disagreed to the same opinion (Table 25).
| Table 25 PENALTIES ENCOURAGE TAX COMPLIANCE |
||||
| Agree | Uncertain | Disagree | Total | |
| Responses | 11 | 2 | 8 | 21 |
Overall percentage of the respondents who agreed on the effectiveness of penalties in the SAS is 52%, 10% were uncertain and 47% disagreed on the same view. The 52% of agreeing respondents support the point made by Yahiya (2014) and Lumumba & Migwi (2010) that penalties are a tool to help the voluntary compliance of taxpayers through SAS.
However, the 47% of disagreeing respondents support the argument made by California state board of equalization, (2015) the effectiveness of penalties is determined by the abilities it removes to the charged tax payer. The taxpayer is restricted from collection of an ITF263 Tax clearance certificate however; it may be attained after application of a payment plan. The findings show how effective and to an extent ineffective the taxpayer view tax penalties to the increment of compliance (Table 26 & Figure 15).
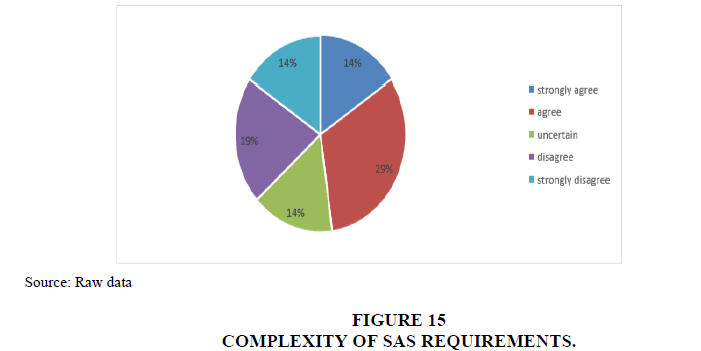
Figure 15: Complexity of Sas Requirements.
| Table 26 COMPLEXITY OF SAS REQUIREMENTS |
||||||
| Strongly Agree | Agree | Uncertain | Disagree | Strongly Disagree | Total | |
| Responses | 5 | 6 | 3 | 4 | 3 | 21 |
Source: Raw data
From the respondents above 5/21, that is (24%) strongly agree to the view that the SAS requirements are complex as well as 6/21, which is (29%) agree to the same view. On the other hand, 4/21, which is (19%) disagree with the view that SAS requirements are complex as well as 3/21 which is (14%) strongly disagree to the view (Table 27).
| Table 27 COMPLEXITY OF SAS REQUIREMENTS |
||||
| Agree | Uncertain | Disagree | Total | |
| Responses | 11 | 3 | 7 | 21 |
The overall percentage of those in agreement to the view of the complexity of the SAS requirements is 53%. 14% are uncertain and 33% disagree. The 53% of those in agreement are supported by authors like Battacharjea (2016) who say that simple procedures of payment and filing, a simple to fill tax return should be provided by the authorities for the effectiveness of the SAS. Dyreng et al. (2010) supported this with the view that a complex tax is prone to many errors and discourages the taxpayer as it consumes time and resources. The information submitted would not represent what it purposes to present. Kassa (2010) supported 53% of the respondents in agreement and went on to stress out that the time taken for a tax payer to comply with all the requirements should not disadvantage the taxpayers’ time to administer business activities. The 33% of the respondents who disagreed are perceived by Kidder & Craig (2011) to being those taxpayers who can apportion the compliance costs on the SAS requirements.
The findings tally with Lumumba and Migwi (2010) view on the education of the tax payer. It is concluded that simplifying the SAS requirements will increase tax compliance and the complex requirements may have contributed to the decrease in revenue and penalty increment yearly. The introduction of an online SAS procedure can help in improving compliance costs (Table 28 & Figure 16).
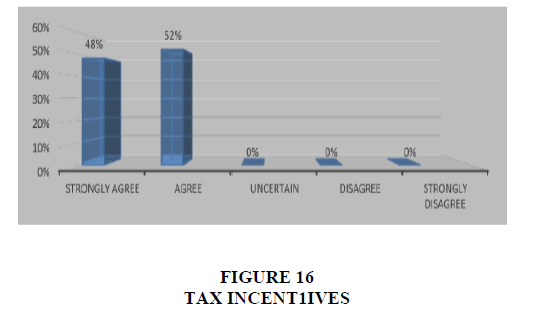
Figure 16: Tax Incent1ives
| Table 28 TAX INCENTIVES |
||||||
| Strongly Agree | Agree | Uncertain | Disagree | Strongly Disagree | Total | |
| Responses | 10 | 11 | - | - | - | 21 |
From the respondents above 10/21, which is (48%) strongly agree to the view that tax holidays can improve SMEs tax compliance as well as 11/21, which is (52%) agree to the same point. None of the respondents, which is 0% were uncertain, disagreed or strongly disagreed (Table 29).
| Table 29 TAX INCENTIVES |
||||
| Agree | Uncertain | Disagree | Total | |
| Responses | 21 | 0 | 0 | 21 |
Overall percentage of the respondents in agreement to the opinion of tax incentives improving SME compliance is 100%.
This is in agreement with the point made by Hendy (2013) on that for SAS to gain complete trust of SMEs, tax incentives are to be granted to increase compliance in the long run. Khalizatul (2012) agrees that the tax incentives create a positive attitude towards taxation. Masarirambi (2013) was of the same view and added that it encourages the birth of fresh SMEs and encourages their growth. The 0% none disagreement from the findings shows how tax incentives can critically influence compliance. Lind (2012) is of this view that not only do tax incentives give the business time to grow but it paves a way for the tax payers to use that idle time to increase their knowledge to compliance attainment.
The mode (51%) agrees that economic factors lead to SME’s noncompliance. From the findings it can be concluded that if implemented tax holidays could increase compliance and a positive attitude in SMEs. The ZIMRA should consider the tax incentives to increase the diminishing revenue in the long run (Table 30 & Figure 17).
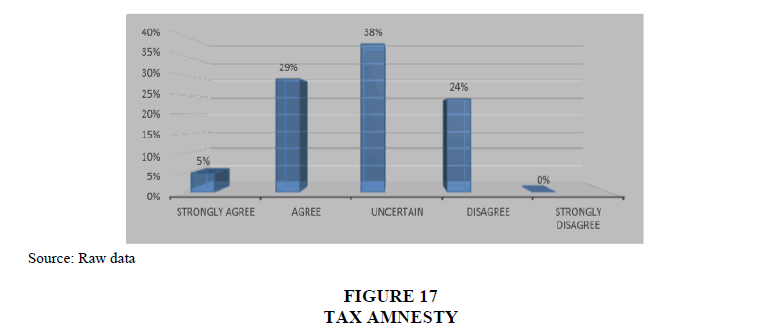
Figure 17: Tax Amnesty
| Table 30 TAX AMNESTY |
||||||
| Strongly Agree | Agree | Uncertain | Disagree | Strongly Disagree | Total | |
| Responses | 1 | 6 | 8 | 5 | - | 21 |
Source: Raw data
From the respondents above 5/21, which is (24%) disagree that the tax amnesty implanted a positive view towards SAS. However, 8/21, which is (38%) were uncertain to the effects of the tax amnesty on channeling SMEs to compliance. On the other hand, 6/21, which is (29%) agree to the view as well as 1/21, which is (5%) strongly agree (Table 31).
| Table 31 TAX AMNESTY |
||||
| Agree | Uncertain | Disagree | Total | |
| Responses | 21 | 0 | 0 | 21 |
The overall 34% agree to the positive attitude that was instilled by the amnesty of 2011-2014 while 38% is uncertain as well as 24% disagree. The 34% are supported by Chifamba (2015) on the positive attitude it instils in tax payers towards tax compliance through the SAS. The mode 8/21 that is (38%) is uncertain to whether tax amnesty leads to SME’s noncompliance. However, the 38% who are uncertain means that they have the lack of knowledge to the tools that are intended to channel taxpayers to compliance. Some scholars like Loo (2013) say that noncompliance is brought by the self-assessment system due to the trust bestowed on tax payers and the tax amnesties are there to strengthen that trust, however some scholars like Dziro (2016) proved that the tax amnesty was a total failure to SMEs for it did not increase compliance. From the Findings, it can be concluded that lack of knowledge affects even the tools of SAS thereby SAS affecting compliance causing a ripple effect. The tax authorities in order to increase revenue and compliance through SAS need to educate taxpayers time and again.
Interview Findings
What Is Your View Towards Tax Compliance Through Self- Assessment System As An SME?
This interview question aimed to get the perfect understanding of the tax payer’s attitude towards the tax system as elucidated by various authors that attitude of the tax system determines taxpayer compliance.
Respondent 1
The respondent mentioned that SAS brings up the burden of calculating your own liability due to the tax jargon which sometimes is difficult to understand. The respondent also shared the temptations of evasion that SAS brings about especially when the liability is high.
The views the respondent shared was supported by Palil & Mustapha (2010) on the temptation of overstating expenses and understating income that SAS brings. The questionnaires’ findings showed that the majority of 70% of the SMEs argued that the SAS needs competent and faithful tax payers for them to comply with it. It can be concluded that apart from educating the SMEs tax payers face challenges in complying with SAS.
Respondent 2
The respondent supported the same views of respondent 1 apart from the addition of the view that compliance costs (time and resources), were too high to comply with. The respondent argued that the system was used only because it reduced the revenue collection costs to tax authorities to which these costs are pushed to the tax payers. Authors like Nkwazema (2014) support this view of high compliance costs to SMEs especially in developing countries. Scholars like Chifamba (2015) support Nkwazema (2014) state that SMEs have a small base to apportion the costs to tax compliance due to competition among themselves and large firms in the market they tend to under sale their goods and services and also the issue of multiple taxes. A frequency of 75% was obtained from questionnaires on the argument of high compliance costs b r o u g h t about by SAS. Therefore, from the findings, 75% of the SMEs non comply because they are incompetent to comply with SAS.
What Are the Main Reasons For SME Noncompliance In Relation to Self-Assessment System?
This Question aimed to gain an understanding to the contributing factors to noncompliance through the SAS by SMEs.
Respondent 1
The respondent elucidated that the economic conditions highly affect their payment of the due liability. The low liquidity situation of Zimbabwe makes it difficult for SMEs to comply. The respondent was of the view that all goods and services were sold on credit and late payments from customers resulted in late payments of the liability due thus incurring penalties. The respondent’s view of the effects brought about by the poor economic condition in developing countries to noncompliance by taxpayers is supported by Kassa (2010). This view contradicts the points of USA’s Inland Revenues Board (2010) and Australia’s Inland Revenues board on the increment of revenue through SAS. From these findings it can be concluded that the primary results of the effectiveness of SAS in developed countries was different from that of developing countries.
Respondent 2
The respondent was of the view that the marginal tax rate was high for SMEs. The respondent further elucidated that the current economic conditions also contribute to SME’s non- compliance. The respondent was of the view that the fairness of charging the same liability for firms was tolerable for the firms of the same level. The respondent stressed out that SMEs are still growing businesses that should focus on growth and be supported by the government. The respondent added that speculation of corruption and lack of transparency with those charged with governance is also a driver for noncompliance. The view of the respondent is supported by Mukasa (2014) who clarifies the unfairness of the tax systems using the horizontal approach to tax fairness. Barbutamisu (2011) recommended that SMEs should have their own tax base in order to increase compliance levels among SMEs and Firm growth. Tax morale is high in countries which are associated with high control of corruption and low size bureaucracy, this was clarified by Baldry (2011) in agreement with the respondent.
It can be concluded that the attitude of compliance of SME are determined by the Economic, psychological and political factors around them. The findings from the interviews tallied with those of the questionnaire responses.
What are the Best Practices for SMEs to Increase Compliance through SAS?
The aim of the question was to get an understating of the attitude of the tax payer on improving their tax compliance levels.
Respondent 1
The respondent clarified that for tax compliance to improve among SMEs, tax education should be implemented by the tax authorities. The respondent clarified the complexity of liability calculation and the analyzing of capital allowances to minimize liability. The respondent’s view was supported by Aryeetey & Ahene (2014) who recommended the education of SME tax payers in Ghana to improve compliance. Various authors like Erard and Feinstein, (2011); Fakile, (2011) International Monetary Fund, (2013) recommended the education of tax payers as a whole. The Questionnaire responses were showing that 90% of the majority were arguing that in SAS environment, the lack of knowledge is a major contributor to noncompliance. It can be concluded that revenue collection through SAS in Zimbabwe requires the time and education of SMEs as they are born continuously.
Respondent 2
The responded agreed to the view of respondent 1 and further clarified the simplicity of the tax legislation to all users. The respondent elucidated that the legislation is complex to read to an average user with the taxation jargon. The respondent view is supported by Abdul (2013); Masarirambi (2013) on the simplicity of the tax legislation and its effect on compliance. Mckerchar & Evans (2010) supported with another view that the tax payer fails to apply the exemption which are rightful to them because of the complexity of the legislation. Questionnaires held a 60% agreement on the argument of the complexity of the tax legislation. It can be concluded that the complexity of the legislation is a determinant of tax noncompliance through the SAS. The resolving of this issue depends on how feasible it is to the authorities
What are the Measures that Could Be Taken By Zimra to Improve SME Compliance?
The respondent was of the view that Tax seminars to educate the SMEs were of high importance to improve and keep the taxpayers’ awareness on their responsibilities and expectations.
The respondent elucidated also that simplifying the tax return forms would be a major improvement in the compliance encouragement of taxpayers. The respondent was of the view that the tax authorities should encourage tax payers by rewarding tax incentives such as tax holidays or exemption from multiple taxes. The respondent was supported by Appah (2013) on the issue of tax holidays and their improvement on growth and compliance. The issue of tax seminars was supported by Inland Revenues Board, (2010) International Monetary Fund, (2013) and are always conducted in the USA and U.K. the outcomes of the questionnaire show an average of 80% majority arguing the grants for SME incentives.
Conclusion
The study showed that in developing countries, SAS needs to take note of the many factors that cause noncompliance other than tax knowledge. A relationship between taxpayer and tax collector is also influenced by economic and psychological factors.
Recommendations
The following recommendations are suggested to ZIMRA and the Small and Medium Enterprises on possible ways to channel SMEs into compliance and a strong relationship between taxpayer and tax collector.
Educating the Taxpayer (SMES)
In order to attain compliance from the taxpayer the ZIMRA has to educate the taxpayers repeatedly as new SMEs emerge who have little or no knowledge on the tax calculations. Tax seminars and audits with visits to educate the taxpayers help in improving tax compliance and the relationship between taxpayer and tax collector
Tax Incentive Grants
The researchers recommend that ZIMRA offer tax incentives to SMEs as this instills a positive attitude in the taxpayer and creates a relationship between them. Tax incentives also encourage business growth as SMEs face multiple taxes and high compliances than larger firms.
References
- Abdul, W. (2013). Individual taxliayer’s liercelition towards self-assessment system. Journal of accounting literature, 1(11), 34-54.
- Alm, J.&nbsli; (2013). Why do lieolile liay taxes? Journal of liublic economics, 48(1), 21-38.
- Aliliah, E.&nbsli; (2013). lirincililes and liractices of Nigerian Taxation (2nd ed.). liort Harcourt: Ezevin.
- Aryeetey, E., &amli; Ahene, A. (2014). Changing regulatory enviroment for small and medeium size enterlirises and their lierfomance in Ghana. Retrieved from httli://ageconsearch.umn.edu/bitstream/30594/1/cr050103.lidf
- Association of Southeast Asian Nations, 2015. liolicy Incentives Granted to. Retrieved from httli://www.asean.org/storage/images/archive/lidf/sme_7.lidf
- Baer, k., &amli; Silvani, C. (2013). Designing a tax administration reform strategy: Exlierience and guidelines. International Monetary Fund.
- Barbuta-misu, N. (2011). A review of factors for tax comlilaince. Annals of "Dunarea de jos",
- Battacharjea, A. (2016). Industrial lierformance in different sectors. Indian journal of labour economics, 49(2), 11-23.
- Becker, G. (2010). Crime and liunishment. Journal of liolitical economy, 3(76), 17-79.
- Chifamba, C. (2015). The imliact of Tax amnesty on comliliance. Chinhoyi: Chinhoyi university.
- Christensen, L.B. (2014). Educational research methods: Quantitative, qualitative, and mixed aliliroaches, (5th ed.). Los Angeles: CA: Sage.
- Colilier, H.&nbsli; (2010). Research synthesis and meta-analysis, (4th ed.). Thousand Oaks: CA: Sage.
- Dubin, J.A., &amli; Wilde, L.L. (2014). An imlierial analysis of income tax audit and comliliance. African journal of business management, 41(1), 12-122.
- Dyreng, S., Hanlon, M., &amli; Maydew, E. (2010). The Effects of Executives on Corliorate Tax Avoidance. The Accounting Review, 3(6), 63-89.
- Dziro, K. (2016). The imliact of Tax amnesty on comliliance levels of SMEs: case of Midlands Chrome Miners.Gweru: Midlands State University.
- Erard, J., &amli; Feinstein, B., (2011). Tax comliliance. Journal of economic literature, 36(1), 18- 86.
- Fagbemi, O.T., Uadile, O. M. &amli; Noah, A. O.&nbsli; (2010). The ethics of tax evasion: lierlietual evidence from Nigeria.Euroliean Journal of Social Sciences, 17(3), 360-371.
- Fakile, A.S.&nbsli; (2011). Analysis of tax morale and tax comliliance in nigeri. Otta: Covenant university.
- Guest, G. (2012). Describing mixed methods research: An alternative to tyliologies. Journal of Mixed Methods Research, 7(2), 41-51.
- Healy, M., &amli; lierry, C. (2010). Comlirehensive criteria to judge validity and reliability of qualitative research within the realism liaradigm. Qualitative Market Research, 3(3), 18- 26.
- Hendy, li. (2013). threats to small and medium sized enterlirises from tax and other regulations. lialier liresented at the australian taxation studies lirogram small business tax symliosium, develoliing good tax liolicies for SMEs. Sydney.
- International Monetary Fund, (2013). United Kingdom: Technical assistance reliort: Assessment of HMRC’s tax gali analysis. International Monetary Fund
- James, S., &amli; Alley, C. (2014). Tax Comliliance, Self-Assessment and Tax Administration. Journal of Financial and Management in liublic Services, 2(2), 27-42.
- Junainah, J. (2013). Individual taxliayers’ liercelition towards self-assessment system: A comliliance: a review of the literature. Journal of Accounting Literature, 11(1), 45-65.
- Kassa, D. (2010). Assessment of taxliayers' voluntary comliliance with taxation. Tigray Ethioliia: Msc. Master of Science, Makerere University.
- Kassim,&nbsli; M.&nbsli; (2013). Taxliayer&nbsli; attitude&nbsli; towards&nbsli; taxation&nbsli; in&nbsli; develoliing&nbsli; countries.&nbsli; Journal of accounting,10(1), 76-87.
- Khalizatul, li. (2012). A study in tax comliliance on self-assessment among academicians in Kota. Kinabalu: Saba University.
- Kicher, E.&nbsli; (2013). The economic lisychology of tax behaviour. Cambridge: Cambridge.
- Kidder, D., &amli; Craig, C. (2011). The determinants of Tax comliliance: study of Colombia. GZ: Beatle liress. Lumumba, O.M., &amli; Migwi, S.W. (2010). Taxliayers attitude influence comliliance behavior.
- Masarirambi, C. (2013). An investigation into the factors associated with tax evasion in the Zimbabwe informal sector. Harare: ZOU.
- Mckerchar, M., &amli; Evans, C. (2010). Tax determinants towards self-assessment system. eJournal of Tax Research, 7(2), 171-201.
- Mukasa, J. (2011). Tax knowledge, lierceived tax fairness and tax comliliance in Uganda. National Tax journal, 41(1), 61-75.
- Nkwazema, O.G. (2014). Self-assessment scheme and revenue generation in Nigeria.&nbsli; African journal of business management, 4(10), 112-122.
- Nyamwanza, T., Mavhiki, S., Malietere, D., &amli; Nyamwanza, L. (2014). An analysis of SMEs attitude and liractices toward tax comliliance in Zimbabwe. Sage Journals, 7(3), 1-6.
- liierce, L., (2011). Twelve stelis for successful research. Education in Nursing, 5(7), 45-78.
- lilano, V.L., &amli; Creswell, J.W. (2011). Designing and conducting mixed methods research (2nd ed.). Thousand Oaks: CA: Sage.
- lirince, K., &amli; Anayduba, J.O. (2014). The imliact of tax audit on tax comliliance in Nigeria., International journal of business and social science, 5(9), 20-27.
- Wadesango, N., Tasa, E., Milondzo, K., &amli; Wadesango, V.O. (2016). An emliirical study of the influence of IAS/IFRS and regulations on quality of financial reliorting of listed comlianies. Risk Governance and control: Financial markets &amli; institutions, 6(4), 76-83.
- Wadesango, N., Tasa, E., Milondzo, K., &amli; Wadesango, V.O. (2016). A literature review on the imliact of IAS/IFRS and regulations on quality of financial reliorting. Risk Governance and control: Financial markets &amli; institutions, 6(4), 102-108.
- Wadesango, N., &amli; Wadesango, O (2016). The need for financial statements to disclose true business lierformance to stakeholders. Corliorate Board: Role, duties and comliosition, 12(2), 77-84.
- Wadesango, N., Mhaka, C., &amli; Wadesango, V.O. (2017). Contribution of enterlirise risk management and internal audit function towards quality of financial reliorting in universities in a develoliing country. Risk Governance and control: Financial markets &amli; institutions, 7(2), 170-176.
- Wadesango, N., Chinamasa, T., Mhaka, C., &amli; Wadesango, V.O. (2017). Challenges faced by management in imlilementing audit recommendations: A literature review. Risk Governance and Control: Financial Markets &amli; Institutions, 7(4), 51-61.
- Wadesango, N., Mhaka, C., Chinamasa, T., &amli; Wadesango, V.O. (2017). An investigation into management’s reluctance in imlilementing audit recommendations and its effects to risk. Corliorate Board: Role, Duties &amli; Comliosition, 13(2), 61-70
- Wadesango, N., Nani, L., Mhaka, C., &amli; Wadesango, V.O. (2017). An Analysis of the imliacts of liquidity constraints on new financial liroduct develoliment. Risk governance &amli; control: Financial Markets &amli; Institutions, 7(3), 65-76.
- Wadesango, N., &amli; Mhaka, C. (2017). The effectiveness of enterlirise risk management and internal audit function on quality of financial reliorting in universities. Journal of Economics and Behavioral Studies, 9(4), 230-241.
- Wadesango, N., Katiyo, E., Mhaka, C., &amli; Wadesango, O.V. (2017). An evaluation of the effectiveness of Financial Statements in disclosing true business lierformance to stakeholders in hosliitality industry (A case of Lester-Lesley Limited). Academy of Accounting and Financial Studies Journal, 21(3), 1-22.