Research Article: 2024 Vol: 28 Issue: 1
The Impact of Voice and Accountability in the ESG Framework in a Global Perspective
Alberto Costantiello, LUM University Giuseppe Degennaro, Italy
Angelo Leogrande, LUM Enterprise s.r.l., Italy
Citation Information: Costantiello, A. & Leogrande, A.,(2024). The impact of voice and accountability in the esg framework in a global perspective. Academy of Accounting and Financial Studies Journal, 28(2), 1-19.
Abstract
We estimate the value of Voice and Accountability-VA in the context of the Environmental, Social and Governance-ESG data of the World Bank using data from 193 countries in the period 2011-2021. We use Panel Data with Fixed Effects, Panel Data with Random Effects and Pooled Ordinary Least Squares-OLS. We found that the level of VA is positively associated, among others, to “Maximum 5-Day Rainfall”, and “Mortality Rate Under 5” and negatively associated, among others, to “Adjusted Savings: Natural Resources Depletion”, and “Annualized Average Growth Rate in Per Capita Real Survey Mean Consumption or Income”. Furthermore, we apply the k-Means algorithm optimized with the Elbow Method. We found the k-Means useless due to the low variance of the variable among countries with the result of a hyper-concentration of elements in a unique cluster. Finally, we confront eight machine-learning algorithms for the prediction of VA. Polynomial Regression is the best predictive algorithm according to R-Squared, MAE, MSE and RMSE. The level of VA is expected to growth on average of 2.92% for the treated countries.
Keywords
Analysis of Collective Decision-Making, General, Political Processes, Rent-Seeking, Lobbying, Elections, Legislatures and Voting Behaviour, Bureaucracy Administrative Processes in Public Organizations, Corruption, Positive Analysis of Policy Formulation, Implementation.
Introduction
In this article, we analyse the role of VA in the context of ESG. VA refers to the perceived ability of citizens to participate in government selection, to have full freedom of expression, freedom of association and free media. This variable belongs to the dimension of governance in the context of ESG models. Specifically, we asked whether positive variations in the value of VA could also predict positive values in terms of environmental sustainability and social inclusion. The need to keep environmental, social and governance aspects together represents an evolution of stakeholder-type approaches from the corporate dimension to the public area. The application of ESG models to the evaluation of countries indicates the need to evaluate the complex of economic, social, and environmental performances observed at country level with new tools. From the point of view of economic policies, the application of ESG models requires policy makers to design legislative interventions that can calculate the set of social, environmental and governance effects.
It should be considered that the value of VA or the participation of the population in the democratic choices together with the request for a public accountability, becomes increasingly relevant to a global level due to the contrast between democratic and autocracy countries. The contrast between eastern countries and western countries has become increasingly clear following the Russian-Ukraine war and the China-USA tech-war. This condition led to the falsification of the hypothesis of the “End of the history” formulated by the political scientist Francis (Fukuyama, 2006) i.e. the idea that the American capitalism had definitively won by transforming globalization into a unique western civilization.
The trend of democratic participation and good governance expressed by VA seems to be absolutely in contrast to a few decades ago at global level. Both in eastern countries and in western countries, a reduction in public participation in democratic life has occurred. In many countries the growth of populism on the one hand and abstention on the other has led the population to a type of superficial political participation very distant from the ideological formation offered by the political parties of the twentieth century. On the other hand, also in Western countries, violent political phenomena have occurred such as the attack on Capitol Hill in Washington and the protests following the election of Lula in Brazil.
Therefore, there are contradictory phenomena: on the one hand there is a reduction in political participation, on the other hand there is a growth of the violence of some phenomena that express an anti-democratic tension. To this condition it is necessary to add the growth of nationalistic political parties in many Western countries, and in particular in Europe, as in the case of “Fratelli d’Italia” in Italy and “Rassemblement National” in France. These parties focusing on an irrational, emotional and sentimental dimension of political participation, represent from many points of view a retreat of western political culture centred on the dimension of civil participation and accountability. Furthermore, the nationalist parties seem to exacerbate the contrast among Western and Eastern countries, undermining the idea of globalization.
Finally, some considerations must be carried out in relation to the Movement of Civil Rights. The western world seems to be oriented towards the protection and promotion of civil rights that are placed at a higher level also than social rights. However, civil rights, being much more folded on the private sphere, do not have the ability to change the structure of participation in political activity, such as social rights that instead directly invest the action of the state. The result is a difficulty of the population to participate in the public debate and a folding on the “Identity Politics” i.e. the contrast among groups and political tribes that have a specific and restricted well-defined identity.
There are also further elements that tend to be at the centre of VA in the western world i.e.: the environmental question and the condition of the poors or new poors. From an environmental point of view, the western world, and above all Europe, have create legislations oriented to fight the climate change. However, the tangible results of these policies are uncertain. Uncertainty depends on the fact that a large part of the world population lives in countries that show low levels of environmental culture. In addition, countries with low pro-capita income need to consume large quantities of energy to have access to higher income levels as indicated by the Kuznets Environmental Curve-KEC. The result is the growth of dissatisfaction in the environmental movement that takes the form of pseudo-terrorist attacks aimed at catalysing the attention of the population. This phenomenon also manifests a weakness of VA in the western world. In fact, if VA was more present then environmentalists could create their parties and actively participate in political decisions as in the case of German institutional framework. From the point of view of income support policies, it must be considered that many western countries have developed tools of income subsidy to avoid the risk of forms of poverty. There are new forms of poverty that concern not only people who do not work, as well as the people who work the so-called working-poors. However, the low levels of VA that often also record in the western world prevent you from dealing with the question from a political point of view with adequate proposals. The result is a growth of social inequality and a worsening of the economic conditions of the population.
The article continues as below: the second section contains the analysis of the scientific literature, the third section shows the methodological model used to find the determinants of VA, the fourth section shows the results of the econometric model, the fifth section presents the cluster analysis, the sixth section contains the prediction with machine learning algorithms, the seventh section concludes. The appendix contains the statistics tables and further metric results.
Literature Review
A summary of the reference literature is indicated in the following part. The above citations refer to various VA applications. The articles cited are empirical, i.e. based on data. It is not possible to identify a certain impact of the value of VA on a set of variables due to data dependency. The same propositions tested with different datasets give rise to a set of diversified solutions. Sometimes even similar datasets give rise to different results from the metric point of view for almost identical research hypotheses. The results are often ambiguous. Sometimes VA is positively associated with economic growth, green orientation and social equality, and other times instead it has a negative or statistically insignificant value. The only element on which the literature seems to agree is the impact that VA has on the development of a health system in developing countries and on FDI.
VA and FDI
VA has a positive impact in promoting Foreign Direct Investment-FDI in Brazil, Russia, India, China, and South Africa-BRICS economies (Jadhav, 2012). Similar analysis conducted on 27-transition economies show the presence of a positive relationship between FDI and VA (Zvezdanovic et al., 2021) even if it depends from the value of economic growth. VA has a positive impact on China’s outward FDI in Association of Southeast Asian Nations-ASEAN countries (Kumaran et al., 2020). VA has a positive impact on Chinese FDI in Africa (Shan et al., 2018) .VA improves FDI in Sub Saharan Africa-SSA (Ofori & Asongu, 2021). The positive impact of VA, and other governance indicators, on FDI inflows is greater for developed countries then for developing nations (Sabir et al., 2019). VA attracts more FDI, as showed in a set of 41 African countries (Bouchoucha & Benammou, 2020). VA has a positive effect on FDI in ten European developing countries (Badea et al., 2018). As can be seen from this analysis it results that the value of VA on FDI is positive. It follows that countries that have greater capacity to make their citizens actively participate in the political process from a decision-making point of view and that force the institutions to account for their actions, attract foreign capital more easily. Countries that have an orientation towards VA are also generally democratic countries, in which it is possible to enforce property rights and which therefore can be subject to FDI.
VA and COVID 19
There is no relationship between the government response to COVID 19 and the level of VA in a set of 119 countries (Nagasivam et al., 2022). Indeed the decisions that have been made by governments during the pandemic have been highly unpopular. In many cases, the choice of governments to implement lockdowns has generated protests from the population. No-vax and anti-lockdown groups have appeared both in the West and in the East, questioning governments during the pandemic. However, these protests did not produce the desired effect. In fact, governments have in any case practiced lockdowns and enforced limitations to travel and social activities except for pre-established exceptions. Furthermore, many governments have operated under conditions of exceptional power, asking parliament for extra powers, in order to be able to manage the social order even with emergency tools during the pandemic.
VA and Economic Growth and Development
VA has an insignificant impact on GDP growth in the case of Pakistan (Saddique et al., 2020) and other emerging countries (Lakshmanasamy, 2022); May et al., 2002) . Similar results are tested for the case of Kazakhstan (Absadykov, 2020). VA has a positive impact on economic development in West African countries (Afolabi, 2019). The increase in one unit of VA is associated to an improvement of 57.5% in Nigeria (Olabiyi & Olowookere, 2021). VA has no direct effect on economic growth in West African Economic and Monetary Union-WAEMU (Combey, 2017).VA has a positive impact on economic growth in developed countries (Zhuo et al., 2021). VA is positively associated to economic growth in 27 Post Socialist Economies (Alexiou et al., 2020). VA has a negative impact on economic growth in 10 Asian Countries in the period 2002-2014 (Bajit, 2021). In this case, it is not possible to identify a clear relationship between AV and economic growth and between AV and economic development. The results of the cited articles are controversial. Certainly, a significant data-dependency prevents us from generalizing. On a theoretical and ideal level, one could hypothesize a positive relationship between VA and economic growth. However, no such relationship is present in the data. Empirical results, on the contrary, show controversial and ambiguous results, which prevent the formulation of universal rules.
VA and International Economics
VA has a positive impact of exports of good and especially primary commodities (Bah et al., 2021). VA has a positive effect on the export of ICT products in Sub Saharan Africa (Asongu, 2019). VA has a negative impact on globalization in a set of 51 African countries considered in the period 1996-2011 (Asongu et al., 2018). In addition, in this case it is not possible to identify univocal rules. It is not generally known whether VA produces export growth or whether VA creates the conditions for more marked globalization. In reality, a strong data-dependency prevents generalizations from being made. The results appear counterfactual. As in the case of the African sample, where the growth of VA is negatively associated with globalization. A paradoxical condition that contrasts with the idea that the "export of democracy" and of a system of public control over the functioning of institutions can in itself generate a growth in trade on a global level.
VA, Investments, and Innovations
VA has a positive effect on Private Public Partnership-PPP investments in Indonesia (Grafitanti & Ubed, 2022). Low values of VA have a negative impact on innovations in Pakistan (Nadeem et al., 2020). There is a positive and non-significant relationship between e-participation and VA in asset of 136 countries covering the period 2010-2018 (Waheduzzaman & Khandaker, 2022). VA has a positive impact in the digitalization process in Latin America (Arredondo-Trapero et al., 2019). VA has a positive impact on the promotion of democratic practices for countries that have low level of e-participation (Wang et al., 2020). VA is positively associated to digitalization as showed in a study on 193 countries at world level (Durkiewicz & Janowski, 2018). VA improves e-participation in a set of 96 countries (Ifinedo et al., 2021). In this case, the impact of VA on digitization, innovation and investment appears ambiguous. Some results seem to confirm the idea that a growth of VA can lead to greater investments, innovation and digitization. However, other results in the literature are conflicting. The result is also in this case a confused picture with a strong data-dependency. It is not possible to generalize the impact of VA on investment and technological innovation. The idea that a population that reclaims its rights to political participation and requires greater public accountability may also be able to support greater investments and innovations does not find unanimous consensus in the empirical literature.
VA and Taxation
The increase in the level of taxation can promote an increase in the level of VA. If the level of taxation overcomes, the 49% of GDP then the probability of VA improve significantly (Quak, 2019). The association between VA and tax compliance behaviour is not significant in East Malaysia (Bakar et al., 2021). The impact of tax growth tends to be positive on VA value. This condition seems to be consistent with a theoretical framework. In fact, as indicated in the old motto “No Taxation without Representation”, it is not possible in the context of Western countries to accept a form of taxation without also granting a power of political representation through the parliament. In this case, the reference is to liberal parliamentarianism of Anglo-Saxon origin, which has its own characteristic element in accountability. People can intend the increase in taxes as a reduction of social justice and can protest and create new organizations oriented towards political struggle to promote a change in the distributional effect of fiscal policies.
VA Environment and Sustainability
Companies that operate in countries with higher levels of VA are more oriented to subscribe sustainability assurance (Bakhsh et al., 2019). VA is negatively associated to CO2 in Sub Saharan Africa (Asongu & Odhiambo, 2020). VA is positively associated to an increase in CO2 in Belt and Road Initiative-BRI countries (Khan et al., 2022). It is therefore not possible to generalize the impact of VA on the environmental issue. There are conflicting results. In some cases, VA reduces pollution; in other cases, it increases it. We are faced with results that prevent us from generalizing the relationship between VA and the environmental dimension. On a theoretical level, it is possible to hypothesize a positive relationship between the growth of VA and the growth of a green conscience and a sustainable economy. However, the literature shows divergent effects, which negatively affect the possibility of proposing general system propositions.
VA, Finance and Banking
Countries with higher levels of VA have higher probabilities to adopt Central Banks Digital Currencies-CBDC (Matsui & Perez, 2022). VA has a positive effect on financial leverage in a set of 1853 observation of manufacturing companies listed in Thailand, Singapore, the Philippines, Indonesia, and Malaysia (Sasikirono et al., 2023) VA is positively associated to the diffusion of the culture of insurance and financial access in Sub Saharan Africa (Asongu & Odhiambo, 2020). VA has a negative impact on stock market performance in six Gulf Cooperation Council-GCC countries in the period 2006-2017 (Modugu & Dempere, 2020). VA tends to have a positive impact in banking and financial terms. This condition is because the development of a financial market tends to be maximum in liberal democratic regimes where there is also the recognition of property rights and the freedom to trade. In this context, the population tends to be more oriented towards carrying out financial and banking activities also thanks to the presence of a more marked culture of business, investment and risk.
VA, Education, Health and Social Issues
VA has a positive but not significant effect on the quality of education in a set of nine Asian countries observed for 28 years (Saengchai et al., 2020). VA has a positive impact in promoting better health conditions in Africa (Dotun-Olujinmi et al., 2022). VA has a positive relationship with the number of law against discrimination in the workforce (Cheng et al., 2018). VA has a positive impact in promoting universal health coverage in Thailand (Kantamaturapoj et al., 2020). VA has a positive association with depression rate in China, USA, India e Bangladesh in the period 1995-2016 (Das & Chatterjee, 2023). VA has a positive effect in the treatment of non-communicable disease such as diabetes in African countries (Dotun-Olujinmi et al., 2022). VA has a negative impact on suicide rates (De Bruin et al., 2020). VA has a negative impact on Early Childhood Caries-ECC in a set of 154.452 children from 104 countries (Folayan et al., 2020). The relationship between VA and the reduction of inequality is not statistically significant in Africa (Kunawotor et al., 2022). In this case, a positive relationship between the value of VA and social and public health issues is evident. Countries with higher VA tend to also claim higher investment in health economic policies, at least for the most common diseases. The creation of a universal public health system also depends on the population's ability to act through an increase in VA. Furthermore, the positive benefits in terms of reducing suicides also show the role of VA in the creation of social relationship networks. In this sense, an emblematic case is that of the USA. In fact, the USA are certainly not at the top of the ranking for value of VA and in fact are characterized by a privatized health system and a high presence of suicides out of desperation (Case & Deaton, 2020).
VA and Governance
There is a negative relationship between VA and corruption in SSA countries in the period 2004-2018 (Achioyamen & Kazmi Johansson, 2020). VA has a positive impact on trust in government (Spiteri & Briguglio, 2018) .VA can promote better financial accountability of the government in developing countries in Eastern European countries (Fedosov & Paientko, 2018). VA is positively associated with good governance models. In fact, this relationship tends to be endogenous. In fact, VA is part of the WB's good governance indicators. Countries that have a growing VA tend to be less corrupt and ask governments for better accountability. Public accountability makes it possible to better organize the political and economic debate, orienting the democratic order towards greater control with an increase in civil participation.
In summary, the role of VA as indicated in the analysed literature does not appear particularly clear. Within the same tested econometric relationships, there are contrasting effects. However, this condition could be due to some inefficiency in the building process of the indicator VA. In fact, as also indicated in the fifth section, the VA values show low variance, such as to make clustering complex and meaningless due to the crushing of the majority of countries into a single cluster. It follows that the reported scientific literature seems to suggest a refinement of VA as an indicator, to avoid the excess of data-dependency, which prevents forms of generalization of the metric regularities found.
Methodology Applied for the Investigation of the Determinants of VA
In this article, we have used a mixed methodology to address the variable of interest from a metric point of view. Specifically, we took into consideration three different analytical techniques used for different purposes.
Econometric models
We used a set of econometric models to test the relationships of the variable VA within the World Banks ESG dataset. We started from a model of 63 variables for 193 countries in the period between 2011 and 2021. Among these variables, already consistent from a theoretical point of view with the ESG approach, we have choose the most significant in terms of p-value. The relationships among the preferred variable were tested through the application of panel data models. Panel models were chosen to overcome the problem of the limitation that either cross-section models either time series models introduce in the econometric analysis of complex datasets. Specifically, we used Panel Data with Fixed Effects models and Panel Data with Random Effects models (Figure 1). For further control, the Pooled OLS model was also used. The relationships obtained, even if significant from the point of view of the p-value, cannot be considered as cause-effect relationships. On the contrary, these relationships have been described as mere associations of variables, of which the possible causes have been investigated not from a metric point of view, but from a logical-theoretical perspective.

Figure 1 Methodological Approach to the Estimation of the Value of VA in the Context of the ESG Dataset of the World Bank
Clusterization with k-Means algorithm
Later we used a clustering model based on the k-Means algorithm. Specifically, the k-Means algorithm has been optimized through the use of the Elbow method chosen instead of the more conventional Silhouette coefficient. However, due to the low variance found in the variable as well in a population of 193 countries, the use of the k-means algorithm was essentially useless. In fact, the result shows the presence of a single cluster which substantially totals the vast majority of the countries present in the analysis. The result is obviously unbalanced. A structure of three clusters is therefore proposed which, however, do not respond to the question of finding a method of grouping countries that can be efficient in terms of distribution. In fact, in case of low variance in the value of the variable and super-concentration of countries in a single cluster, it is clear that the grouping technique must be considered as inefficient and lacking in the possibility of accurately identifying distinctions between countries.
Machine Learning and Predictions
To estimate the future trend of the variable we used eight different machine-learning algorithms for prediction. The algorithms were analysed based on a set of statistical errors, i.e. R-squared, MAE, MSE, and RMSE. The algorithms were trained using 80% of the data while the remaining 20% was used for prediction. For each statistical indicator, a position has been identified within the ranking. Subsequently, the rankings of the algorithms in the individual classifications were added together, generating a score. Therefore, the lower the score of the algorithm, the higher its positioning in the ranking and therefore the better its predictive capacity. The Konstanz Information Miner-KNIME software was used to estimate the values. KNIME is free data analysis software. In particular, three macro-groups of nodes have been used in the KNIME processing model:
Data Preparation
Consisting of four blocks. “Excel Reader” allows data to be entered into the software. “Colum Filter” allows to select the columns of the dataset to be included in the predictive analysis, “Normalizer” reports all the data on a scale of values between 0 and 1. “Partitioning” offers a set of tools for selecting the sample for training the algorithm and the part of the data on which to project the prediction. In our case, we chose the 80%- 20% model, i.e. 80% of the data was used for prediction while the remaining 20% was used for the prediction.
Machine Learning and Predictions
It is the second phase of the analysis which consists in the activation of the machine learning algorithms for the prediction. In KNIME, learning and prediction are assigned to two different nodes. In our case we repeated the learning and prediction eight times, each for each algorithm used;
Results and Statistical Measures
It is the final part of the KNIME workflow that allows you to verify the effectiveness of the algorithms measured on the basis of a set of statistical errors, i.e. R-Squared, MAE, MSE, and RMSE. In this part, it is also possible to insert the “Normalizer” node to avoid that some values of the statistical errors have non-comparable numerical scales (Figure 2).

Figure 2 Example of Workflow in Knime
It is possible to verify the presence of the three macro-groups of nodes i.e. Data Preparation, Machine Learning and Predictions, Results and Statistical Measures.
Therefore, through the application of this methodology that uses a varied set of analytical techniques, we analysed the role of the VA variable within the World Bank's ESG dataset with the aim of identifying three macro-phenomena:
a) VA's connections to other ESG variables in the World Bank dataset.
b) The existence of groupings of countries by value of VA using the k-Means algorithm.
c) The prediction of the future value of VA and the shape of the trend of the variable with machine learning algorithms.
The results of are showed in the fourth, fifth and sixth section.
The Econometric Model for the Estimation of VA in the Context of the ESG Dataset of World Bank
In this part, we present the results of the regression analysis that we used to estimate the value of VA in the context of the World Bank's ESG data. Specifically, we used data from 193 countries in the period between 2011 and 2021. The data were analysed through the use of the following econometric models, namely: Panel Data with Random Effects, Panel Data with Fixed Effects, Pooled OLS. The econometric analysis is aimed at identifying the presence of relationships between the variables within the proposed model. The results must not be understood as cause-and-effect relationships, as techniques capable of capturing causal relationships have not been used. On the contrary, the results of the econometric analysis should be considered as associations between variables that persist within a single theoretical context, i.e. the ESG model. Therefore, it was not simply a mere metric-statistical exercise. For the following reasons:
a) The variables analysed are consistent with each other within the ESG model that the World Bank has prepared precisely with the aim of highlighting the relationships between the phenomena observed at a global level.
b) The results obtained through the application of econometric techniques highlight not the cause-effect relationships but the associations that can be the object of specific policies. Of the initial 67 variables originally present within the dataset, 10 were chosen, based on strictly metric criteria, which constitute the model analysed below.
We have estimated the following equation:
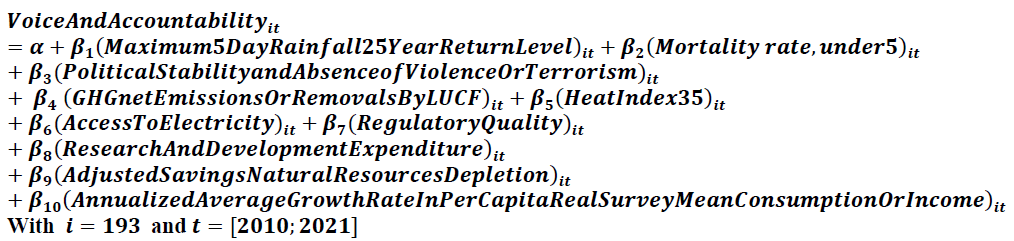
Specifically we found that the value of VA is positively associated to Maximum 5-day Rainfall, 25-year Return Level: there is a positive relationship between the number of rainy days recorded and the Voice and Accountability value. The reason is due to the fact that most of the countries that have high levels of VA also have high values in terms of rainfall. It is in fact a whole series of small states, generally islands that are located in rainy areas geographically. Obviously such countries are also small and therefore do not really give a true representation of the relationship between the climatic aspects captured by the rain and the value of the representative institutions of liberal democracy that are descripted by VA (Figure 3). However, this is a significant relationship as it indicates that democratic freedoms are connected to small states and that instead highly populous states have reduced VA levels even when they are formally democratic countries open to confrontation.

Figure 3 Relationship between VA 2019 and Average Precipitation 2019
There is a positive relationship between the two variables
Mortality rate under-5
It is a variable that takes into consideration the under-five mortality rate, i.e. the probability out of a thousand that a new-born will die before reaching the age of five. It should be considered that there is a positive relationship between the value of the mortality rate within 5 years and the value of VA. This condition depends on the fact that many democratic countries which tend to have a low level of mortality within 5 years.
Political Stability and Absence of Violence/Terrorism
It is a variable that takes into account political stability and the absence of violence and terrorism measures the population's perception of the presence of political instability at the country level. The variable is represented by an aggregate indicator that varies between -2.5 and 2.5 units. There is a positive relationship between the value of VA and the value of Political Stability and Absence of Violence/Terrorism. This relationship indicates that the countries that offer more opportunities for the population to participate more actively in political processes also have greater political stability and absence of terrorism and violence.
GHG net emissions/removals by LUCF
It is a variable that takes into account the value of net GHG emissions that refer to changes in atmospheric levels. There is a positive relationship between the VA value and the GHG value. This relationship depends on the fact that many of the western countries have very high pollution values.
Heat Index 35
It is a variable that takes into consideration the total count of the days per year when the average daily heat index has risen above 35 ° C. A heat index is a measure of how warm is heard once humidity It is taken into consideration with the air temperature. There is a positive relationship between the value of VA and the number of days in which the temperature has growing above 35 degrees. This condition is due to the climate change and geographical positioning of many countries that have high level levels.
Access to electricity
It is the percentage of population with access to electricity. Electrification data are collected by industry, national surveys, and international sources. There is a positive relationship between the value of access to electricity and VA. The countries that have high level levels also have full access to electricity.
The value of VA is negatively associated to:
Regulatory Quality
It is an indicator that captures the perceptions of the government's ability to formulate and implement solid policies and regulations that allow and promote the development of the private sector. The percentage rank indicates the degree of the country among all the countries covered by the aggregate indicator, with 0 corresponding to the lower degree and from 100 to the highest degree. There is a negative relationship between the regulatory quality value and the value of VA.
Research and development expenditure
It is the gross internal expenses on research and development (R&D), expressed as a percentage of GDP. They include both capital and current expenses in the four main sectors: companies, government, higher education and private organization. The R&D covers basic research, applied research and experimental development. There is a negative relationship between the value of R&D expenses as a percentage of the GDP and the value of VA. It follows that the countries in which we significantly invest in research and development are unable to guarantee high levels of political and social participation to the population. This phenomenon seems to be counterfactual. However, it must be considered that many countries that export science and technological, such as the USA, have reduced values in end of VA.
Adjusted Savings
Natural resources depletion
It is the sum of net forest depletion, energy depletion, and mineral depletion. There is a negative relationship between the value of VA and the value of net depletion of forests. Many of the countries that have high levels of VA also have high levels of forest depletion. This condition is due to geographical and morphological reasons.
Annualized average growth rate in per capita real survey mean consumption or income, total population
It is calculated as the average annualized growth rate of per capita real consumption or income of the bottom 40% of the population in the income distribution in a country. This variable is negatively associated with VA. Countries with high VA are countries in which the condition of the poorest 40% of the population does not increase. Indeed, it is precisely the lack of a growth rate of income or consumption of the poorest population that generates a growth of VA or a greater political and institutional participation of the population (Table 1).
| Table 1 Estimation of the value of Voice and Accountability-A67- with a set of Differentiated Econometric Techniques | |||||||||
| Fixed Effects | Random Effects | Pooled OLS | Average | ||||||
| Coefficient | P-Value | Coefficient | P-Value | Coefficient | P-Value | ||||
| Constant | -0,0361211 | * | -0,0415364 | -0,20538 | *** | -0,094345833 | |||
| A2 | Access to electricity (% of population) | 0,00067381 | ** | 0,00083898 | *** | 0,00405436 | *** | 0,001855715 | |
| A3 | Adjusted savings: natural resources depletion (% of GNI) | -0,00445996 | ** | -0,00685231 | *** | -0,0416954 | *** | -0,017669223 | |
| A8 | Annualized average growth rate in per capita real survey mean consumption or income, total population (%) | -0,0722069 | *** | -0,0732645 | *** | -0,0896786 | *** | -0,078383333 | |
| A25 | GHG net emissions/removals by LUCF (Mt of CO2 equivalent) | 0,17418 | *** | 0,17435 | *** | 0,475106 | *** | 0,274545333 | |
| A29 | Heat Index 35 (projected change in days) | 0,0473542 | *** | 0,0488288 | *** | 0,0693485 | ** | 0,055177167 | |
| A37 | Maximum 5-day Rainfall, 25-year Return Level (projected change in mm) | 0,94757 | *** | 0,963675 | *** | 113.785 | *** | 37928,97042 | |
| A40 | Mortality rate, under-5 (per 1,000 live births) | 1,89E+00 | * | 2,06E+00 | ** | 0,00014733 | *** | 1,319225778 | |
| A47 | Political Stability and Absence of Violence/Terrorism: Estimate | 0,269915 | *** | 0,291063 | *** | 0,477794 | *** | 0,346257333 | |
| A55 | Regulatory Quality: Estimate | -0,00554823 | ** | -0,00540623 | ** | -0,0169492 | *** | -0,00930122 | |
| A58 | Research and development expenditure (% of GDP) | -0,0432249 | *** | -0,0414803 | *** | 0,056496 | *** | -0,009403067 | |
Clusterization with k-Means Algorithm
A cluster analysis using the k-Means algorithm optimized with the Elbow method is presented. Three different clusters are identified as identified below, namely:
Cluster 1
Albania, Algeria, Angola, Argentina, Armenia, Australia, Austria, Azerbaijan, The Bahamas, Bahrain, Bangladesh, Barbados, Belarus, Belgium, Belize, Benin, Bhutan, Bolivia, Bosnia and Herzegovina, Botswana, Brazil, Brunei Darussalam, Bulgaria, Burkina Faso, Burundi, Cabo Verde, Cambodia, Cameroon, Canada, Central African Republic, Chad, Chile, China, Colombia, Comoros, Congo Dem. Rep., Congo Rep., Costa Rica, Cote d'Ivoire, Croatia, Cuba, Cyprus, Czech Republic, Denmark, Djibouti, Dominican Republic, Ecuador, Egypt, Arab Rep., El Salvador, Equatorial, Guinea, Eritrea, Estonia, Eswatini, Ethiopia, Fiji, Finland, France, Gabon, The Gambia, Georgia, Germany, Ghana, Greece, Guatemala, Guinea, Guinea-Bissau, Guyana, Haiti, Honduras, Hong Kong, Hungary,Iceland, India, Indonesia, Iran, Iraq, Ireland, Israel, Italy, Jamaica, Japan, Jordan, Kazakhstan, Kenya, North Korea, South Korea, Kosovo, Kuwait, Kyrgyz Republic, Lao, Latvia, Lebanon, Lesotho, Liberia, Libya, Liechtenstein, Lithuania, Luxembourg, Madagascar, Malawi, Malaysia, Mali, Malta, Mauritania, Mauritius, Mexico, Moldova, Mongolia, Montenegro, Morocco, Mozambique, Myanmar, Namibia, Nepal, Netherlands, New Zealand, Nicaragua, Niger, Nigeria, North Macedonia, Norway, Oman, Pakistan, Panama, Papua New Guinea, Paraguay, Peru, Philippines, Poland, Portugal, Qatar, Romania, Russian Federation, Rwanda, Sao Tome and Principe, Saudi Arabia, Senegal, Serbia, Seychelles, Sierra Leone, Singapore, Slovak Republic, Slovenia, Somalia, South Africa, South Sudan, Spain, Sri Lanka, Sudan, Suriname, Sweden, Switzerland, Syrian Arab Republic,Taiwan, Tajikistan, Tanzania, Thailand, Timor-Leste, Togo, Trinidad and Tobago, Tunisia, Turkiye, Turkmenistan, Uganda, Ukraine, United Arab Emirates, United Kingdom, United States, Uruguay, Uzbekistan, Venezuela, Vietnam, West Bank and Gaza, Yemen Rep., Zambia, Zimbabwe.
Cluster 2
American Samoa, Anguilla, Bermuda, Cook Islands, Guam, Martinique, Netherlands Antilles, Niue, Reunion, Virgin Islands (U.S.);
Cluster 3
Andorra, Antigua and Barbuda, Aruba, Cayman Islands, Dominica, French Guiana, Greenland, Grenada, Jersey, Channel Islands, Kiribati, Macao, Maldives, Marshall Islands, Micronesia Fed. Sts., Monaco, Nauru, Palau, Puerto Rico, Samoa, San Marino, Solomon Islands, St. Kitts and Nevis, St. Lucia, St. Vincent and the Grenadines, Tonga, Tuvalu, Vanuatu.
From the point of view of the analysis of the median of the clusters, the following ordering of the clusters results: C3=0.73>C2=0.25>C1=0.13. Since 177 out of 214 countries are part of a single cluster, it follows that the cluster analysis is inefficient. This condition prevents us from finding utility in the application of the k-Means algorithm. In fact, cluster 1 is made up of a group of countries, which are characterized by significant heterogeneity. In Cluster 1 there are countries that have a very different level of per capita income, that have divergent levels of democracy, that have structural economic data that are very difficult to compare. It follows that the clustering in this case fails to achieve the effect of generating homogeneous groupings inside and heterogeneous outside. In fact, in this sense it is necessary to consider an endogenous homogeneity to the clusters and an inter-cluster heterogeneity.
However, this condition also allows us to make some theoretical considerations. The k-Means algorithm to be efficient must be able to identify groupings within the analysed variable. We need to somehow evaluate the efficiency of clustering. By efficiency of clustering, we mean a measure that allows data to be distributed in different clusters avoiding the concentration of within one cluster. This condition becomes essential above all with the growth of the sample number of available data. The k-Means algorithm is an unsupervised algorithm. The value of the clusters is decided by the data analyst based on indicators that can be used, for example the Elbow method and the Silhouette coefficient. However, if, even by varying the value of k, it turns out that there is a cluster that totals the majority of existing observations, then this condition indicates that the k-Means algorithm is unable to identify groupings that exist in the data. The conclusion in this case is that the data structure does not allow for clustering. There are further operations that could be carried out in this case. For example, it is possible to eliminate the presence of outliers in the data distribution. However, if even after the elimination of the outliers, the distribution of the observations within the clustering is highly concentrated in one cluster, even if the number of k is varied, then it should be concluded that the k-Means algorithm is not an efficient tool for the clustering. Alternatively, it can be concluded that the data have a high degree of uniformity, such as to prevent groupings with a low degree of concentration. In the case that we have analysed in relation to the value of VA we have found the concentration in a single cluster of the majority of observations. In fact, even by varying the number of k from three to nine, it still results a structure with a dominant cluster that contains the majority of the elements of the distribution. It follows in this case that the clustering is not of particular interest, as it does not identify a real structure of the groupings that can make us reflect on the heterogeneity of the data analysed (Figure 4). On the contrary, the data present a significant homogeneity and this condition is reflected by the classification algorithm, which places most of the observations in the same cluster, reducing the analytical efficiency of the k-Means algorithm for grouping purposes.

Figure 4 The Elbow Method for the Optimization of the K-Means Cluster
Machine Learning and Predictions for the Prediction of VA
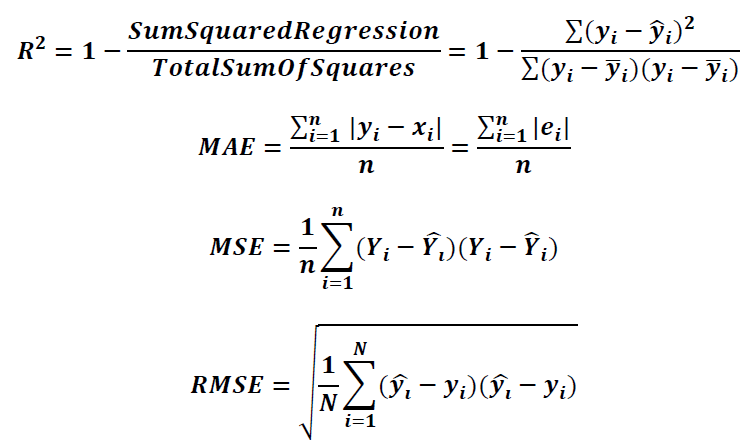
In the following part we have proposed the application of eight machine learning algorithms for predicting the future value of the variable VA. The algorithms were trained with 80% of the available data while the remaining 20% was used for the actual prediction. The performance of the algorithms was analysed on the basis of maximizing the R-squared and minimizing the statistical errors (Table 2). Specifically, we have applied the following formulas:
| Table 2 Statistical Errors of Machine Learning Algorithms for Prediction | ||||
| Statistical Measures | ANN-Artificial Neural Network | PNN-Probabilistic Neural Network | Simple Regression Tree | Gradient Boosted Tree Regression |
| R^2 | 0,98724202 | 0,032358049 | 0,959063002 | 0,96876 |
| Mean absolute error | 0,01602546 | 0,0920011 | 0,011809697 | 0,01235 |
| Mean squared error | 0,00000000 | 0,029080326 | 0,00123027 | 0,00100 |
| Root mean squared error | 0,01958093 | 0,170529544 | 0,03507521 | 0,03064 |
| Statistical Measures | Random Forest Lregression | Tree Ensemble Regression | Linear Regression | Polynomial Regression |
| R^2 | 0,988617814 | 0,989999463 | 0,969224604 | 0,992247264 |
| Mean absolute error | 0,015479241 | 0,013834513 | 0,027643827 | 0,012499132 |
| Mean squared error | 0,00E+00 | 0,00E+00 | 0,001 | 0,00E+00 |
| Root mean squared error | 0,018495034 | 0,017336202 | 0,030411939 | 0,015264051 |
In particular, the following ordering of the algorithms by predictive ability has been identified, i.e.:
a) Polynomial Regression with a payoff equal to 9;
b) Tree Ensemble Regression with a payoff equal to 11;
c) Random Forest Regression with a payoff equal to 13;
d) ANN-Artificial Neural Network with a payoff equal to 15;
e) Gradient Boosted Tree Regression with a payoff equal to 19;
f) Simple Regression Tree with a payoff equal to 22;
g) Linear Regression with a payoff equal to 23;
h) PNN-Probabilistic Neural Network with a payoff equal to 32;
i) Therefore, based on the analysis carried out, it appears that the best algorithm for predictive capacity is the Polynomial Regression.
Overall, there are countries for which a growth in the value of VA is predicted and countries for which a reduction of the same value is predicted (Table 3). Among the countries for which a reduction in the value of VA is predicted are:
| Table 3 Ranking of Algorithms for Statistical Errors | ||||||
| Rank | Algorithms | R^2 | Mean absolute error | Mean squared error | Root mean squared error | Sum |
| 1 | Polynomial Regression | 1 | 3 | 4 | 1 | 9 |
| 2 | Tree Ensemble Regression | 2 | 4 | 3 | 2 | 11 |
| 3 | Random Forest Lregression | 3 | 5 | 2 | 3 | 13 |
| 4 | ANN | 4 | 6 | 1 | 4 | 15 |
| 5 | Gradient Boosted Tree Regression | 6 | 2 | 5 | 6 | 19 |
| 6 | Simple Regression Tree | 7 | 1 | 7 | 7 | 22 |
| 7 | Linear Regression | 5 | 7 | 6 | 5 | 23 |
| 8 | PNN | 8 | 8 | 8 | 8 | 32 |
a) Zambia with a reduction of -19.57%:
b) South Africa with a reduction of -10.34%;
c) Syrian Arab Republic with a reduction of -9.83%;
d) Zimbabwe with a reduction of -8.16%;
e) Uganda with a reduction of -7.66%;
f) Yemen with a reduction of -6.89%;
g) Turkey with a reduction of -6.83%;
h) Tunisia with a reduction of -6.76%;
i) Venezuela with a reduction of -6.72%;
j) Tanzania with a reduction of -6.28%;
k) Thailand with a reduction of -4.58%;
l) Vietnam with a reduction of -3.97%;
m) Tonga with a reduction of -3.02%;
n) Ukraine with a reduction of -2.54%;
o) Suriname with a reduction of -1.05%;
p) St. Lucia with a reduction of -0.49%;
q) Virgin Islands with a reduction of -0.02%.
On average for these countries, a reduction in the value of VA equal to -6.16% is predicted. If we look at the economic dimension of these countries, we can verify that most of the countries for which a reduction in the value of VA is predicted are countries that have a low per capita income. The only exception in this sense is South Africa. However, South Africa is notoriously a country in which the structure of democratic rights has only been recognized following a series of political and civil struggles (Figure 5).

Figure 5 Predicted Values with Polynomial Regression
However, there are some countries, for which the algorithm predicts a positive trend in the value of VA, i.e.:
a) Togo with a value of 29.9%;
b) Sudan with 23.31%;
c) United Arab Emirates with an amount of 21.56%;
d) Uzbekistan with an amount of 21.32%;
e) United Kingdom with a value of 14.88%;
f) Spain and Sweden with an amount of 14.45%;
g) South Sudan with a value of 11.57%;
h) East Timor with a value of 9.52%;
i) Tajikistan with a value of 8.83%;
j) Solomon Islands with a value of 8.4%;
k) Vanuatu with a value of 7.66%;
l) Turkmenistan with a value of 6.19%;
m) Trinidad and Tobago with an amount of 5.84%;
n) Somalia with a value of 4.58%;
o) United States with an amount of 4.51%,
p) Taiwan with an amount of 4.41%;
q) West Bank and Gaza with a value of 3.27%;
r) Sri Lanka with an amount of 3.04%;
s) Tuvalu with a value of 1.84%;
t) Switzerland with an amount of 1.49%;
u) St. Kittis and Nevis with an amount of 1.27%;
v) St. Vincent and the Grenadines with a value of 1.27%;
w) Uruguay with an amount of 0.83%.
It must be considered that the countries for which a growth in the value of VA is expected are very heterogeneous and include both countries with medium-high per capita income such as the USA, Spain, the UK and Switzerland, as well as African and Asian countries (Figure 6). It follows that the expected growth in the value of VA cannot be connected to reasons of a geographical nature but rather refers to a similar data structure within the historical series of the countries analysed.

Figure 6 Predictions with Polynomial Regression
If we look at the average variation of VA also considering the value of the prediction obtained with the Polynomial Regression algorithm, it is possible to notice a fluctuating trend. In 2014, the value of VA reached an absolute maximum value, marking +9.26% signalling a significant growth in political and democratic participation at world level (Figure 7). The countries that grew the most in 2014 are mainly small countries, often represented by an island or an archipelago of small islands (Table 4). However, there are also countries of more significant dimensions, for which between 2013 and 2014 there was a considerable growth in the value of VA, among which the top 5 are indicated below: Yemen +20.31, Greece +19 ,62%, Syria +19.59%, Italy +19.01%, Jordan with 19.01%. Evidently, we are dealing with a very heterogeneous group of countries from a geographical, institutional and cultural-political point of view. Therefore, it is not possible to identify unequivocal reasons that could justify these significant increases in the value of VA. However, starting from 2014, the growth rate of VA began to decrease until it reached an absolute minimum value in 2019, marking -6.58%. However, also in this case there is a reduction, which is substantially guided by the presence of small and medium-sized countries, which have recorded significantly negative values. Among the medium-large sized countries that had negative values in the transition between 2013 and 2014 in terms of VA, there are the following: Cyprus, Ireland, Israel and Switzerland with a value of -5.78%, followed by Iceland with an amount of -5.67%, Latvia and Lithuania with an amount of -5.22%, Australia and New Zealand with an amount of 4.74%, Japan and Norway with an amount of -4.71% and the United States equal to -4.70%.
| Table 4 List of Abbreviations | |
| Foreign Direct Investments | FDI |
| Gross Domestic Product | GDP |
| Brazil, Russia, India, China, South Africa | BRICS |
| Voice and Accountability | VA |
| Environment, Social and Governance | ESG |
| Private Public Partnership | PPP |
| Ordinary Least Square | OLS |
| Cluster 1 | C1 |
| Cluster 2 | C2 |
| Cluster 3 | C3 |
| Artificial Neural Network | ANN |
| Probabilistic Neural Network | PNN |
| Konstanz Information Miner | KNIME |
| Green House Gas | GHG |
| Mean Absolute Error | MAE |
| Mean Squared Error | MSE |
| Root Mean Squared Error | RMSE |
| Central Banks Digital Currencies | CBDC |
| Association of Southeast Asian Nations | ASEAN |
| West African Economic and Monetary Union | WAEMU |
| United States of America | USA |
| Gulf Cooperation Council | GCC |
| Sub Saharan Africa | SSA |

Figure 7 Average Value of VA with ML Prediction
Conclusion
In this article we have estimated the value of VA in the context of the ESG dataset of the World Bank. VA's analysis is relevant from a political and institutional point of view. In fact, the current world political and economic scenario shows a contrast between democratic regimes, characterized by high levels of VA, and autocratic regimes with reduced VA levels. However, it should be considered that there are also changes in the western world in terms of VA. In fact, abstentionism, political violence, the radicalization of the clash among political parties, nationalism, anti globalism, has reduced the role of VA in the western world. From the metric point of view, we highlighted the negative relationship between VA and climate change. The clusterization conducted with the use of the K-means algorithm was unsuccessful due to the crowd of almost all countries in a single cluster. Finally, the prediction with machine learning algorithms shows an increasing trend of VA value in the future with an average of 2.92%. The role of VA will become increasingly relevant in the future due to the contrast between the political institutions of the western world and the eastern world. However, in the western world the value of VA is in crisis. Relevant in democratic countries such as the USA show low levels of VA. It is therefore necessary to strengthen the value of VA starting from western countries by creating a new political and institutional culture that through political parties can allow the population to actively participate in the dynamics of public decisions.
Declarations
Data Availability Statement
The data presented in this study are available on request from the corresponding author.
Funding
The authors received no financial support for the research, authorship, and/or publication of this article.
Declaration of Competing Interest
The authors declare that there is no conflict of interests regarding the publication of this manuscript. In addition, the ethical issues, including plagiarism, informed consent, misconduct, data fabrication and/or falsification, double publication.
Software
The authors have used the following software: Gretl for the econometric models, Orange for clusterization and network analysis, and KNIME for machine learning and predictions. They are all free version without licenses.
Acknowledgements
We are grateful to the teaching staff of the LUM University
“Giuseppe Degennaro” and to the management of the LUM Enterprise s.r.l. for the constant inspiration to continue our scientific research work undeterred.
References
Absadykov, A. (2020). Does good governance matter? Kazakhstan’s economic growth and worldwide governance indicators. Otoritas: Jurnal Ilmu Pemerintahan, 10(1), 1-13.
Indexed at, Google Scholar, Cross Ref
Achioyamen, C. V., & Kazmi Johansson, S. (2020). Institutional Factors and Financial Development in Sub-Saharan Africa for the period 2004-2018: Control of Corruption, Rule of Law, Political Stability and Absence of Violence, and Voice and Accountability.
Afolabi, J. O. (2019). The impact of governance on economic development in west africa: A system gmm dynamic panel approach. Acta Universitatis Danubius. Œconomica, 15(3), 217-231.
Alexiou, C., Vogiazas, S., & Solovev, N. (2020). Economic growth and quality of institutions in 27 postsocialist economies. Journal of Economic Studies, 47(4), 769-787.
Indexed at, Google Scholar, Cross Ref
Arredondo-Trapero, F. G., Vázquez-Parra, J. C., & la Garza-García, D. (2019). Voice and accountability and information technology for Latin America. Business & Economic Horizons, 15(4).
Indexed at, Google Scholar, Cross Ref
Asongu, S. A., & Asongu, N. (2019). The role of mobile phones in governance-driven technology exports in Sub-Saharan Africa. Journal of the Knowledge Economy, 10(2), 849-867.
Indexed at, Google Scholar, Cross Ref
Asongu, S. A., & Odhiambo, N. M. (2020). Governance, CO2 emissions and inclusive human development in sub-Saharan Africa. Energy Exploration & Exploitation, 38(1), 18-36.
Indexed at, Google Scholar, Cross Ref
Asongu, S. A., Efobi, U., & Tchamyou, V. S. (2018). Globalisation and governance in Africa: A critical contribution to the empirics. International Journal of Development Issues, 17(1), 2-27.
Indexed at, Google Scholar, Cross Ref
Asongu, S., & Odhiambo, N. M. (2020). Financial access, governance and insurance sector development in Sub-Saharan Africa. Journal of Economic Studies, 47(4), 849-875.
Indexed at, Google Scholar, Cross Ref
Badea, L., Panait, I., Socol, A., & Moraru, A. D. (2018). Sentiment, perception and policy determinants of foreign direct investment to European developing countries. Economic Computation & Economic Cybernetics Studies & Research, 52(2).
Indexed at , Google Scholar, Cross Ref
Bah, M., Ondoa, H. A., & Kpognon, K. D. (2021). Effects of governance quality on exports in Sub-Saharan Africa. International Economics, 167, 1-14.
Indexed at, Google Scholar, Cross Ref
Bajit, E. (2021). Does governance explain the variation in growth of the regional comprehensive economic partnership bloc countries? An Econometric Analysis.
Bakar, M. A. A. A., Palil, M. R., & Maelah, Ruhanita. (2021). Governance quality and tax compliance behavior in East Malaysia. Asian Journal of Accounting and Governance, 15, 1-14.
Indexed at, Google Scholar, Cross Ref
Bakhsh, A., Mahmood, Z., & Mahmood, A. B. (2019). An international investigation of the institutional factors driving sustainability assurance. Journal of Business and Social Review in Emerging Economies, 5(2), 367-378.
Indexed at, Google Scholar, Cross Ref
Bouchoucha, N., & Benammou, S. (2020). Does institutional quality matter foreign direct investment? Evidence from African countries. Journal of the Knowledge Economy, 11, 390-404.
Indexed at, Google Scholar, Cross Ref
Case, A., & Deaton, A. (2020). Deaths of despair and the future of capitalism. Princeton University Press.
Indexed at, Google Scholar, Cross Ref
Cheng, H., Flores, G., Singh, S., & Posthuma, R. (2018). Employment discrimination laws: A country level analysis of voice and accountability. International Journal of Law and Management, 60(6), 1286-1298.
Combey, A. (2017). Economic growth and political institutions in the WAEMU: What do we know?. European Journal of Business and Management, 9(2).
Das, R. C., & Chatterjee, A. (2023). Depression rate, GDP growth rate, health expenditure, and voice and accountability: Are there co-movements?. In Research Anthology on Macroeconomics and the Achievement of Global Stability (pp. 1831-1847). IGI Global.
Indexed at, Google Scholar, Cross Ref
De Bruin, A., Agyemang, A., & Chowdhury, M. I. H. (2020). New insights on suicide: Uncertainty and political conditions. Applied Economics Letters, 27(17), 1424-1429.
Indexed at, Google Scholar, Cross Ref
Dotun-Olujinmi, O., Johnson, J. A., Greenhill, R. G., Wuenstel, W., & Adedeji, O. (2022). Contextual factors in premature non-communicable disease mortality in selected African countries within the sustainable development goals framework: The implication of voice and accountability. Journal of Public Health in Africa, 13(2).
Indexed at, Google Scholar, Cross Ref
Durkiewicz, J., & Janowski, T. (2018). Is digitalization improving governance quality? Correlating analog and digital benchmarks. In Proceedings of the 18th European Conference on Digital Government ECDG (pp. 48-56).
Fedosov, V., & Paientko, T., (2018). Government financial accountability: Key problems and main trends in post-communist countries. Zeszyty Teoretyczne Rachunkowosci. 99 (155):25-39.
Indexed at, Google Scholar, Cross Ref
Folayan, M. O., El Tantawi, M., Vukovic, A., Schroth, R. J., Alade, M., Mohebbi, S. Z., & Global Early Childhood Caries Research Group. (2020). Governance, maternal well-being and early childhood caries in 3–5-year-old children. BMC Oral Health, 20, 1-8.
Indexed at, Google Scholar, Cross Ref
Fukuyama, F. (2006). The end of history and the last man. Simon and Schuster.
Indexed at, Google Scholar, Cross Ref
Grafitanti, I. D., & Ubed, R. S. (2022). Macroeconomics indicator, institutional quality, and public private partnership: A case of Indonesia. Jurnal Manajemen Teori dan Terapan, 15(2).
Indexed at, Google Scholar, Cross Ref
Ifinedo, P., Anwar, A., & Cho, D. (2021). Using panel data analysis to uncover drivers of e-participation progress: A global insight and regional perspectives. Journal of Global Information Management, 29(3), 212-235.
Indexed at, Google Scholar, Cross Ref
Jadhav, P. (2012). Determinants of foreign direct investment in BRICS economies: Analysis of economic, institutional and political factor. Procedia-Social and Behavioral Sciences, 37, 5-14.
Indexed at, Google Scholar, Cross Ref
Kantamaturapoj, K., Kulthanmanusorn, A., Witthayapipopsakul, W., Viriyathorn, S., Patcharanarumol, W., Kanchanachitra, C., ... & Tangcharoensathien, V. (2020). Legislating for public accountability in universal health coverage, Thailand. Bulletin of the World Health Organization, 98(2), 117.
Indexed at, Google Scholar, Cross Ref
Khan, H., Weili, L., & Khan, I. (2022). The role of financial development and institutional quality in environmental sustainability: panel data evidence from the BRI countries. Environmental Science and Pollution Research, 29(55), 83624-83635.
Indexed at, Google Scholar, Cross Ref
Kumaran, V. V., Song, P. W., Mohamed, Z. Z., Lim, T. K., Mei, K. Y., Yong, K. T., & Chew, F. C. (2020). Efficiency analysis of China’s outward foreign direct investment in ASEAN countries. International Journal of Disaster Recovery and Business Continuity, 11(1), 871-884.
Kunawotor, M. E., Bokpin, G. A., & Barnor, C. (2020). Drivers of income inequality in Africa: Does institutional quality matter?. African Development Review, 32(4), 718-729.
Indexed at, Google Scholar, Cross Ref
Lakshmanasamy, T. (2022). Corruption, Institutions and Economic Growth: An Econometric Analysis. Indian Journal of Global Economics and Business, 1(3752), 1.
Matsui, T., & Perez, D. (2022). Data-driven analysis of central bank digital currency (CBDC) projects drivers. In The International Conference on Mathematical Research for Blockchain Economy (pp. 95-108). Cham: Springer International Publishing.
Indexed at, Google Scholar, Cross Ref
May, J. W., Pyle, W., & Sommers, P. M. (2002). Does governance explain unofficial activity?. Applied Economics Letters, 9(8), 537-539.
Indexed at, Google Scholar, Cross Ref
Modugu, K. P., & Dempere, J. (2020). Country-level governance quality and stock market performance of GCC countries. Journal of Asian Finance, Economics, and Business, 7(8), 185-195.
Indexed at, Google Scholar, Cross Ref
Nadeem, M. A., Jiao, Z., Nawaz, K., & Younis, A. (2020). Impacts of voice and accountability upon innovation in pakistan: evidence from ARDL and Maki Cointegration approaches. Mathematical Problems in Engineering, 2020, 1-18.
Indexed at, Google Scholar, Cross Ref
Nagasivam, A., Fryatt, R., de Habich, M., & Johns, B. (2022). Exploring the relationship between national governance indicators and speed of initial government response to COVID-19 in low-and middle-income countries. Public Health in Practice, 4, 100309.
Indexed at, Google Scholar, Cross Ref
Ofori, I. K., & Asongu, S. (2021). Foreign direct investment, governance and inclusive growth in sub-Saharan Africa. Governance and Inclusive Growth in Sub-Saharan Africa.
Indexed at, Google Scholar, Cross Ref
Olabiyi, K. A., & Olowookere, J. K. (2021). Determinants of Economic Development in Nigeria: How Much Does Governance Matter?. Management Analysis Journal, 10(3), 295-304.
Quak, E. J. (2019). Taxation and accountability: how to improve the state-citizen social contract through taxation.
Sabir, S., Rafique, A., & Abbas, K. (2019). Institutions and FDI: evidence from developed and developing countries. Financial Innovation, 5(1), 1-20.
Indexed at, Google Scholar, Cross Ref
Saddique, A., Ashfaq, Z., & Ahmad, J (2020). Do good governance and Terrorism Distract economic growth?
Saengchai, S., Mitprasat, M., & Horakul, P. (2020). Judging quality of education from social paradigm in Asia: effect of civil liberties, regulatory quality and voice and accountability. Journal of Security and Sustainability Issues, 9(J), 240-251.
Indexed at, Google Scholar, Cross Ref
Sasikirono, N., Kusuma, R. D., & Meidiaswati, H. (2023). Country Governance and Financial Leverage with Institutional Ownership as Moderating Variables. Riset Akuntansi dan Keuangan Indonesia, 7(2), 139-165.
Indexed at, Google Scholar, Cross Ref
Shan, S., Lin, Z., Li, Y., & Zeng, Y. (2018). Attracting Chinese FDI in Africa: The role of natural resources, market size and institutional quality. Critical perspectives on international business, 14(2/3), 139-153.
Indexed at, Google Scholar, Cross Ref
Spiteri, J., & Briguglio, M. (2018). Does good governance foster trust in government? An empirical analysis. In Governance and regulations’ contemporary issues (Vol. 99, pp. 121-137). Emerald Publishing Limited.
Indexed at, Google Scholar, Cross Ref
Waheduzzaman, W., & Khandaker, S. (2022). E-participation for combating corruption, increasing voice and accountability, and developing government effectiveness: A cross-country data analysis. Australian Journal of Public Administration, 81(4), 549-568.
Indexed at, Google Scholar, Cross Ref
Wang, L., Luo X., & Jurkat, M. P.(2020). Understanding inconsistent corruption control through e-government participation: Updated evidence from a cross-country investigation. In Electronic Commerce Research, 2020, pp. 1-28.
Indexed at, Google Scholar, Cross Ref
Zhuo, Z., O, A. S. M., Muhammad, B., & Khan, S. (2021). Underlying the relationship between governance and economic growth in developed countries. Journal of the Knowledge Economy, 12, 1314-1330.
Indexed at, Google Scholar, Cross Ref
Zvezdanovic Lobanova, J., Lobanov, M., & Zvezdanovic, M. (2021). Governance and civil and political rights as FDI determinants in transition countries. Zbornik radova Ekonomskog fakulteta u Rijeci: casopis za ekonomsku teoriju i praksu, 39(1), 59-86.
Indexed at, Google Scholar, Cross Ref
Received: 22-Nov-2023 Manuscript No.AAFSJ-23-14201; Editor assigned: 24-Nov-2023, PreQC No. AAFSJ-23-14201(PQ); Reviewed: 06-Dec-2023, QC No. AAFSJ-23-14201; Revised: 11-Dec-2023, Manuscript No. AAFSJ-23-14201(R); Published:19-Dec- 2023