Research Article: 2021 Vol: 25 Issue: 4
The Integrative Relationship Between Traditional and Modern Performance Measures: An Applied Study on Commercial Banks Listed in Amman Stock Exchange
Mohammed Jamal AlZou’bi, Sunchon Al-Balqa Applied University
Laith Faris Abu KHader, Arab International Bureau for Auditing
Emad Yousif Ahmed, The World Islamic Science & Education University
Ammar Daher Bashatweh, Jadara University
Abstract
The research aims to explain the integrative relationship between modern performance measures and the traditional performance measures of Jordanian banks listed in the ASE. The study sample consisted of 13 commercial banks for the period 2013 - 2018. The financial statements of these banks were used during the study period to extract the necessary data for our study. In this study the main measures of the traditional performance (ROA, ROE, ROI, EPS), and the main measures of the modern performance (EVA, MVA, SVA, TSR). The study showed a statistically significant relationship between the Traditional Performance Measures (TPM) and the modern performance measures (MPM) among the commercial banks listed in the ASE, where the researchers believe that such a relationship enhances the integration of the metrics and the two measures(modern and traditional) provides information that helps investors to predict the bank's future performance. The study recommended the need for Jordanian banks to disclose the modern measure ratios in financial statements to provide a clear knowledge to the users of accounting information on the performance of banks.
Keywords
Modern Performance measures, Traditional Performance measures, Commercial Banks, Economic Value Added, Market Value Added, Total Shareholder Returns, Shareholder Value Added.
Introduction
There are a number of sectors working in Jordan, including industry, services, and finance. But the banking sector is the most important sector since the economy of the country depends upon this. The banking sector is the main component of the financial sector with assets of 52 billion JDS at the end of 2018 with total assets equaled 161.90% of GDP at the end of 2018. (Central bank of Jordan, 2018).Commercial banks are considered one of the most important financial and economic institutions given the fact that their financial and banking relationship is intertwined with all the other economic institutions and their various sizes and kind of customers benefiting from their services. Maintaining the continuity of the banks and their abilities to face the surrounding threats does not depend only on good preparation and planning for the operating processes. Such processes must be accompanied by a continuous examination to implement and adopt the processes and procedures for achieving the goals for achieving the desired results. This is known as the performance follow up evaluation. The performance evaluation received great attention from most analysts, researchers, and administrators to improve the performance and develop performance measurement tools that are consistent with the conditions in the surrounding environment, believes that the performance evaluation has great importance to all parties benefiting from the economic facilities. (bashatweh & Ahmed, 2020).
Given the varied scales required for measuring the financial performance and the existence of critical trends around the traditional performance indicators as they do not measure the performance of the economic profit, failure to reverse the real value due to its dependence on estimates, and influence on many used methods of accounting, there was a near consensus on the need to review the traditional measures to overcome their defects (Shah & Sengupta, 2015).
Performance information needs to be integrated, affordable and visible to help rapid decision-making (Ahmed 2017). Integrated performance measurement is important to help companies in achieving an aim. It is a vital business process that critically allows businesses to operate economically and efficiently. Integrated performance measurement is described here as a quantitative measure reflecting all related features of corporate performance and importance and integrating with strategic goals and activities (Phornlaphatrachakorn & Peemanee, 2020).
The current study examines the integrative relationship between the traditional performance measures and the modern performance measures in the commercial banks listed in the ASE during the period 2013-2018.
This study provides high importance to the management of banks, investors, and all the beneficiaries are given the importance of integrating many scales that seem separate but overlapping and integrated into their content. Such integration might affect the performance of banks in the long and short term and that the crystallization of the nature of the relationship between the traditional performance measures and the modern performance measures may be useful for those interested in assessing the performance of the commercial banks and their share prices.
The structure of this paper is as follows: Section 2 reviews the relevant literature about traditional and modern performance measures. Section 3 shows the methodology and measurements of the variables. Section 4 presents data analysis and results and section 5 concludes the paper.
Theoretical Framework
The traditional performance measures were used by investors and departments for making and directing their investment decisions and evaluating the performance. These include the return on assets, return on equity, return on investment, and earning per share. However, the rapid developments in the business field and the changing trends into what is known as the concept of creating value, maximizing the wealth of owners or shareholders, and criticisms directed at traditional performance measures contributed to the emergence of performance measures developed by consulting corporations such as Stern Stewart & Co. (al-Sheikh 2012). This included the failure of the traditional performance measures to evaluate the performance of corporations in matters related to value creation, productivity increase, maximizing wealth to shareholders and owners, removing assets of poor quality, and focusing on short-term profit, as opposed to the economic model and bias related to applying the generally accepted accounting principles that do not reflect the economic realities. An example of this bias is (non-recognition of the Unrealized profits while Unrealized losses are recognized in line with the Conservatism Principle, as well as the scale of the value of the historical assets rather than the market values). Therefore, such measurements might indicate data not reflecting the actual reality of the bank's performance. The emergence of modern performance measures has therefore contributed to addressing such variance (Burksaitiene 2009). The researchers emphasize the importance of the integration of traditional and modern performance measures believe in the importance of linking investment decisions based on traditional and modern accounting performance measures being a complement to avoid distortions resulted from relying solely on traditional metrics, to achieve economic profit, it is necessary to make adjustments to the accounting profit to remove the accounting profit distortions and show the economic profit, which represents the bank's real profit.
The integration between the traditional performance measures and the modern performance measures can be demonstrated by in Figure 1:
Rate of Return on Assets
If you use the rate of return on assets that reflect the ability of the bank's assets to generate revenue (bashatweh & Ahmed, 2020), it is considered beneficial in case banks are from the same sector that the higher the rate of return on the assets, the greater the performance of managers in terms of ability to invest the banks' assets efficiently. However, let's suppose that the bank rewards the management for the return on assets. This means that the higher such rate the higher the reward. However, there are some cases in which the use of the rate of return on assets in evaluation has a negative impact in terms of motivating managers to work efficiently and towards achieving a value for investors. for example, if the value of a project for the rate of return on assets is 100% which becomes 50% in case a decision of increasing the investment is made, we will notice from comparing the value of the return on assets before the increase and the value after the increase in the investment that the value of the rate of return on assets will be reduced by 75% (150÷ 200). This increase in investment has reduced the rate of return on assets and thus the reward of the manager will decrease to 25% (100%-75%) contributing to discouraging the manager to manage this increase in investment. Thus, he will try to prevent it since it affects his reward despite that this investment might benefit the bank. However, in the case of using the economic add value, the increase in this investment will tell the manager that his reward will increase unlike the return on assets. Moreover, if the manager knows that his reward is linked to the added value, he will approve the project. Accordingly, the add value scale shows that the financial return for a great section is greater than the financial return for a smaller section. To understand this, we can present it in the following equation. (Roman & ?argu, 2013; Al-Janabi & Mohammed, 2014; Bashatweh & Almomani, 2020).
return on assets × total capital = net income after tax
Therefore:
Economic add value = net income after tax - (average weighted capital cost × total capital).
From the above, we can say that the added economic value can be seen as income after the capital costs. On the contrary, we find that the accounting trends offer several costs to reach the profit shown in the financial statements but the cost of capital is not subtracted (al-Janabi & Mohammed, 2014; Al-Awawdeh & Al-Sakin, 2018)
EVA is one method of financial performance measurement-based on valuation (value-based) which measures the difference in financial terms between the return on company capital and the cost of capital. This is similar to the calculation of profits in conventional accounting, except with one significant exception, EVA calculates the cost of all capital (Masyiyan & Isynuwardhana, 2020)
Rate of Return on Equity
As for the return on equity, which reflects the ratio of the net profit after tax to total equity, the cost of capital is not taken into account, and the ratio is a general financial performance indicator being used it reveals the firm's capability to create profits on stockholders funds (Al-Awawdeh & Al-Sakin, 2018).
Increasing the return on equity is a positive indicator regardless of the capital structure, especially if a large proportion of it is financed by borrowing. Therefore, the cost of investment becomes higher. Through the capital structure model, which used different levels of capital costs starting from (0% to 80%) of the net assets, the return on equity increases by using a larger debt while the added economic value is higher at an average level of long-term debt. Therefore, when the cost of capital is low, the company's value is high (al-Janabi & Mohammed, 2014). Therefore, the researchers consider the need to use the return on equity with one of the modern measures that take into account the capital cost such as the measure of added economic value.
Rate of Return on Investment
The rate of return on investment is one of the standards used in measuring financial performance, and measurement of the efficiency of the firm's in utilizing capital, but in cases such as the addition of new investment may give a deficiency in the performance evaluation process. This will result in an incorrect decision where in some cases there is a desire to increase investment in an existing project, the value of the rate of return on the investment becomes low as a result of entering into this investment. This shows that entering into this investment contributes to reducing the rate of return on investment as it did not take into account the increase or the decrease in the capital invested. However, if the decision is made by the added economic value measure, the result will show the opposite where it turns out that entering or investing in this opportunity contributes to increasing the added value. Therefore, we think that it is better to resort to the measure of the added economic value to decide either accepting or refusing the opportunity to increase investment. (Kabajeh et al. 2012; Al-Janabi & Mohammed, 2014).
Earnings Per Share
The earning per share is expressed through the percentage of Profit / (loss) attributable to ordinary shareholders to the weighted average number of ordinary shares (IAS,33), and thus it depends on the net profit after tax prepared by generally accepted accounting principles and based on the criticism directed at the accounting profit that it does not express. The real performance of the bank, and adjustments to the net income that contribute to reflecting the real profit of the bank help to reflect the share of the real profits of the bank, and the economic value-added measure adds a great explanatory power to the profit per share (Maditions et al. 2006).
Research Methodology
Population and Sampling of Study
The study population consisted 15 banks listed in Amman stock exchange. And the sample of this study consist of 13 commercial banks listed in ASE during 2013–2018. The financial statements issued at the end of each year for each bank were relied upon to extract the necessary data for our study. The main reason for selecting listed banks is largely due to the availability and reliability of their financial statements, which can be used to collect data and the banking sector developing countries depend in their economies on this sector.
| Table 1 Sample | ||
| Bank's name | Symbol | Source |
| JORDAN KUWAIT BANK | J O K B | ASE(2020) |
| JORDAN COMMERCIAL BANK | J C B K | |
| THE HOUSING BANK FOR TRADE AND FINANCE | T H B K | |
| ARAB JORDAN INVESTMENT BANK | A J I B | |
| BANK AL ETIHAD | U B S I | |
| ARAB BANKING CORPORATION /(JORDAN) | A B C O | |
| INVEST BANK | I N V B | |
| CAPITAL BANK OF JORDAN | E X F B | |
| SOCIETE GENERALE DE BANQUE - JORDANIE | S G B J | |
| CAIRO AMMAN BANK | C A B K | |
| BANK OF JORDAN | B O J X | |
| JORDAN AHLI BANK | A H L I | |
| ARAB BANK | A R B K | |
| Source: Authors’ elaboration | ||
Data Collection
This study uses two sources of collection data: secondary and primary data: The primary data based on financial statements, and the secondary data based on articles, books, and Previous Studies.
Measurements of the Variables
Traditional Performance Measures (TPM): (Roman & ?argu, 2013; Bashatweh, & Almomani, 2020; IAS, 33; Kabajeh et al., 2012).
ROA = Net Income after Tax / Total Assets
ROE= Net Income after Tax / Total Equity
ROI = Net Income after Tax / Total Investment
EPS = Profit (loss) attributable to ordinary shareholders / weighted average number of ordinary shares
Modern Performance Measures (MPM): (Fernandez 2001; Al-Awawdeh & Al-Sakin, 2018; Al-bahri 2014).
Economic value added (EVA) = NOPAT – (Capital Invested × Cost of Capital)
Market value added (MVA) = Market Value Equity – Book Value Equity
Shareholder value added (SVA) = Shareholder Value addedt+1 – Shareholder Value Addedt
Shareholder Value Addedt = Corporate Value – Debt
Total shareholder returns (TSR) = 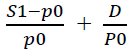
S1: Sales Stock Price Ending Period
P0: Purchase Stock Price Beginning Period
D: Dividend Retained Earning
Data Analysis and Results
Descriptive Statistics
This study presents in Table 2 below the Descriptive Analysis of Jordanian commercial banks during 2013 -2018.
| Table 2 Descriptive Analysis | ||||
| Variables | Mean | St. D | Max. Value | Min. Value |
| ROE | 8.87 | 2.91 | 15.44 | 1.83 |
| ROA | 1.21 | 0.46 | 2.05 | 0.05 |
| ROI | 1.4 | 0.568 | 2.639 | 0.256 |
| EPS | 0.21 | 0.13 | 0.67 | 0.02 |
| EVA | 32,931,396 | 62,328,423 | 357,833,177 | -2,591,933 |
| MVA | 117,107,784 | 39,826,682 | 1,610,355,816 | -155,561,809 |
| SVA | -120,300,151 | 326,138,952 | 1,508,567,000 | -1,698,563,000 |
| TSR | 0.03 | 0.15 | 0.36 | -0.51 |
| Source: Authors’ elaboration. | ||||
Based on the table above:
1. A relative convergence in equity returns on commercial banks listed in the ASE is evident for the period (2013-2018). This indicates a convergence of the management of the Jordanian commercial banks in operating and investing the shareholders' funds to generate and grow profits.
2. There is a relative convergence of return on assets in the commercial banks listed in the ASE during the period (2013-2018) which indicates a convergence among the Jordanian commercial banks in the operational performance of assets to generate returns and profits.
3. There was a relative convergence in return on investment in the commercial banks listed in the ASE during the period (2013-2018), which indicates the convergence of profits achieved by the commercial banks listed in the ASE from their investment activities and operations. The reason for this convergence is the similar banking activities and operations offered by the commercial banks.
4. There was a variance in the profitability per share of the commercial banks listed in the ASE during the period (2013-2018), which indicates different investment decisions taken by bank managements to generate profit on the stock.
5. There was a great variance in the added economic value of the commercial banks listed in the ASE during the period (2013-2018), which indicates the different ability of the commercial banks to generate returns and achieve sufficient profits to cover the invested capital. This may be attributed to the different performance of the management of the Jordanian commercial banks in managing their assets, exploiting the investment opportunities available, and reducing the capital cost.
6. There was a significant variance in the added market value of the commercial banks listed in the ASE during the period (2013-2018), which indicates the different ability of the commercial banks to generate value for shareholders, which may be due to the different efficiency in increasing the market value compared to the value of the invested capital among banks.
7. There was a significant variance in the added value of the shareholders in the commercial banks listed in the ASE during the period (2013-2018), which indicates the different efficiency of commercial banks in the ability to achieve the goal of shareholders in generating value on their invested funds as shares. The value is added to the shareholders when the economic cash flows exceed the cost of capital required to produce the operating profits. It is expressed in the positive value while the negative value is used when the add value scale of the shareholders recognize the risks compensation faced by the shareholders. The bank's incompetence in achieving this means that the bank is not allocating and making optimal use of capital leading to its inability to achieve the shareholders' goal of maximizing the value of their funds invested in the form of shares.
8. There is a difference in the rate of return of the shareholder in the commercial banks listed in the ASE during the period (2013-2018). This might mean the difference in the policies of the banks in distributing profits. The rate of the total return is represented by the rate of the market return obtained by the shareholder, and this is a measure for the decisions taken by the management such as dividends, stock buybacks, acquisitions, changes in the financial structure, or expansion. This measure is influenced by factors affecting the financial market.
Testing the Relationship between TPM and MPM
To test the relationship, the correlation between the traditional measures and the modern measures of performance was recalculated to assert the complementary relationship between the TPM and the MPM, which were previously illustrated in the theoretical framework the results were represented as follows:
Table 3 indicates a significant relationship between TPM and MPM. It shows that:
| Table 3 Statistical Test | |||||
| EPS | ROI | ROA | ROE | Variables | |
| 0.755 | 0.235 | 0.138 | 0.086 | Correlations T value Sig (T)* |
EVA |
| 10.046 | 2.109 | 1.218 | 5.364 | ||
| 0 | 0.038 | 0.227 | 0 | ||
| 0.514 | 0.242 | 0.2 | 0.233 | Correlations T value Sig (T)* |
MVA |
| 5.219 | 2.17 | 1.782 | 2.086 | ||
| 0 | 0.033 | 0.079 | 0.04 | ||
| -0.272 | -0.135 | -130 | -0.137 | Correlations T value Sig (T)* |
SVA |
| -2.463 | -1.186 | -1.146 | -1.207 | ||
| 0.016 | 0.239 | 0.255 | 0.231 | ||
| 0.214 | 0.44 | 0.479 | 0.427 | Correlations T value Sig (T)* |
TSR |
| 1.911 | 4.273 | 4.758 | 4.114 | ||
| 0.06 | 0 | 0 | 0 | ||
| Source: Authors’ elaboration | |||||
1. The positive significant relationship between the added economic value and all the traditional performance measures has emerged, except for the return on assets.
2. The positive significant relationship between the added market value and all the traditional performance measures has emerged, except for the return on assets.
3. The significant negative relationship between the value-added of the shareholders and the profitability of the share was evident while it did not appear in the rest of the traditional performance measures.
4. The positive significant relationship between the shareholder's total return rate and all the traditional performance measures was evident except for the earnings per share.
The following table represents the relationship between the TPM and the MPM as shown by the results of the statistical test.
Conclusion
This study aims to demonstrate the Integrative relationship between modern performance measures and the traditional performance measures in the Jordanian commercial banks listed in the ASE during the period 2014-2018. The financial statements of these banks were used during the study period to extract the necessary data for our study. The study concluded that there is no relationship between the economic value-added and the return on assets and this is attributed to the fact that the rate of the return on assets does not take into account the cost of the invested capital. The table also shows that there is no relationship between the added market value and the return on assets because the rate of the return on assets is an internal measure for the bank while the added market value is an external measure showing the bank's vulnerability to the market factors, although it shows a relationship between the added market value and the return on rights and the return on investment. Still, they are internal measures. By reference to the basis of the added market value, it represents the difference between the market value of the property rights and the book value of the property rights and therefore they share their components and composition. The findings also conclude that there is no relationship between the added value of the shareholders and the total rate of the return of the shareholder with the profitability of the single share since the last does not take into account the distribution of profits to shareholders, the market value of the debt and the property rights. The study also showed a statistically significant relationship between the traditional performance measures and the modern performance measures among the commercial banks listed in the ASE, where the researchers believe that such a relationship enhances the integration of the metrics and since the two measures provide information that helps investors to predict the bank's future performance, and thus maximize the wealth, the two measures are expected to be linked to each other.
This result was consistent with (al-bahri, 2017), which found that the added economic value was associated with the added market value of the facility and that the added economic value contained an additional interpretive power compared to the traditional accounting measures. It was also consistent with (Abu Wadi & al-Hait, 2016), which found a statistically significant correlation between the rate of the return on equity and the added market value of the Jordanian banks, as well as between the added economic value and the added market value. The study was also consistent with (al-Janabi & Mohammed, 2014), which found a weak correlation between the added economic value and the return on assets, the return on equity, the return on investment, and the average annual return in addition to (Ahmed 2015), which found that the measure of the added economic value has a positive relationship with the market value of the shares compared to the profitability measure per share and finally with (Muraleetharan 2014), which found a positive relationship between the added economic value and the added market value, and that the added market value is highly influenced by the added economic value.
The findings demonstrate that performance is the Key to achieving the objectives of the banks and increasing their capacity to succeed, expand and continue to grow in the light of the internal and external circumstances that affect them. As a result, investors are looking for the best companies to disclose performance-related factors for review before investing in any of the stocks.
The dataset used in the analysis is limited to Jordanian commercial banks listed on the ASE for the period 2013 to 2018. Future research can employ another sample. The study recommended the need for Jordanian banks to disclose the modern measure ratios in financial statements to provide a clear knowledge to the users of accounting information on the performance of banks.
References
- Abu Wadi, R., & Saqfalhait, N. (2016). Economic Added Value as a Complementary Tool to Evaluate the Performance of the Jordanian Commercial Banks. An-Najah University Journal for Research-B (Humanities), 30(12), 7.
- Ahmed, H. (2015). Impact of firms earnings and economic value added on the market share value: An empirical study on the Islamic banks in Bangladesh. Global Journal of Management and Business Research, 15(2), 1-4.
- Ahmed, O. (2017). Integrated performance measurement system. Science. Business. Society., 2(3), 125-128.
- Al-Awawdeh, H.A. (2018). The Impact of Economic Value Added, Market Value Added and Traditional Accounting Measures on Shareholders¡ Value: Evidence from Jordanian Commercial Banks. International Journal of Economics and Finance, 10(10), 1-40.
- Al-bahri., H. (2014). Evaluate performance measures from a shareholder value creation perspective. Revue Des Sciences Humaines, 25(4), 89-105.
- Al-bahri, H. (2017). The relationship between economic value added (EVA) and Traditional accounting measures with Market value added (MVA) in CAC40 listed companies. Revue Des Sciences Humaines, 28(4), 17-30.
- Al-Janabi, A.M., & Mohammed Y.N. (2014). A reflection of the integration of accounting income and economic value added on the decisions of investors. Journal of Economics and Administrative Sciences, 20(75), 467-499.
- Al-Sheikh, I.Y. (2012). Comparative study on the effect of using traditional measures of economic value added on the stock price. Arab Journal of Administrative Sciences, 19(2).
- Bashatweh, A.D., & Ahmed, E.Y. (2020). Financial Performance Evaluation of the commercial banks in Jordan: Based on the CAMELS Framework. International Journal of Advanced Science and Technology, 29(05), 985-994.
- Bashatweh, A.D., & AlMomani, S.N. (2020). The Effect of Accounting Disclosure about Sustainability Reports on the Ability of Banks to Going Concern-Case Study of Arab Bank. Business and Economic Research, 10(2), 234-249.
- Burksaitiene, D. (2009). Measurement of value creation: Economic value added and net present value. Economics and Management, (14), 709-714.
- Central Bank of Jordan (2018). Financial Stability Report. http://www.cbj.gov.jo/EchoBusv3.0/SystemAssets/PDFs/EN/JFSR2018E%20-20-10-2019.pdf.
- Fernandez, P. (2001). EVA, economic profit and cash value added do not measure shareholder value creation. Fecha de publicación, 22.
- Kabajeh, M.A.M., Al Nu’aimat, S.M.A., & Dahmash, F.N. (2012). The relationship between the ROA, ROE and ROI ratios with Jordanian insurance public companies market share prices. International Journal of Humanities and Social Science, 2(11), 115-120.
- Maditinos, D., Sevic, Z., & Theriou, N. (2006, December). A Review of the Empirical Literature on Earnings and Economic Value Added (EVA) in Explaining Stock Market Returns. Which Performance Measure Is More Value Relevant in the Athens Stock Exchange (ASE)?. In Annual Conference of the Hellenic Finance and Accounting Association Thessaloniki, 15-16.
- Masyiyan, R.A., & Isynuwardhana, D. (2020). Analysis of Financial Performance with Economic Value Added (EVA) Method, Market Value Added (MVA), And Financial Value Added (FVA). JASa (Jurnal Akuntansi, Audit dan Sistem Informasi Akuntansi), 4(1), 116-125.
- Muraleetharan, M.P., & Kosalathevi, T. (2014). Impact of Economic Value Added on Market Value Added: Special Reference to Selected Private Banks in Sri Lanka. European Journal of Business and Management, 6(7), 92-97.
- Phornlaphatrachakorn, K., & Peemanee, J. (2020). Integrated performance measurement as a strategic management accounting approach: A case of beverage businesses in Thailand. The Journal of Asian Finance, Economics, and Business, 7(8), 247-257.
- Roman, A., & ?argu, A.C. (2013). Analysing the financial soundness of the commercial banks in Romania: an approach based on the camels framework. Procedia economics and finance, 6, 703-712.
- Shah, A., & Sengupta, S. (2015). A Study on Financial Performance and Valuation Metrics: Application of EVA, MVA, CVA and TSR Techniques. In Twelfth AIMS International Conference on Management, 538-546.