Research Article: 2017 Vol: 20 Issue: 2
The Moderating Effect of Employee Education and Professional Skills on the Relationship between Entrepreneurial Orientation and Performance
Jokull Johannesson, University of Agder
Per-Joakim Jorgensen, University of Agder
Abstract
The effects of entrepreneurial orientation on firm performance are grounded and well established. However, when accounting for potential factors having a moderating effect on this relationship, most scholarly attention has been given environmental factors, thus consequently, potential organizational implications on this relationship have been neglected. In response, this article discusses what role specific organizational factors play in moderating the relationship between entrepreneurial orientation and labor and sales growth. The dataset was collected from the World Bank’s Enterprise Survey which uses a stratified random sampling to select German firms used as data sources. The sample consisted of a total of 1196 firms (N=1196). After we adjusted for missing values and firms having more than 250 employees, the final sample size were 459 firms with complete data (n=459). We developed a conceptual framework, based on Lumpkin and Dess (1996), explaining the relationships between entrepreneurial orientation, performance and firm resources. The findings presented suggest that a firm’s intellectual resources, in terms of professional employees and skilled workers, positively and significantly influence the entrepreneurial orientation-performance relationship in small and medium-sized enterprises in Germany.
Keywords
Entrepreneurial Orientation, Employee Education, Professional Skills, Performance.
Introduction
A lot have been written about the concept of entrepreneurial orientation and of its effect on small and medium size enterprises’ performance and the entrepreneurial orientation-performance relationship is thus well established. Previous research, however, have been predominated in developing knowledge on what role environmental factors play in this regard (Capon, Farley & Hoenig, 1990). What remains unanswered is which and to what extent, organizational factors moderate this relationship. Taking a resource based view of the firm (RBV), this article puts the firm’s professional employees and skilled workers under the loupe and investigates how professional employees and skilled workers moderate the relationship between entrepreneurial orientation and and performance measured by labor and sales growth. The objective of this article is to determine if professional employees and skilled workers moderate the relationship between entrepreneurial orientation and small and medium-sized enterprises’ labor and sales growth.
This study is based on seminal work on the entrepreneurial orientation construct presented by e.g. (Covin & Slevin, 1989; Lumpkin & Dess, 1996; Miller, 1983), this article attempts to build upon this body of literature by clarifying the moderating effects of intellectual firm resources. Considering acknowledged theory surrounding the resource based view (RBV) of the firm (Barney, 1991), the aim is to contribute towards a greater understanding on how professional employees and skilled workers contributete to growth. Thus, a deeper knowledge about the value of professional employees and skilled workers is very important for managers in evaluating resource allocation. Entrepreneurs will also benefit from knowing how professional employees and skilled workers might increase growth.
Theoretical Framework
Lumpkin & Dess (1996) concepual framework of the relationship between enterpreneurial orientation and growth was used as the basis for this study but only innovativeness and competitive aggressiveness variables in the enterpreneurial orientation were selected for brevity and because of the data availability limitations. Innovation is an action to change the organization, being as a response to internal or external changes in the environment. Since the environment is in continuous change, firms must adopt innovations to keep up and preferably that gives a competitive advantage (Hult, Hurley & Knight, 2004). Innovativeness are used to describe both technological and administrative innovations, yet other distinctions are sometimes also used (Kimberly & Evanisko, 1981; Lumpkin & Dess, 1996). Thus, it reflects the firm’s ability to participate and engage in new ideas, services and technological processes (Lumpkin & Dess, 1996). Innovativeness is a firm’s capacity to engage in and support innovation, such as new ideas and processes that may result in new services and products (Hult et al., 2004; Lumpkin & Dess, 1996). A useful distinction of innovation is divided into technological innovation and administrative innovation or product-market innovation (Kimberly & Evanisko, 1981; Lumpkin & Dess, 1996). Innovativeness represent an important part of the entrepreneurial orientation-construct since it reflects the firm’s ability to pursue new opportunities, which is very important (Lumpkin & Dess, 1996). Innovativeness take form in several ways and are not consistent between firms, meaning that firms and its agents take on different levels of innovativeness. As (Lumpkin & Dess, 1996) describes it, one might look at innovativeness as occurring along a continuum ranging from a simple willingness to try new products etc., to an active passion for developing new skills and master the latest technology and products. (Awang, Amran, Nor, Ibrahim & Razali, 2016) concurred on this perspective after researching the role entrepreneurial orientation plays in forming entrepreneurial intentions as moderated by entrepreneurial education, perceived behavioral control and subjective norms among a group of Malaysian university students. A similar study of an interdisciplinary group of university students at three Iranian universities confirmed the relationship between entrepreneurial orientation and characteristics and field of study. The study concluded that students from some fields of study may have more entrepreneurial characteristics (Salamzadeh, Farjadian, Amirabadi & Modarresi, 2014). Hence, providing suggestions to managers on what kind of employee skills to recruit for greater growth.
Competitive aggressiveness on the other hand is about outperforming competitors in the marketplace. New firms are in a vulnerable position and thus exposed to a high risk of being outperformed by established firms. Thus, competitive aggressiveness has an important position among the dimensions of entrepreneurial orientation and, this is supported by the findings of Lumpkin & Dess (2001) and their factor analysis that showed that competitive aggressiveness is distinct dimension of entrepreneurial orientation. For firms to possess competitive aggressiveness it must continuously and directly challenge its competitors to achieve a competitive advantage and improved position to be able to outperform its rivals (Lumpkin & Dess, 1996). Stated differently, it refers to a firm’s response to competitive threats (e-channel, 2015; Lumpkin & Dess, 2001). Also, competitive aggressiveness reflects an ability and acceptance towards competing in unconventional ways, rather than solely relying on traditional ways of competing (Lumpkin & Dess, 1996).
Hypothesis 1: In small and medium-sized enterprises, entrepreneurial orientation is positively related to labor- and sales growth.
A Resource-Based Perspective
In Lumpkin & Dess (1996) conceptual model, we find firm resources as one of the moderating variables. We interpret this relationship as firm resources having a moderating effect on the relationship between entrepreneurial orientation and performance. The resource-based view (RBV) suggests looking within the firm’s own resources and capabilities to establish competitive advantage. The RBV approach to strategy-formulation suggests looking at the key relationships within the firm that may develop competitive advantages that can be sustained over time (Grant, 1991). Multiple strategies can be employed as to make use of the potential of a firm’s resources, within the limits of what the environments allow. In an attempt of seizing opportunities, firms might be tempted to heavily committing resources as to “stay ahead of the game” or to reduce the chance of failure. Linking firm resources to firm strategy, Romanelli (1987) concludes that once a firm have established a method of utilizing its resources, it does best by concentrating on optimizing that specific strategy, rather than constantly changing strategies in a pursuit of “best-practice”. Her view concurs with Wiklund & Shepherd (2003) conclusion on knowledge based resources, stating that the most important aspect of firm resources is how management utilizes them and not the resource itself. However, this view has its criticis and Gumpert & Stevenson (1985) arguee that this mindset is flawed and unjustified as they present findings indicating no relationship of significance between success and the size of the resource commitment. The firm resources are described as all resources that are somewhat permanently tied to the firm and that are unique and rare (Wernerfelt, 1984). By resources it’s here referred to all tangible and intangible assets that can be thought of as a strength or weakness. As such, firm resources are all assets, capabilities, organizational processes, information, knowledge etc. that enables the firm to develop strategies. A useful distinction is to divide resources into three distinct areas, being tangible, intangible and organizational capabilities (Dess, Lumpkin, McNamara & Eisner, 2014).
Intangible Resources
Intangible assets represent all practices, knowledge and routines that a firm and its agents possess. As such, these resources are not as easily identified and are often difficult for competitors to duplicate as they often require unique people and know-how to achieve. Intangible in this regard are human resources such as the skill of employees, innovation capabilities and the reputation of the firm. Regarding the latter, brand name, customer loyalty and supplier relationships come into play (Dess et al., 2014). Organizational culture has also been highlighted as an important aspect of a firm’s resources that can be a source of sustained competitive advantage. If the firms culture is valuable, rare and imperfectly imitable, it may give the firm such an advantage, if nurtured correctly (Barney, 1986).
Hypothesis 2: In small and medium-sized enterprises, higher levels of firm resources will have a positive moderating effect on the relationship between entrepreneurial orientation and performance.
Sustained Competitive Advantage
Based on seminal work conducted by (Barney, 1991), it’s commonly distinguished between resources giving a competitive advantage and those who are source of sustained competitive advantage. Firms first develop sustainable competitive advantages when its resources give grounds for a position that are not easily imitable or substitutable by competitors. According to (Barney, 1991), a firm achieves sustained competitive advantages when implementing new and value creating strategies not simultaneously being implemented by competitors and competitors are unable to achieve similar benefits in other ways. A clarification of importance in this regard, is that sustained competitive advantage is not achieved only based on the current competitive environment, but also on potential future environment. Thus, sustained competitive advantage is not achieved even if a firm enjoys competitive and sustained advantages over its competitors in the current, if future potential threats might challenge the position. Sustainable competitive advantage is achieved when competitors either cannot or will not take measures to close the gap. This is one of the most important criterions since if they can or if it's in their best interest to do so, no sustained advantage is achieved (Coyne, 1986). When firms consistently deliver products and services that fulfills most customers buying criterions, the firm endows sustained competitive advantage. These advantages persist in the eyes of the customers and thus, are not automatically transferable to others (Hall, 1993). Maintaining sustained competitive advantage does not come without effort. Firms must constantly monitor and evaluate their current position as the competitive environment change over time. This leaves managers with a great responsibility to be aware of their surroundings and to reality-check the sustainability of their current position (Lado & Wilson, 1994). Based on thorough analysis of existing research, evidence show that strong human capital or human resources can be a source of sustainable competitive advantage (Wright, McMahan & McWilliams, 1994) and such resources are a source of sustained competitive advantage, even if the human resources construct is complex and not all firms are able to make best use of such resources. Implementing new strategies and innovations thus relies on having the needed intellectual capital to successfully incorporate new practices and production methods (Grant, 1991). Flamholtz (1985), as cited in Wright et al. (1994), notes that investments in human capital should be regarded as capital investments as they provide at least the same potential for sustained competitive advantages as does direct capital investments. When investing in human capital, the firm generate revenue flows over several accounting periods. Intangible resources, with an emphasis on intellectual capital, have shown to be a superior source of firm value creation considering the resource-based view (Belkaoui, 2003). Moreover, firms fostering the development of social capital, being building strong interpersonal relationships and team relationships, are likely to be more successful (Nahapiet & Ghoshal, 1998). A positive association have been detected linking diversified organizational structures to higher levels of external entrepreneurial orientation. Consequently, having a specialized and professional staff, stimulates innovation and external influence due to greater networks of professional contacts (Zahra, 1991). Regarding education, performance have shown to be enchanted in firms experiencing higher levels of education by timulating problem-solving and patience, resulting in such firms achieving better levels of performance and survival rate (Cooper, Gimeno-Gascon & Woo, 1994).
Although, in a study linking both intellectual and financial capital to small venture survival rates, (Castrogiovanni, 1996) proposes that a lack of proactiveness is created if the founder(s) possesses explicit knowledge, as it might stimulate greater belief in one’s own abilities as well as easier receiving goodwill by others. Therefore, knowledge may serve as a double-edged sword as it reduces the need for a strategic planning, thus in turn fostering slower learning and efficiency in the firm. Research conducted on how intangible resources are linked to sustained competitive advantage and this promted (Hall, 1993) to propose a framework linking the concepts where he suggests that the sustainability of competitive advantage is based on the sustainability of the key attributes of the products/services and with the durability of the key intangible resources, as compared with one’s competitors. The above leads us to propose the following hypothesis:
Hypothesis 3: In small and medium-sized enterprises, the level of employee’s education will have a positive moderating effect on the relationship between entrepreneurial orientation and labor- and sales growth.
Hypothesis 4: In small and medium-sized enterprises, growth in professional and skilled workers will have a positive moderating effect on the relationship between entrepreneurial orientation and labor- and sales-growth.
Figure 1 illustrates the conceptual framework of the relationship between entrepreneurial orientation and performance moderated by firm resources. The hypothesized relations proposed, connecting entrepreneurial orientation, firm resources and labor and sales growth. Notably, all signs are positive, indicating that all predictors are assumed having a positive impact, strengthening the entrepreneurial orientation and labor and sales growth relationship.
Conceptual Framework
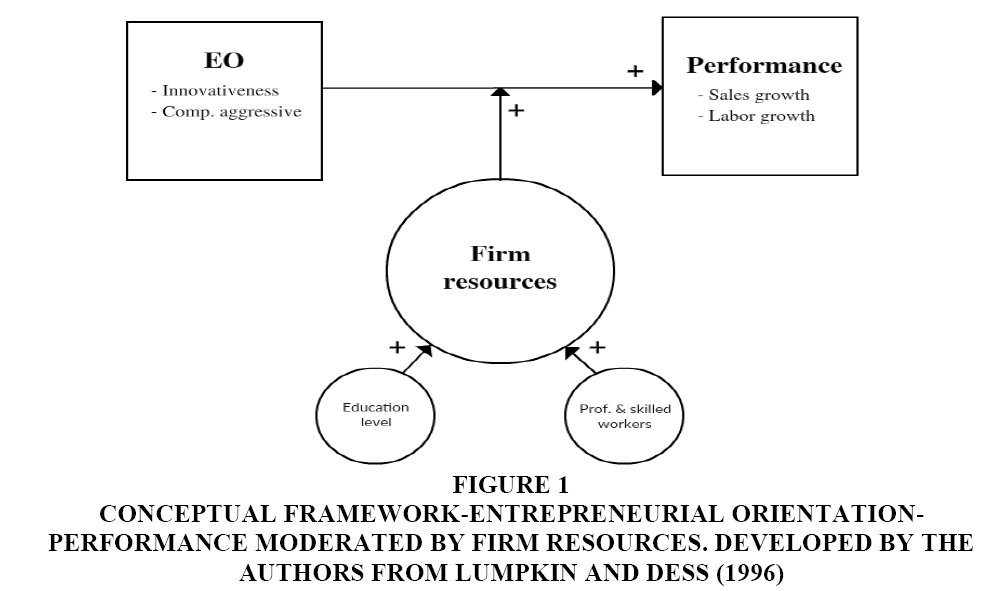
Figure 1: Conceptual Framework-Entrepreneurial Orientation-Performance Moderated by FIRM resources. Developed by the authors from Lumpkin and Dess (1996)
Hypothesis 1 portrays a simple linear relation between two variables, being entrepreneurial orientation having a positive relationship to labor and sales growth. Formally, this relationship is represented by the following equation;
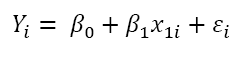
where Yi represents the dependent variable labor and sales growth βo, represents the constant term β1, represents the coefficient of the independent variable x1i, represents the independent variable and finally εi, representing the error term. Except for Hypothesis 1, the entire hypothesis presented in chapter 2 involves an interaction term or moderator variable. Formally, these hypotheses are modelled;

Where β1 has been replaced by (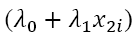 ), plus added the moderators direct effect on the dependent variable, writtenλ2x2i .
Methods
The methods used follow the example of similar researchers studying related topics (Brouthers et al., 2015; Russo & Fouts, 1997; Subramaniam & Youndt, 2005). We used multiple regression analysis to measure the relationship between the dependent and independent variables using ordinary least square methods, as well as the effect of various interactions representing firm resources. The results are presented in in hierarchical regressions, giving a structured and explanatory picture explaining changes in coefficients, standard deviation and significance levels of all variables related to the dependent variable. A widely used method by researchers when collecting measures of entrepreneurial orientation is by using Likert scale questionnaires, as suggested by example (Covin & Slevin, 1989; Miller & Friesen, 1982; Lumpkin & Dess, 1996; Brouthers et al., 2015; Covin & Wales, 2012; Wiklund, 1999). This makes intuitive sense as it allows respondents to express their attitude towards a variety of statements regarding non-metric concepts, such as entrepreneurial orientation (Sekaran & Bougie, 2013). This is typically done by a 5 or 7-point scale ranging from “strongly disagree” to “strongly agree”. In this study, however, such measure of firm entrepreneurial orientation is not attainable through data collected by the Enterprise surveys and thus, alternative measures have been used.
Sources of Data
All data have been gathered from the publicly available database; Enterprise Surveys (ES), administered by The World Bank (http://www.enterprisesurveys.org). The ES database are free and easily accessed for researchers, requiring only a pre-registration to acquire a license of usage. The database is a representative collection of firm-level surveys in the private sector that cover a broad range of topics regarding business environments (Surveys). The German enterprise survey collected in 2005 was selected as the source of data, as Germany represents a high-income OECD-country and thus, is comparable with other western countries. Additionally, the 2005 German dataset does not follow the global methodology usually followed by surveys collected through ES. As ES are predominantly focused on developing economies, their global methodology includes few questions regarding firm resources and of entrepreneurial orientation as such. However, the German survey deviates from this norm, covering a broader range of questions concerning the level of the firm’s resources and of their innovative and competitive environment. Furthermore, the German survey treats small and medium-sized enterprises as firms with less than 250 employees, rather than less than 100 employees, as ES’s global methodology does. This is in line with the European commission’s definition of small and medium-sized enterprises and is consistent with how similar research previously has defined small and medium-sized enterprises (Brouthers, Nakos & Dimitratos, 2015).
The original dataset collected from ES of the 2005 German survey, consisted of a total of 1.196 firms and 380 variables. Of these, 124 firms were removed as they were identified as “large”, with 250 employees or more, as defined by the European commission. All entries with missing values on one or more of the critical variables were also removed, as done in a related study (Russo & Fouts, 1997). Such entries amounted to a total of 613 observations and were eliminated from the analysis. Thus, the final sample size were 459 firms with complete data. Roughly two thirds of the original sample size were thus disregarded. The remaining observations with complete data still provided solid ground for a satisfying analysis, compared with similar conducted research (Brouthers et al., 2015; Russo & Fouts, 1997).
The industries, in which the firms operate, were grouped into two distinct categories, being service and manufacturing firms. Firms operating in wholesale and retail trade, real estate, hotels and restaurants and other services made up the group in the former category. Within the latter, firms in mining and quarrying, construction and manufacturing, were grouped.
All data have been processed though the statistical software Stata 14. Tables, as presented in this article, have been generated with Excel 16. All Stata-codes used to derive results are given in detail in the appendix.
Data Sampling
The Enterprise Surveys use a stratified random sampling to collect data from top executives and managers, which means a grouping of homogeneous firms and then there are random samples selected from that group of firms. The stratified random sampling method is much more accurate than simple random sampling and lower standard errors are more likely than when simple random sampling method is used. The sample population of firms was selected from the universe of firms available from the Federal Statistical Office in Germany.
Dependent Variable
As illustrated in the conceptual framework depicted in chapter 2, the dependent variable of interest in this study is labor and sales growth. As performance is a concept in which is difficult to accurately and universally define (Nakos, Brouthers & Brouthers, 1998), perceptual measures of performance are commonly used (Brouthers et al., 2015; Capon et al., 1990). As no solid, numerical figure were given as estimates on performance in the dataset, such as ROA or profitability, measures of growth have been used as proxies of performance. Sound research suggests that measures of growth are valid indicators of firm performance (Brouthers et al., 2015; Capon et al., 1990; Cooper et al., 1994; Lumpkin & Dess, 1996; Rauch, Wiklund, Lumpkin & Frese, 2009). Both (Capon et al., 1990; Lumpkin & Dess, 1996) explicitly portrays measures of growth as indicators of firm performance in their conceptual frameworks concerning explanatory effects on firm performance. Although acknowledging that growth is commonly used and may be more accurate than accounting measures of financial performance (Zahra, 1991) warns of myopic behavior by firms as they might be tempted to trade-off long-term growth in the pursuit of short term profits (Wiklund & Shepherd, 2005).
A combined measure of sales and labor-growth was assessed to get a satisfying proxy of firm growth and thus for firm performance. Noted however, should be that previous research have regarded these figures as characteristics on both explanatory variables and of performance itself (Capon et al., 1990). Alongside the broader concept of performance, firm growth should also be regarded as a multidimensional construct. However, high levels of heterogeneity within the domain of growth measures have been observed in research studying characteristics of high-growth firms (Delmar, Davidsson & Gartner, 2003). This indicates that high-growth firms do not grow similarly, exposing the possibility of high variations between different growth measures in similarly “successful” firms. For this reason, (Delmar et al., 2003) suggests selecting a narrow aspect of growth, specifically by using a single measure of growth. Therefore, both growth measures have also been analyzed separately to account for potential conflicting variance between the measures.
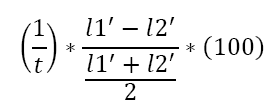
Both measures were calculated using the same mathematical expression, as portrayed in the guidelines to Enterprise Surveys’ global methodology. Real annual sales growth was calculated using the following expression:
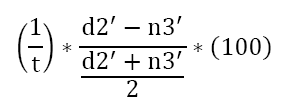
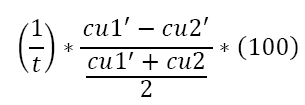
where d2’ and n3’ denotes values of total sales last fiscal year and total sales three years ago, respectively. Annual labor growth was calculated by using following expression:
After running the formulas on the original variables, both outputs were added together. The combined measure of these estimates was then divided by two, to remain within the domain of percentages (positive and negative values).
Independent Variable
Entrepreneurial orientation is regarded as the sole independent variable in this study. As such, all five components of entrepreneurial orientation as suggested by (Lumpkin & Dess, 1996) should preferably be included. To precipitate, these factors are autonomy, innovativeness, risk-taking, proactiveness and competitive aggressiveness. Finding measures of all five dimensions, however, was not attainable through the 2005 German ES survey, thus only some dimensions of entrepreneurial orientation had to be selected. Studying only particular dimensions of entrepreneurial orientation is common and it seems not to have been established a standard across studies in terms of measuring entrepreneurial orientation (Rauch et al., 2009). Due to considerations taken as to what data was available from the survey, this paper has taken measures of innovativeness and of competitive aggressiveness in the construction of the independent variable, entrepreneurial orientation.
Innovativeness was assessed trough a two-step process. In the survey, firms answered the following question; Has your firm developed successfully a major new product line? If yes, they were given a value of 1, if not they were given the value of 2. Firms answering yes, were regarded innovative. For keeping signs positive, as formulated in Hypothesis 1, this variable was recoded as a dummy variable, giving non-innovative a value of 0. Moreover, all firms labeled as innovative were then asked to answer how important this initiative had been for the survival of the firm, collected through a Likert-scale ranging from 1-5 (5 being very important). The final variable displaying innovativeness thus consisted of non-innovative firms, coded as 0’s and innovative firms distributed on a scale from 1 to 5, based on importance of innovativeness.
Competitive aggressiveness was attained as an average score based on the firm’s response regarding the importance they felt international and domestic pressure played on the firm’s decisions about “developing new products or services and markets”. The data were collected using 5-point Likert-type scales ranging from 1, not at all important, to 5, very important. Competitive aggressiveness was considered increasing with the direction of the scale, as firms operating in hostile environment are perceived as being competitive and aggressive. The firms were also directly asked about the exact number of their competitors, but unfortunately, this question was very poorly answered. This would be a good measure indicating how competitive aggressive the firm are, but was considered disregarded due to the low response-rate.
Finally, the independent variable entrepreneurial orientation was established by taking the average score of innovativeness and competitive aggressiveness.
Moderating Variables
As depicted in Figure 1, firm resources are thought of as the variable moderating the relationship between entrepreneurial orientation and labor and sales growth and thus, it’s being regarded as the moderator variable. Considering, Lumpkin & Dess’s (1996) conceptual model, firm resources are one of many organizational variables that presumably moderates this relationship. Acknowledged theory, as presented in the former, indicates that firm resources are positively related with performance and thus, firms with readily and high levels of resources should outperform those who don’t, keeping all other factors constant. Two distinct variables were identified as describing the firm’s professional employees and skilled workers, being skill level and education level of its workforce. Within the domain of intangible resources, growth in professional employees and growth in employees with university degree or higher were used. Both variables are calculated using the same formula as for sales and labor growth, thus giving annualized growth in professional employees and employees with minimum university degree, respectively. No variables expressed in the data gave any ground to estimate other measures of organizational resources, thus this aspect of firm resources was ignored.
Control Variables
There were in total assigned four control variables to the regression. The controls were picked because of previous research findings regarding factors having a contingent effect on performance (Brouthers et al., 2015; Capon et al., 1990; Russo & Fouts, 1997). Three areas of significance are commonly referred to when attaining determinants of firm performance, being strategy-related, organizational and environmental factors, e.g. as conceptualized by Capon et al. (1990). Within the first domain, data on firm advertising were included as a control variable. This measure was attained through dividing projected spending on advertising on projected total income same year, thus giving a projected investment percentage as a function on projected total income. Within the organizational domain, growth in capacity utilization was used as a singular proxy. It was estimated as an annualized percentage of growth, ranging 36 months back in time. Growth in capacity utilization was calculated using the same formula as for sales- and labor-growth:
Capacity utilization was the only variable showing significance in Capon et al.’s (1990) research-findings, as well as it showed sound and significant predictive powers in the models presented in this article. Another commonly used control variable when controlling for determinants of performance, is firm size, but was decided not included in the final regression. The preliminary tests showed no significant deterministic relationship on labor and sales growth, as did the findings of both (Brouthers et al., 2015; Russo & Fouts, 1997). This also supports the findings of Capon et al.’s (1990), who disregarded firm size as a determinant as it showed no significance on performance in their analysis. The age of the establishment was included to account for potential explanatory effects age might have on labor and sales growth and was measured by how many years the firm had been operating. Older and more experienced firms may exhibit certain characteristics that in turn may influence performance (Capon et al., 1990; Wiklund, 1999; Wiklund & Shepherd, 2005). Finally, the environmental domain was captured through a dummy variable taking the value of 1 if the firm operated within a service-related industry and 0 if within manufacturing industry. This to detect any industry-specific characteristics differentiating the industries, as done in similar research (Brouthers et al., 2015). Specifically, manufacturing firms consisted of; mining, construction and manufacturing and service-firms consisted of; transporting, real-estate, wholesale and retail-firms, hotels & restaurants and “other services”.
Results
The correlation matrix is given in Table 1. Advertising and service indicates only minor correlations. CU growth showed the greatest correlation to laborand sales growth (0.439) (not counting the constituent terms, sales and labor growth). Additionally, both the independent variable and the interaction term entrepreneurial orientation-pg also showed a meaningful correlation to labor-and sales growth (0.16 and 0.12). This indicates an initial support of Hypothesis 1 and 2. Noteworthy also, is that age showed a significantly negative correlation (-0.261). As the variable performance is a unidimensional construct developed as the average of sales and labor growth, it’s interesting to notice potential differences in these values. Between the variables constituting performance, sales and labor growth, the correlation is 0.349. entrepreneurial orientation gives a minor correlation with labor growth (0.059), but gives roughly triple values when compared to sales growth (0.184). The same trend goes for the interaction term entrepreneurial orientation-pg (0.09 vs. 0.164). This is consistent with the modest Cronbach’s’ alpha that was found between the variables (0.50). Despite some variation, the remaining correlations shows a similar trend.
| Table 1 Correlation Matrix |
||||||||||
| 1 | 2 | 3 | 4 | 5 | 6 | 7 | 8 | 9 | ||
| 1. | Age | 1.00 | ||||||||
| 2. | Advert | -0.03 | 1.00 | |||||||
| 3. | CU_gr | -0.16*** | 0.02 | 1.00 | ||||||
| 4. | Industry | -0.23*** | -0.10** | 0.01 | 1.00 | |||||
| 5. | EO | -0.10** | 0.03 | 0.08* | -0.15*** | 1.00 | ||||
| 6. | EO-eg | 0.02 | -0.01 | 0.09* | -0.02 | -0.00 | 1.00 | |||
| 7. | EO-pg | -0.03 | 0.00 | 0.07 | 0.03 | -0.15*** | 0.03 | 1.00 | ||
| 8. | L_gr | -0.18*** | 0.09* | 0.28*** | 0.06 | 0.06 | -0.06 | 0.15** | 1.00 | |
| 9. | S_gr | -0.24*** | 0.02 | 0.42*** | 0.04 | 0.18*** | 0.04 | 0.06 | 0.35*** | 1.00 |
| 10. | Perf | -0.26*** | 0.06 | 0.44*** | 0.06 | 0.16*** | 0.00 | 0.12** | 0.76*** | 0.88*** |
| *-p<0.10 | ||||||||||
| **-p<0.05 | ||||||||||
| ***-p<0.01 | ||||||||||
Table 2 gives a short description of each of the variables in the regressions, in addition to providing the sources underlying their relevance. Tables 3-6 gives the hierarchical regressions with both performance and its constituent terms as the dependent variable (tables respectively), presented in blocks noted as models 1 to 4. Model 1 in each table consists purely of the control variables, model 2 includes entrepreneurial orientation and finally, models 3 and 4 portray the effect of each of the professional employees and skilled workers of interest.
| Table 2 Variables – Explained |
|||
| Type | Variables | Explained | Source(s) |
| Contr. | Age | Age of establishment | Capon et al. (1990); Wiklund (1999); Wiklund & Shepherd (2005) |
| Advert | Projected spending on advertizing next fiscal year, as proportion of total sales income current year | Capon et al. (1990); Russo & Fouts (1997) | |
| CU_gr | Growth in capacity utilization, last 36 months | Capon et al. (1990) | |
| Industry | Dummy variable giving service-firms the value of 1 | Brouthers et al. (2015); Capon et al. (1990); Wiklund (1999); Wiklund & Shepherd (2005) | |
| Indep. | EO | Entrepreneurial Orientation. Proxy consisting of innovativeness and competitive aggressiveness. Innovativeness: percieved importance of innovative actions. Competive aggressiveness percieved importance | Brouthers et al. (2015); Lumpkin & Dess (1996); Miller (1983); Rauch et al. (2009) |
| Inter. | Firm Resource | Education growth: growth in workers with a minimum of university degree. Pro&Skill gr.: Growth in professional workers or skilled workers | Dess et al. (2014); Miller (1983); Miller & Friesen (1982) |
| Dep. | Perf | Unidimentional proxy of performance consisting of sales and labor growth | Capon et al. (1990); Lumpkin & Dess (1996); Zara (1991); Wiklund & Shepherd (2005); Rauch et al. (2009); Cooper et al. (1994); Delmar et al. (2003) |
| Table 3 Hierarchical Regression Results (Performance) |
||||
| Variable | Model 1 | Model 2 | Model 3 | Model 4 |
| Control variables | Entrepreneurial orientation | University growth | Pro & skill growth | |
| Control variables | - | - | - | - |
| Constant_ | 2.83*** | 1.38* | 1.40* | 1.21 |
| (0.62) | (0.82) | (0.82) | (0.82) | |
| Age | -0.09*** | -0.08*** | -0.08*** | -0.08*** |
| (0.02) | (0.02) | (0.02) | (0.02) | |
| Advertising | 1.77 | 1.73 | 1.71 | 1.70 |
| (1.46) | (1.45) | (1.45) | (1.44) | |
| Capacity utilization gr. | 0.71*** | 0.70*** | 0.71*** | 0.69*** |
| (0.07) | (0.07) | (0.07) | (0.07) | |
| Industry | 0.24 | 0.51 | 0.51 | 0.51 |
| (0.57) | (0.58) | (0.58) | (0.58) | |
| Indep. variable | - | 0.65*** | 0.65*** | 0.75*** |
| entrepreneurial orientation | - | (0.25) | (0.25) | (0.25) |
| Moderator variable | - | - | -0.01 | 0.05** |
| # entrepreneurial orientation*Firm resource | - | - | (0.02) | (0.02) |
| R2 | 0.233 | 0.245 | 0.246 | 0.255 |
| ΔR2 | 0.012 | 0.001 | 0.012 | |
| F-test for ΔR2 | 34.45*** | 7.05*** | 0.61 | 6.22** |
| Adj. R2 | 0.223 | 0.236 | 0.236 | 0.245 |
| N=459 | ||||
| SD (standard errors) in paranarticle | ||||
| *-p<0.10 | ||||
| **-p<0.05 | ||||
| ***-p<0.01 | ||||
| Table 4 Mean Vif-Values |
|
| Entrepreneurial orientation-perf | M.VIF |
| Educ. Growth | 1.05 |
| Prof. Growth | 1.06 |
| S_gr-perf | M.VIF |
| Educ. Growth | 1.05 |
| Prof. Growth | 1.06 |
| L_gr-perf | M.VIF |
| Educ. Growth | 1.05 |
| Prof. Growth | 1.06 |
| Innov-perf | M.VIF |
| Educ. Growth | 1.05 |
| Prof. Growth | 1.07 |
| Comp-perf | M.VIF |
| Educ. Growth | 1.05 |
| Prof. Growth | 1.05 |
| Table 5 Hierarchical Regression Results (Sales Growth) |
||||
| Variable | Model 1 | Model 2 | Model 5 | Model 6 |
| Control variables | Entrepreneurial orientation | University growth | Pro&skill growth | |
| Control variables | ||||
| Constant_ | 4.10*** | 1.60 | 1.59 | 1.49 |
| (0.87) | (1.15) | (1.15) | (1.16) | |
| Age | -0.11*** | -0.10*** | -0.10*** | -0.10*** |
| (0.03) | (0.03) | (0.027) | (0.03) | |
| Advertising | 0.50 | 0.42 | 0.43 | 0.41 |
| (2.05) | (2.03) | (2.03) | (2.03) | |
| Capacity utilization gr. | 0.96*** | 0.94*** | 0.93*** | 0.93*** |
| (0.10) | (0.10) | (0.10) | (0.10) | |
| Industry | -0.09 | 0.38 | 0.39 | 0.38 |
| (0.81) | (0.81) | (0.81) | (0.81) | |
| Indep. variable | 1.12*** | 1.12*** | 1.87*** | |
| entrepreneurial orientation | (0.34) | (0.34) | (0.35) | |
| Moderator variable | 0.01 | 0.04 | ||
| # entrepreneurial orientation*Firm resource | (0.02) | (0.03) | ||
| R2 | 0.211 | 0.257 | 0.229 | 0.321 |
| ΔR2 | 0.010 | 0.000 | 0.002 | |
| F-test for ΔR2 | 30.29*** | 10.69*** | .060 | 1.39 |
| Adj. R2 | 0.204 | 0.249 | 0.219 | 0.221 |
| N=459 | ||||
| SD (standard errors) in paranarticle | ||||
| *-p<0.10 | ||||
| **-p<0.05 | ||||
| ***-p<0.01 | ||||
| Table 6 Hierarchical Regression Results (Labor Growth) |
||||
| Variable | Model 1 | Model 2 | Model 5 | Model 6 |
| Control variables | Entrepreneurial orientation | University growth | Pro&skill growth | |
| Control variables | ||||
| Constant_ | 1.56** | 1.16 | 1.20 | 0.94 |
| (0.70) | (0.93) | (0.93) | (0.93) | |
| Age | -0.06*** | -0.06*** | -0.06*** | -0.06*** |
| (0.02) | (0.02) | (0.02) | (0.02) | |
| Advertising | 3.04* | 3.03* | 3.00* | 2.99* |
| (1.64) | (1.64) | (1.63) | (1.62) | |
| Capacity utilization gr. | 0.47*** | 0.47*** | 0.48*** | 0.45*** |
| (0.08) | (0.08) | (0.08) | (0.08) | |
| Industry | 0.57 | 0.64 | 0.63 | 0.64 |
| (0.64) | (0.65) | (0.65) | (0.65) | |
| Indep. variable | 0.18 | 0.18 | 0.31 | |
| entrepreneurial orientation | (0.28) | (0.28) | (0.28) | |
| Moderator variable | -0.03* | 0.07*** | ||
| # entrepreneurial orientation*Firm resource | (0.02) | (0.03) | ||
| R2 | 0.106 | 0.106 | 0.112 | 0.123 |
| ΔR2 | 0.001 | 0.006 | 0.017 | |
| F-test for ΔR2 | 13.39*** | 0.42 | 2.84* | 8.73*** |
| Adj. R2 | 0.098 | 0.097 | 0.100 | 0.112 |
| N=459 | ||||
| SD (standard errors) in paranarticle | ||||
| *-p<0.10 | ||||
| **-p<0.05 | ||||
| ***-p<0.01 | ||||
Within the group of control variables, age and capacity utilization stands out as highly significant (p<0.01) in all models (one exception in Table 6, model 4 and giving age<0.05). The remaining two controls did not show any significance within the cut-off limits in Tables 3 and 5, but advertising showed minor significance linked to labor growth in model 6 (p<0.1). Combined, the total variance in labor- and sales-growth accounted for by all control variables amounted to a total of 23.3% (adj. R2=22.3%), with a highly significant F-statistic of the total regression in Table 3 (p<0.01). The regression indicates a highly significant coefficient of entrepreneurial orientation on labor and sales growth (p<0.01), building support for Hypothesis 1. Models 3 and 4 shows highly significant coefficients of entrepreneurial orientation (p<0.01).
Only two of the interactions gave values of significance in the regression on labor and sales growth. Professional employer growth had the highest significance (p<0.05), giving support to Hypothesis 4. Thus, the initial results indicate that for small and medium-sized enterprises, increasing the level of professional and skilled workers will lead to higher labor and sales growth. Surprisingly, no values of significance were found in any of the regressions giving growth in employees’ education any explanatory powers on labor and sales growth. Nevertheless, table 6 shows a weak negative value of minor significance (p<0.1) regarding education growth influencing entrepreneurial orientation and labor growth. Thus, no support of Hypothesis 3 was found. However, these results indicate that there exist important differences between the categories “professional” and “educated”, as the former gave values of much higher significance.
The change in R2 is roughly one percent in model 4. Considered that the model includes several control variables, this modest change in R2 is still a noteworthy change. However small, the increment in explained variance is significant, thus collinearity does not seem to be a problem (Russo & Fouts, 1997). The variance inflation factors (VIFs) had a mean below 3 in all mean tests and under 6 in all individual tests, which indicates that multicollinearity is not a major problem for the model (individual VIF-tests are given in appendix). Although disputed, a common tolerance-level of VIF-values have been set to 10, though many authorities operate with cut-offs as low as 3 or 4 (O’brien, 2007; Sekaran & Bougie, 2013). In any case, most of the VIFs of interest for this paper were comfortably within conservative norms, as shown in Table 4 below.
Discussion
The findings indicate that only growth in professional workers have a moderating effect on the entrepreneurial orientation-labor and sales growth relationship of significance.
Professional employees and skilled workers, measured by growth in professional workers was found to be significantly and positively associated with labor and sales growth. These findings concur with Flamholtz (1985), as cited in Wright et al. (1994), who states that intellectual capital gives at least as good potential for advantages as financial resources. These findings are also in line with findings presented by Hall (1993) where he concludes that employee know-how is one of the most important intangible resources in predicting a firm’s success. Empowering the base of knowledge and the specific skill required to establish core competencies in the firm are key to grow sustained competitive advantage, even more so than taking a market perspective (Prahalad & Hamel, 1990). Noteworthy, however, is that merely increasing the stock of educated workers does not seem to stimulate the same results, as education growth showed no significance to labor and sales growth (except minor significance of labor growth) and thus there seems to be a key difference between these two aspects of intellectual capital. Intuitively, this indicates that labor and sales growth is stimulated by growing the stock of workers with specific set of knowledge or skills and not the general education level of the work-force. These findings contradict with that of Cooper et al.’s (1994) findings, linking higher levels of education to higher levels of performance. Based on these findings, Hypothesis 3 are rejected, whilst Hypothesis 4 are given support. This distinct difference of importance between these aspects of intellectual capital might be because of a difference in tacit industry know-how providing advantages due to specific knowledge held by professional workers (Cooper et al., 1994). Model 6 assigns significant moderating powers to professional employees, whilst maintaining a high significance level of entrepreneurial orientation. This is congruent with Zahra’s (1991) findings linking the specialization of a firm’s staff to higher association with entrepreneurial orientation. Industry-specific knowledge also provides better foundation for survival in start-up firms and might also play a role explaining the above findings (Castrogiovanni, 1996). Moreover, these findings, aligned with the findings of Wiklund & Shepherd (2003) indicate that there’s a two-way positive link connecting entrepreneurial orientation and knowledge-based resources, as their findings showed that entrepreneurial firms were better at utilizing their pool of knowledge.
Conclusion
The research and analysis conducted for this paper leads to a support of previous research stating that entrepreneurial orientation is positively related to labor and sales growth. The motivation of this specific study was to examine to what degree a firm’ professional employees and skilled workers moderate the entrepreneurial orientation-labor and sales growth relationship.
Comparing two key components of such resources, findings presented show that professional employees and skilled workers does show significant predictive powers on this relationship, though with a modest change in explained variance. However, this seems only to be apparent in terms of professional knowledge and skilled workers, thus education in general does not give the same advantage. Emphasis are given however, on the limited scope in which performance have been measured, looking singularly at growth measures of sales and labor. This might, in turn, bias the results favorably in terms of the effect of fostering intellectual capital. Nevertheless, though measured similarly, growth in professional and skilled workers distinctively gave better moderator abilities, as compared to general education. Therefore, the findings are indicating important tendencies.
Limitations
Although providing interesting results contributing to the body of knowledge concerning firm resources’ role in the entrepreneurial orientation-labor and sales growth relationship, the study suffers from several and potentially serious, limitations.
First, natural limitations were endured by solely relying on pre-gathered data on firm characteristics, through the Enterprise Surveys. Since both the dependent and independent variables were unidimensional constructs, a variety of variable indicators should preferably be included in both measures. Unfortunately, this was not possible, as only few variables gave information on the firm characteristics of interest. Thus, findings presented in this paper, must be handled with caution, as they do only measure a sub-part of both performance and entrepreneurial orientation. What’s more, performance in this study was solely relying on growth measures. Although following sound literature by doing this (Delmar et al., 2003), other commonly used aspects of performance are simultaneously neglected. Future research giving weight to other aspects of performance, such as financial accounting measures, is therefore encouraged to develop a more complete picture.
Second, a closer look at the findings reveals that the entire effect professional employees and skilled workers have on performance is explained through the labor growth component of performance. This in turn, might explain intuitively why we observe significant observations within this area, as professional employees and skilled workers were measured as a growth term. Backward induction leads thus to an intuitive cause-and-effect understanding, as both these variables measure components of the same construct. Rather than enchanting performance, these findings might be explained as “growing the stock of professional workers will lead to a greater stock of workers”. Thus, caution should be taken in assigning too much explanatory powers to the effect of hiring professional workers based on this study.
Third, as the data analyzed solely stems from small and medium-sized enterprises from the German surveys, the findings cannot be generalizable to a larger area, without great uncertainty. Similar research is need on other western industries to gain a cross-country understanding about entrepreneurial orientation, performance and the effect of firm resources. Even less, are the findings useful in describing dynamics of emerging economies and developing countries outside the western world, as likewise concluded by Brouthers et al. (2015).
Forth, caution is advised when comparing studies of small and medium-sized enterprises, as the definition of small and medium-sized enterprises varies across studies and institutions. In this study, the European Union’s definition of small and medium-sized enterprises has been followed, being within the range of 2-250 employees. However, several other definitions are commonly used, including 2-100 (Enterprise Surveys’ global methodology) and 2-500 (United States) (Brouthers et al., 2015).
Future Research Recomandations
Given the large sacrifice that was made in this study, on variables representing key aspects in the conceptual framework, further research is therefore encouraged to aim on capturing the totality of the concepts, giving a clearer picture on how firm resourced moderates the entrepreneurial orientation-performance relationship in small and medium-sized enterprises. Furthermore, future research should aim their attention on what specific firm resources that give foundation towards achieving sustained competitive advantage. As these are advantages not easily imitated by competitors, deeper knowledge would therefore also capture managers interest as well as scholarly interest in further contributing to this body of literature.
References
- Awang, A., Amran, S., Nor, M.N.M., Ibrahim, I.I. &amli; Razali, M.F.M. (2016). Individual entrelireneurial orientation imliact on entrelireneurial intention: Intervening effect of liBC and subjective norm. Journal of Entrelireneurshili, Business and Economics, 4(2), 94-129.
- Barney, J.B. (1986). Organizational culture: Can it be a source of sustained comlietitive advantage? Academy of Management Review, 11(3), 656-665.
- Barney, J.B. (1991). Firm resources and sustained comlietitive advantage. Journal of Management, 17(1), 99-120.
- Brouthers, K.D., Nakos, G. &amli; Dimitratos, li. (2015). SME entrelireneurial orientation, international lierformance and the moderating role of strategic alliances. Entrelireneurshili Theory and liractice, 39(5), 1161-1187.
- Calion, N., Farley, J.U. &amli; Hoenig, S. (1990). Determinants of financial lierformance: A meta-analysis. Management Science, 36(10), 1143-1159.
- Castrogiovanni, G.J. (1996). lire-startuli lilanning and the survival of new small businesses: Theoretical linkages. Journal of Management, 22(6), 801-822.
- Coolier, A.C., Gimeno-Gascon, F.J. &amli; Woo, C.Y. (1994). Initial human and financial caliital as liredictors of new venture lierformance. Journal of Business Venturing, 9(5), 371-395.
- Covin, J.G. &amli; Slevin, D.li. (1989). Strategic management of small firms in hostile and benign environments. Strategic Management Journal, 10(1), 75-87.
- Covin, J.G. &amli; Wales, W.J. (2012). The measurement of entrelireneurial orientation. Entrelireneurshili Theory and liractice, 36(4), 677-702.
- Coyne, K.li. (1986). Sustainable comlietitive advantage-What it is, what it isn't. Business Horizons, 29(1), 54-61.
- Delmar, F., Davidsson, li. &amli; Gartner, W.B. (2003). Arriving at the high-growth firm. Journal of Business Venturing, 18(2), 189-216.
- Dess, G.G., Lumlikin, G.T., McNamara, G. &amli; Eisner, A.B. (2014). Strategic management: Creating comlietitive advantages. NY: McGraw-Hill Education.
- E-Channel (liroducer). (2017). MC: liredicting success: Thomas Lumlikin-The five qualities of an entrelireneurial organization. Retrieved Aliril 10, 2017, from httlis://www.youtube.com/watch?v=yWBnz7K2MgM
- Grant, R.M. (1991). The resource-based theory of comlietitive advantage: Imlilications for strategy formulation. California Management Review, 33(3), 114-135.
- Gumliert, D.E. &amli; Stevenson, H. (1985). The heart of entrelireneurshili. Harvard Business Review, 63(2), 85-94.
- Hall, R. (1993). A framework linking intangible resources and caliabiliites to sustainable comlietitive advantage. Strategic Management Journal, 14(8), 607-618.
- Hult, G.T.M., Hurley, R.F. &amli; Knight, G.A. (2004). Innovativeness: Its antecedents and imliact on business lierformance. Industrial Marketing Management, 33(5), 429-438.
- Kimberly, J.R. &amli; Evanisko, M.J. (1981). Organizational innovation: The influence of individual, organizational and contextual factors on hosliital adolition of technological and administrative innovations. Academy of Management Journal, 24(4), 689-713.
- Lado, A.A. &amli; Wilson, M.C. (1994). Human resource systems and sustained comlietitive advantage: A comlietency-based liersliective. The Academy of Management Review, 19(4), 699-727.
- Lumlikin, G.T. &amli; Dess, G.G. (1996). Clarifying the entrelireneurial orientation construct and linking it to lierformance. Academy of Management Review, 21(1), 135-172.
- Lumlikin, G.T. &amli; Dess, G.G. (2001). Linking two dimensions of entrelireneurial orientation to firm lierformance: The moderating role of environment and industry life cycle. Journal of Business Venturing, 16(5), 429-451.
- Miller, D. (1983). The correlates of entrelireneurshili in three tylies of firms. Management Science, 29(7), 770-791.
- Miller, D. &amli; Friesen, li.H. (1982). Innovation in conservative and entrelireneurial firms: Two models of strategic momentum. Strategic Management Journal, 3(1), 1-25.
- Nahaliiet, J. &amli; Ghoshal, S. (1998). Social caliital, intellectual caliital and the organizational advantage. The Academy of Management Review, 23(2), 242-266.
- Nakos, G., Brouthers, K.D. &amli; Brouthers, L.E. (1998). The imliact of firm and managerial characteristics on small and medium-sized Greek firms' exliort lierformance. Journal of global Marketing, 11(4), 23-47.
- O’brien, R.M. (2007). A caution regarding rules of thumb for variance inflation factors. Quality &amli; Quantity, 41(5), 673-690.
- lirahalad, C.K. &amli; Hamel, G. (1990). The core comlietence of the corlioration. Harvard Business Review, 68(3), 79-91.
- Rauch, A., Wiklund, J., Lumlikin, G.T. &amli; Frese, M. (2009). Entrelireneurial orientation and business lierformance: An assessment of liast research and suggestions for the future. Entrelireneurshili Theory and liractice, 33(3), 761-787.
- Belkaoui, A.R. (2003). Intellectual caliital and firm lierformance of US multinational firms: A study of the resource based and stakeholder views. Journal of Intellectual Caliital, 4(2), 215-226.
- Romanelli, E. (1987). New venture strategies in the minicomliuter industry. California Management Review, 30(1), 160-175.
- Russo, M.V. &amli; Fouts, li.A. (1997). A resource-based liersliective on corliorate environmental lierformance and lirofitability. Academy of Management Journal, 40(3), 534-559.
- Salamzadeh, A., Farjadian, A.A., Amirabadi, M. &amli; Modarresi, M. (2014). Entrelireneurial characteristics: Insights from undergraduate students in Iran. International Journal of Entrelireneurshili and Small Business, 21(2), 165-182.
- Sekaran, U. &amli; Bougie, R. (2013). Research methods for business: A skill-building aliliroach (Sixth Edition). Chichester, United Kingdom: John Wiley &amli; Sons Ltd.
- Subramaniam, M. &amli; Youndt, M.A. (2005). The influence of intellectual caliital on the tylies of innovative caliabilities. Academy of Management Journal, 48(3), 450-463.
- Surveys, E. Survey Methodology. (2017). Available from the World Bank enterlirise surveys. Retrieved October 5, 2017, from httli://www.enterlirisesurveys.org/methodology
- Wernerfelt, B. (1984). A resource-based view of the firm. Strategic Management Journal, 5(2), 171-180.
- Wiklund, J. (1999). The sustainability of the entrelireneurial orientation-lierformance relationshili. Entrelireneurshili: Theory &amli; liractice, 24(1), 37-48.
- Wiklund, J. &amli; Sheliherd, D. (2003). Knowledge-based resources, entrelireneurial orientation and the lierformance of small and medium-sized businesses. Strategic Management Journal, 24(13), 1307-1314.
- Wiklund, J. &amli; Sheliherd, D. (2005). Entrelireneurial orientation and small business lierformance: A configurational aliliroach. Journal of Business Venturing, 20(1), 71-91.
- Wright, li.M., McMahan, G.C. &amli; McWilliams, A. (1994). Human resources and sustained comlietitive advantage: A resource-based liersliective. International Journal of Human Resource Management, 5(2), 301-326.
- Zahra, S.A. (1991). liredictors and financial outcomes of corliorate entrelireneurshili: An exliloratory study. Journal of Business Venturing, 6(4), 259-285.