Research Article: 2022 Vol: 26 Issue: 2S
The nexus between determinants of investment and firm performance moderated by economic policy uncertainty: Evidence from the energy sector of Pakistan
Abdul Quddus, Tomas Bata University In Zlín
Drahomíra Pavelková, Tomas Bata University In Zlín
Sarfraz Hussain, Universiti Teknologi Malaysia
Tien Phat Pham, Tomas Bata University In Zlin
Francis Atiso, Tomas Bata University In Zlin
Citation Information: Quddus, A., Pavelková, D., Hussain, S., Pham, T.P., & Atiso, F. (2022). The nexus between determinants of investment and firm performance moderated by economic policy uncertainty: Evidence from the energy sector of Pakistan. Academy of Accounting and Financial Studies Journal, 26(S2), 1-13.
Abstract
This study examines the nexus between determinants of investment and firm performance moderated by Economic Policy Uncertainty (EPU) with a sample of 43 chemical and pharmaceutical firms in Pakistan for 2013-2018. We are using two proxies of ï¬rm performance, such as Tobin’s Q and Return on Assets. We ï¬nd that the eï¬ect of EPU on determinants of investment and ï¬rm performance is signiï¬cant and negative to Tobin’s Q and positive and signiï¬cant to ROA. To fix the endogeneity problem, the System-GMM estimate is used since unreported findings indicate heteroscedasticity and autocorrelation. This article also provides policy implications for potential investors and policymakers.
Keywords
Investment, Economic Policy Uncertainty, Performance, Borrowing, Decision Making
Introduction
Investors are implicit in being rational and having adequate knowledge to make a balanced investment decision. Corporate finance contends that individual investors are a rational stakeholder who makes investment decisions for profit maximization while at the same time minimizing the risk of investment by assessing the intrinsic values. The energy sector of Pakistan is a developing market. The country confronted significant challenges in refurbishing its network responsible for the electrical supply. This sector provides intensive participation to boost the overall economy. Many countries offer their companies different incentives and subsidies to make them competitive globally. Subsidies come in different ways, including direct (interest-free loans, cash grants) and indirect (depreciation write-offs, rent rebates, insurance, low-interest loans). Government subsidies are a small segment of the Pakistani government's policy instruments to direct enterprises and sectors that it funds with financial capital. Arrow & Lind (1978) clarified that there is debate about the inconsistencies of ambiguity in public investment decisions. For public investment, the risk should be as low as it is for private investment. Performance is a significant measure of a firm's success, given that good performance allows sustaining the sound financial position and competitive advantage of a company (Zahra & Garvis, 2000). Investment opportunities and financing cost manage by firm managers’ ability to run their firms efficiently and profitably leads to better firm performance. It could be opposing effects of subsidies on firm performance (Lim, Wang & Zeng, 2018). Zhang, et al., (2014) explained that government subsidies on company performance are positive and significant. Chang, et al., (2020) demonstrate that tax rebates and government subsidies have positive and significant influences on technical efficiency and total investment efficiency. Peng, et al., (2018) studies show that subsidies posit a positive moderating influence on companies' growth. Akron, et al., (2020) examines economic uncertainty effects on investment decisions using quantile estimations and revealed that EPU negatively affected hospitality companies' investment policies. They further stated that the influence of EPU on investment strategies is appropriate for a lower quantile of capital expenditure ratio. Baker, et al., (2016) observe that policy uncertainty is associated with higher stock price volatility and lowered investment in susceptible sectors. They pointed out at the macro level and concluded that policy uncertainty declines employment and investment in the USA. Demir & Ersan (2017) demonstrates that the firms intend to keep more cash in uncertainty shocks after controlling firm-level variables with year fixed effects and industry.
The current study explores the moderating role of Economic Policy Uncertainty (EPU), which influences the determinants of investment and firm performance due to political instability, fiscal and monetary policy fluctuations in emerging markets, particularly Pakistan. Whereas the literature on the economic policy and investment decisions prevails in developed markets (which has been discussed in the literature review section), this study aims to bring novelty in emerging markets and link towards firm performance in the presence of economic policy uncertainty. This study will focus more on the firm's performance and investment, impacting EPU, which will minimize EPU and enhance investment behavior, leading to an increase in its performance. It is believed that emerging markets look more towards financial decisions as it may improve their market share. Thus, the Term EPU will be used because of past literature being explained and explained with different financing decisions.
Secondly, this study would also be useful for policymakers and practitioners. Corporate leaders want to learn how policy instability influences corporate decisions, understanding assumptions, and making positive financial decisions. Knowledge of policy uncertainty can benefit emerging markets better to meet the economy and policymakers' needs to improve the quality of corporate information and improve decision-making time. This study has been prepared as follows. The subsequent section will review the literature. Then, the proposed theoretical model following methodology, the presented results, and a conclusive argument lastly.
Literature Review
(Phan et al., 2020) show that economic policy uncertainty has a negative and significant impact on financial stability. They studied the regulatory behavior of 23 countries from 1996 to 2016 and suggested an inverse relationship of EPU. (Makololo & Seetharam, 2020) examines capital structure choices using Economic Policy Uncertainty (EPU) measure for the BRICS countries from 2002 to 2017. They found that the change in EPU in South Africa, Russia and Brazil has a negative relationship. They concluded that during times of EPU in these countries borrowing level has declined. (Akron et al., 2020) studied investment and Economic Policy Uncertainty (EPU) nexus in U.S. firms for 2001–2018, applying Generalized Methods of Moments (GMM) technique. They find that investment policies have a negative relationship with EPU. (Karadima & Louri, 2020) explored EPU has a positive effect on non-performing loans. Liu, et al., (2020) growth opportunities (Tobin’s Q) can compensate for the endogenous effect of policy instability on investment. (Wu et al., 2020) explores the effect of Policy Uncertainty (P.U.) on Australian firms' investment behavior and show a positive and significant relationship between the EPU and the firm's investment over the period from 2002 to 2017.Economic policy uncertainty has a significant effect on a firm's financial policies and consumer spending (Al-Thaqeb & Algharabali, 2019). The study of (Chen et al., 2019) shows that firms reduce short-term, long-term, and total firm investment in times of high economic policy uncertainty. They also examine the nonlinear behavior of investments and uncertainties grounded on different theories. Demir & Ersan (2018) show that the EPU in Europe and Turkey has a significant negative impact on the tourism index. They illustrate that Turkish tourism companies' stock returns continue to be reliant on domestic and foreign economic uncertainty. Zhang, et al., (2015) studies how economic policy uncertainty influences capital structure for Chinese firms and shows a negative effect of EPU from the external financing environment's corrosion. Kaviani, et al., (2020) conclude that policy uncertainty has a significant effect on the cost of borrowing with contact to government policies representing a significant channel. Drobetz, et al., (2018) also find the negative relation between the cost of capital and investment in light of economic policy uncertainty. Gulen & Ion (2016) employed Tobin's q and cash flow as a classic investment indicator by using a policy uncertainty. They show a negative relationship between firm-level capital investment and uncertainty linked with regulatory and future policy. Afrifa (2016) explore the relationship between a firm's performance and networking capital through cash flow. A balanced panel data regression analysis was used with a sample of 6,926 small and medium-sized non-financial companies in the U.K. between 2004 and 2013. The findings indicate that firms with low cash flow than the Median hold less working capital investment; conversely, firms with above-median cash flows have more working capital investment. Percy & Munasinghe (2015) examines the major indicators of cash flow and business performance through stability, liquidity, and profitability, demonstrating the investment and its final result. However, the portal stage identified that cash flow needs to be generated by the business unit to meet the investment requirements to enhance business performance. Damijan (2018) Find that the financial strength in times of financial distress becomes an important factor in constraining a firm's performance. The degree of financial leverage and the ability to repay outstanding debt have inhibited the firm’s productivity and hindered exports, investment, and employment. Nassar (2016) show a negative and significant correlation between the firm performance and capital structure of a firm. Multivariate regression analysis is applied to foresee the relationship between organizational success and the structure of capital. They employed strong efficiency indicators, such as Earning Per Share (EPS), Return on Asset (ROA), and Debt Ratio (D.R.), as well as Return on Equity (ROE). The study Davydov (2016) explores the impact of bank debt and public financing on firm performance in emerging markets. Using data on 700 BRIC publicly traded companies; it is showed that bank debt can have a positive impact on firm profitability. Overall, the findings imply that higher bank funding levels may have a positive impact on corporate market value and profitability. Vieira (2017) examine the relationship between firm performance and debt policy of family firms, presenting evidence that family firms and non-family firms have different characteristics. The study finds that debt correlates negatively to the family firms’ performance, which is based on the pecking order theory. So, this study concluded that ROA appears to fit better for firm performance indicator than ROE in family firms. as shows in Table 1.
| Table 1 Summary Of Relevant Studies On Investment, Epu And Firm Performance |
||||||||
|---|---|---|---|---|---|---|---|---|
| Author (s) | Sample | Dependent | Moderator variable | Independent variable(s) | ||||
| variable(s) | ||||||||
| Our study | 43 firms in the chemical and Pharmaceutical sector. | Tobin’s Q and ROA | EPU | LTI | LTB | DCR | OCF | STB |
| (Iqbal et al., 2019) | Quarterly observations of non-?nancial U.S. ?rms (S&P 500). | ROE, ROA, Net Pro?t Margin and Tobin’s Q | X | X | X | X | v | X |
| (Trong & Nguyen, 2020) | The final data set is comprised of 669 listed companies. | (EBIT), EBT, (EAT | X | v | X | v | X | X |
| (Ibhagui & Olokoyo, 2018) | With a panel data of 101 listed ?rms in Nigeria. | ROA, ROE and Tobin’s Q | X | X | v | v | X | v |
| (Grozdic et al., 2020) | 60 manufacturing ?rms based in Serbia. | ROA | X | v | v | X | X | X |
| (Aktas et al., 2015) | For a large sample of U.S. firms, 1296. | stock return | X | v | v | X | X | X |
| (Lee & Lee, 2019) | The final sample consists of 26,535 firm-year observations Korea. | Tobin’s Q | X | X | X | X | X | v |
| (Saif Ul Islam et al., 2020) | The sample of this research consists of 68 nonfinancial firms. | ROA Tobin’s Q | X | v | X | X | X | X |
| (Khan et al., 2019) | The sample from State-owned and non-state-owned firms. | Investment net fixed assets/total assets | X | v | X | X | v | X |
| (Akron et al., 2020) | Hospitality Firms. | corporate investment | X | v | X | X | X | X |
Several abbreviations have been mentioned to save space in creating a literature table of studies. ROA= Return on Assets, EPU= Economic Policy Uncertainty, LTI=Lon-Term Investment, LTB=Long-Term Borrowing, DCR= Debt Coverage Ratio, OCF= Operating Cashflow, STB= Short-Term Borrowing, √ means study used that variable and X means study did not used that variable. as shows in Figure 1 and Table 2.

Figure 1: Moderator, Independent Variables and Dependent Variable
| Table 2 Conceptual Framework Source: Author |
|
|---|---|
| Variables | Descriptions |
| TQ | Tobin Q=Total market value/Total assets |
| ROA | Return on Assets=Net profit before tax/Total assets |
| LTI | Long Term Investment= taken investment more than one year |
| LTB | Long Term Bowring= taken liabilities more than one year |
| DCR | Debts Coverage Ratio=operating cash flow/(current liabilities +Non-Current Liabilities) |
| EPU | Economic Policy Uncertainty index |
| OCF | Operating Cash Flows=EBIT+ Depreciation |
| STB | Short term borrowing=taken liabilities within one year |
Research Methodology
This study segment defines analytical techniques for analyzing the interdependence trends, variables, research assumptions, and effects of economic policy uncertainty on investment determinants.
Data and Sample
The sample includes 43 registered energy firms in the current study. To prevent specific outcomes, the energy sector was into considerations—some conditions, such as the effect of companies' formation on the uncertainty of economic policy. The moderate impact of economic policy uncertainty on investment determinants and firm performance is the primary focus to study in this sector. They tend to be influenced and involve business administration regarding economic policy uncertainty and supplementary decisions concerning investment determinants that can vary around nonfinancial sectors. All companies are trading on the Pakistan Stock Exchange (PSX). The study has chosen the six years of data from 2014 to 2018 and was gathered from Pakistan’s State Bank of Statistics Department. For assessing the impact of economic policy uncertainty as moderate with determinants of investment and firm performance, the Mean, Median, Maximum, Minimum, Standard deviation, and skewness are used. The correlation coefficient is introduced to obtain the relationship between investment determinants and company output with economic policy uncertainty. In the dynamic panel, to measure the regression T-test's effects instead of the Z value employed with linear and nonlinear regression analysis throughout the study. The "small" option has been used in GMM system regression for this purpose. The command nodiffsargan is used to prevent a specific variation from being reported in sargan statistics. Furthermore, for transmitting orthogonal differences transform rather than the first difference, an orthogonal variation is used.
Variables
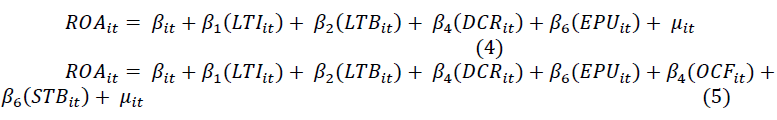
The experimental variable is what counts in the investigator's investigation and what is considered during the study. The implication of the observed variable replies to the explanatory variable. It is assessed because it "relies" on the explanatory variable fluctuations. In this study, Tobin’s Q and return on assets are used as the firm's performance. The rationale for incorporating this variable is that the study attempted to relate its performance ratio's organizational success or failure. It has an intense relationship with several other experimental parameters. Return on Assets is calculated as Net profit before tax/Total assets and Tobin’s Q as Total market value/total assets. This study tries to examine how economic policy uncertainty effects investment determinants, i.e., Long Term Investment (LTI), Long Term Bowring (LTB), Short Term Borrowing (STB), Debts Coverage Ratio (DCR)=operating cash flow/(current liabilities +Non-Current Liabilities), Operating Cash Flows (OCF), EBIT+ Depreciation and economic policy uncertainty measured as Natural logarithm of the news based Economic Policy Uncertainty Index and economy-related data collected from the State bank of Pakistan.
Hypothesis of Study
Based on the previously discussed aims, the following hypotheses concerning the energy sector of Pakistan are described.
H1: There is a positive link between Long-term investment and firm performance.
H2: There is a negative relationship between Long-term and short-term borrowing and firm performance.
H3: There is a negative association between Debts Coverage Ratio and the performance of a firm.
H4: The correlation between Debts Coverage Ratio and a firm's performance is negatively moderated by economic policy uncertainty.
H5: There is a positive relationship between Operating Cash Flows and firm performance.
H6: The relationship between Operating Cash Flows and their performance is negatively moderated by economic policy uncertainty.
Dynamic Panel Model
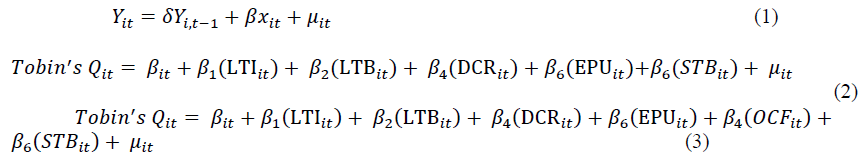
Many companies are character-driven and used panel data frameworks to established improvements in banking, economics, and finance matters. It is necessary to allow dynamics for the constant estimation of other parameters in the primary phase. The carriage represents dynamic connections with the regressors of a lagged dependent variable, i.e.,
Dynamic Models with Interaction Effect
We used panel data methodology (Arellano, 2002), meaning that the sample of study includes time-series with cross-sectional data (T=6) and a firm's measurement (N=43). Two key challenges, such as endogeneity and endless unnoticed time-invariant variations between firms named heterogeneity, were found by panel data. The previous literature has pointed to the dynamic elimination of all three subsequent echometric problems, firms' insecure features, and simultaneous (Jara et al., 2019). Therefore, to handle possible endogeneity, this study employed lagged Term of the dependent variable using a system estimator of the Generalized Methods of Moments (GMM) (Blundell et al., 2001). The efficiency of the instruments' calculations and validation relies on the absence of a second-order serial connection (AR2) in the residuals (Erlano & Bond, 1991). In the entire estimation study report (AR2), there is no second-order serial correlation for the error terms in the regressions. Moreover, the instrument validity is evaluated through the Hansen test that estimates the designated instruments' joint validity. Further, δ represents a scalar, xit=1*K, and β=K*1. One-way disturbance component model μit=λi+?it, the error term μit=de-integrated into λi and ?it where λi is the individual specific effect to cover the individual heterogeneity. Error terms can be synchronized restrictions. Table 3.
| Table 3 Descriptive Statistics |
||||||||
|---|---|---|---|---|---|---|---|---|
| TQ | ROA | LTI | LTB | DCR | EPU | OCF | STB | |
| Mean | 2.31 | 2.15 | 11.19 | 11.95 | 0.02 | 84.03 | 12.64 | 16.11 |
| Median | 2.41 | 2.21 | 11.35 | 11.95 | 0.02 | 84.14 | 12.65 | 16.11 |
| Maximum | 2.61 | 2.27 | 11.94 | 12.11 | 0.02 | 104.1 | 13.04 | 16.44 |
| Minimum | 1.8 | 1.9 | 10.13 | 11.79 | 0.01 | 63.75 | 12.24 | 15.78 |
| Std. Dev. | 0.31 | 0.14 | 0.76 | 0.12 | 0.01 | 18.32 | 0.31 | 0.33 |
| Skewness | -0.82 | -0.98 | -0.28 | 0 | 0.13 | 0 | -0.01 | 0 |
| Observations | 172 | 172 | 172 | 172 | 172 | 172 | 172 | 172 |
The descriptive statistics has provided in Table 1 for each variable. A first approach to the relationship between corporate investment and firm performance has shown in the above figure, which estimated the analysis of the EPU and investment variables over the considered period. Our sample's firms have an average ratio to Tobin’s Q is 2.31 and 2.15 for ROA, whereas it rises to the value of 84.03 when considering EPU. Regarding DCR, the data show that, on average, it presents punctuation of 0.02 and 11.95 when considering the long-Term Investment (LTI) value. Further, the study offers a relatively high value of the slandered deviation of EPU, 18.32, and moderately for DCR, LTB, STB, and OCF, respectively, to Tobin’s Q and ROA. Regarding the maximum and minimum values, all independent variables present smooth behavior for a particular study. as shows in Table 4.
| Table 4 Correlation Matrix |
||||||||
|---|---|---|---|---|---|---|---|---|
| Probability | TQ | ROA | LTI | LTB | DCR | EPU | OCF | STB |
| TQ | 1 | |||||||
| ROA | 0.8527 | 1 | ||||||
| 0 | ----- | |||||||
| LTI | 0.6044 | 0.9069 | 1 | |||||
| 0 | 0 | ----- | ||||||
| LTB | -0.6355 | -0.8434 | -0.9551 | 1 | ||||
| 0 | 0 | 0 | ----- | |||||
| DCR | 0.5414 | 0.7986 | 0.9563 | -0.9929 | 1 | |||
| 0 | 0 | 0 | 0 | ----- | ||||
| EPU | -0.5738 | -0.611 | -0.3095 | 0.0963 | -0.0375 | 1 | ||
| 0 | 0 | 0 | 0.2087 | 0.625 | ----- | |||
| OCF | 0.5698 | 0.8359 | 0.9751 | -0.9928 | 0.9973 | -0.1095 | 1 | |
| 0 | 0 | 0 | 0 | 0 | 0.1529 | ----- | ||
| STB | -0.3241 | -0.7342 | -0.949 | 0.8944 | -0.9328 | 0.1106 | -0.9414 | 1 |
| 0 | 0 | 0 | 0 | 0 | 0.1487 | 0 | ----- | |
Table 4 presents Pearson correlations among the variables. Both LTI and DCR are positively correlated with firm performance measures (Tobin’s Q and ROA). As can be seen, the correlation coefficients among the LTB and EPU are negatively correlated, with the idea that a higher level of EPU decreases the level of investment and firm performance. OCF is positively correlated to ROA and Tobin’s Q, which means more cashflow contributes significantly to a firm; conversely, STB presents a negative correlation to performance measures. Finally, multicollinearity is not a problem between the variables.
The Empirical Results
Table 3 presents the analysis of the nexus between determinants of investment and firm performance moderated by economic policy uncertainty. The determinates of investment include long-term investment, long-term borrowing, short-term borrowing, debt coverage ratio, and operating cash flow employed dynamic pattern. Figure 3 presents the study's linear regression model's findings using hierarchical panel analysis where Tobin's Q and ROA are used as the dependent variable. In contrast, long-term spending, long-term borrowing, short-term borrowing, debt coverage ratio, and operating cash flow are used as analytical test model dependent variables. At the same time, economic policy uncertainty is used as interaction with firm performance variables. The analysis also makes a case in contradiction of estimating panel exact A.R. parameters (Hambuckers & Ulm, 2020) instead of one autocorrelation (A.R.) parameter for all panels. The results from the Two-Step system GMM regression are included in all columns. When the study employed ROA as a firm performance variable in column 1, then LTI has a negative and significant influence, while DCR has significant and positive effects on ROA. In Column 2, DCR and OCF have a substantial and positive impact on ROA, but LTI observed negative and significant behavior throughout ROA.
Further, the effects of independent variables on Tobin’s Q negatively influence most cases, i.e., LTI, DCR, and EPU impact. Still, in column 2, LTB AND STB, it shows a positive and significant behavior to Tobin’s Q. In sys GMM, the value EPU rotates is position and becomes cheerful. as shows in Table 5.
| Table 5 Linear Regression Model |
||||
|---|---|---|---|---|
| Variables | TQ | ROA | ||
| -1 | -2 | -1 | -2 | |
| 2 Step sys GMM | 2 Step sys GMM | 2 Step sys GMM | 2 Step sys GMM | |
| ROA=L, | 0.022 | 0.041 | ||
| -0.0577 | -0.0583 | |||
| TQ=L, | 0.293*** | 0.288** | ||
| -0.0849 | -0.135 | |||
| LTI | -0.0321 | -0.0324 | -0.0483** | -0.0493** |
| -0.0256 | -0.0365 | -0.0204 | -0.0207 | |
| LTB | 0.0435** | 0.0494** | -0.00898 | -0.00934 |
| -0.018 | -0.0224 | -0.0146 | -0.0129 | |
| DCR | -1.328** | -1.260** | 0.763*** | 0.893*** |
| -0.635 | -0.629 | -0.125 | -0.141 | |
| EPU | -0.00471*** | -0.00511*** | 0.00113 | 0.00109 |
| -0.00119 | -0.0014 | -0.0013 | -0.00122 | |
| OCF | -0.0125 | 0.172*** | ||
| -0.0144 | -0.06 | |||
| STB | 0.201** | 0.205** | 0.0153 | |
| -0.0782 | -0.0827 | -0.0201 | ||
| Constant | -1.42 | -1.339 | -0.265 | -0.462 |
| -0.944 | -0.921 | -0.898 | -0.849 | |
| Observations | 215 | 215 | 215 | 215 |
| Number of id | 42 | 42 | 43 | 43 |
| Sargan test chi2(6) P(value) 0.08 | 0.7 | 0.75 | 0.09 | 0.09 |
| Arellano-Bond test for AR(1)P(Value) | 0.1 | 0.12 | 0.17 | 0.16 |
| Arellano-Bond test for AR(2)P(value) | 0.24 | 0.24 | 0.84 | 0.71 |
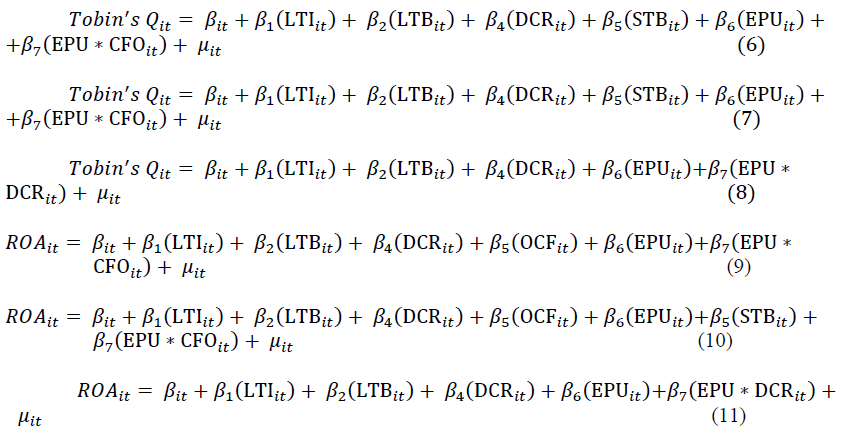
Tables 6 show the regressed findings to verify the relationship between the variable being examined and the moderation of economic policy volatility. The first section of Table 4, column 1 to 3 shows the results of Models 6 to 8 and column 4 to 6 shows the results of Models 9 to 11 using Tobin’s Q and ROA as a dependent variable. The results of above table, column 1, indicate that EPU* OCF interaction has a negative and significant relation with Tobin's Q, meaning that one unit rise in EPU interaction with OCF would add 0.00171 units to the average change in Tobin's Q. It means EPU negatively moderates the relationship between determinants of investment and Tobin’s Q. The regression findings in column 2 demonstrate that the association of EPU*OCF has an essential and detrimental relationship with Tobin's Q. This implies that a single unit rise in EPU activity with OCF in Tobin's Q will result in a change of 0.00194 units. In comparison, EPU*DCR association in column 3 has a significant and favorable relationship with Tobin, Q, meaning that one unit increase in EPUs in Q The coefficient value is 0.000437, implying that one unit increase in EPU would result in an average shift in ROA of 0.000437 times. It means EPU moderates the relationship between determines of investment and ROA.
Furthermore, the regression outcomes show that the interaction of EPU*OCF also possesses a positive and significant association with ROA. The significance of the coefficient is 1.479, which suggests one unit rise in the interaction of EPU*OCF will bring 0.000439 times to change in ROA. Therefore, it means economic policy uncertainty moderates the association between investment and firm performance proxies negatively. However, EPU*DCR does not moderate the nexus among determinants of investment and ROA. as shows in Table 6.
| Table 6 Nonlinear Regression |
||||||
|---|---|---|---|---|---|---|
| TQ | ROA | |||||
| Variables | 2 Step sys GMM | with interaction 2 Step sys GMM | with2 interaction 2 Step sys GMM | 1st interaction 2 Step sys GMM | STB 1st interaction 2 Step sys GMM | 2nd interaction 2 Step sys GMM |
| TQ=L, | 0.18 | -0.286 | 0.108 | 0.038 | 0.0209 | 0.0275 |
| -0.115 | -0.385 | -0.118 | -0.0623 | -0.0616 | -0.0682 | |
| LTI | -0.0341 | -0.00672 | -0.0122 | -0.0492** | -0.0504** | -0.0489** |
| -0.0325 | -0.0382 | -0.034 | -0.0205 | -0.02 | -0.0205 | |
| LTB | 0.0485** | 0.0435** | 0.0644*** | -0.0085 | -0.00756 | -0.00933 |
| -0.0191 | -0.0205 | -0.0235 | -0.0124 | -0.0142 | -0.0135 | |
| DCR | -1.559*** | -2.537** | -4.611** | 0.902*** | 0.776*** | 0.734*** |
| -0.602 | -1.015 | -1.845 | -0.13 | -0.121 | -0.276 | |
| EPU | 0.0150** | 0.0169** | -0.0104*** | -0.0111** | -0.0111** | 0.000779 |
| -0.00713 | -0.00744 | -0.00237 | -0.00554 | -0.00558 | -0.00208 | |
| STB | -0.0175 | 0.103 | 0.0998 | 0.162*** | ||
| -0.014 | -0.0708 | -0.0742 | -0.0568 | |||
| OCF | 0.408*** | 0.418*** | 0.149 | 0.0141 | 0.0998 | 0.162*** |
| -0.125 | -0.118 | -0.0972 | -0.0199 | -0.0742 | -0.0568 | |
| EPU*CFO | -0.00171*** | -0.00194*** | 0.000916** | 0.000916** | ||
| -0.000535 | -0.000598 | -0.000437 | -0.000439 | |||
| EPU*DCR | 0.0351* | 0.000471 | ||||
| -0.0186 | -0.00314 | |||||
| Constant | -3.720*** | -3.148** | -0.31 | 0.473 | 0.686 | -0.139 |
| -1.444 | -1.311 | -1.274 | -0.978 | -1.064 | -0.886 | |
| Observations | 42 | 42 | 42 | 43 | 43 | 43 |
| Sargan test chi2(6) P(value) | 0.67 | 0.89 | 0.87 | 0.09 | 0.06 | 0.08 |
| Arellano-Bond test for AR(1)P(Value) | 0.11 | 0.88 | 0.19 | 0.15 | 0.16 | 0.16 |
| Arellano-Bond test for AR(2)P(value) | 0.25 | 0.4 | 0.35 | 0.57 | 0.69 | 0.7 |
Conclusion
We analyze the nexus between determinants of investment and firm performance moderated by Economic Policy Uncertainty (EPU) with a sample of 43 chemical and pharmaceutical firms in Pakistan for 2013-2018. Our main finding is that the effect of EPU on determinants of investment and firm performance is significant and negative to Tobin’s Q and positive and significant to ROA. In terms of evaluating the effect of economic policy uncertainty as a moderating variable on the determinants of expenditure and firm output of chemical and pharmaceutical companies. Our study is the first in the authors' best knowledge, confirming that Uncertainty increases the importance of the alternative to wait before further information on ventures' feasibility is disclosed. We employed GMM analysis to avoid endogeneity issues.
Moreover, the overall moderate regression findings suggest that the relationship between investment determines and Tobin's Q is negatively and significantly moderated by the EPU. The study findings indicate that investment decisions significantly affect market performance rather than accounting performance (ROA). Therefore, the firm needs to consider investment policies that can play an important role in enhancing firms' efficiency when making an investment decision.
Furthermore, this study also supports Tobin's Q theory. This study will help practitioners while making an investment decision for firms because the results of this study contribute significantly to the firm's performance. Also, this research contributes favorably to a country's prospective investors at large. Through the right investment decisions, unemployment levels can be reduced, which will generate new job opportunities for that country's people.
Limitations of the Study
• We would like to make it obvious that no study can be escaped of obstacles as mentioned below:
• In this research, the researcher has collected data only from the nonfinancial sector. The financial industry can be used to carry the same study to get different results.
• This research focuses on the secondary data obtained from SBP officials, thus relying only on the data's validity. The reliability of the secondary data depends on the essence of the investigation. The significance of the data source will influence the estimates' results and clarify the results of the study.
References
Afrifa, G.A. (2016). Net working capital, cash flow and performance of UK SMEs. Review of Accounting and Finance.
Akron, S., Demir, E., Díez-Esteban, J.M., & García-Gómez, C.D. (2020). Economic policy uncertainty and corporate investment: Evidence from the US hospitality industry. Tourism Management, 77, 104019.
Aktas, N., Croci, E., & Petmezas, D. (2015). Is working capital management value-enhancing? Evidence from firm performance and investments. Journal of Corporate Finance, 30, 98 113.
Al-Thaqeb, S.A., & Algharabali, B.G. (2019). Economic policy uncertainty: A literature review. The Journal of Economic Asymmetries, 20, e00133.
Arellano, M. (2002). Sargan’s intrumental variables estimation and the generalized method of moments. Journal of Business & Economic Statistics, 20(4), 450–459.
Arrow, K.J., & Lind, R.C. (1978). Uncertainty and the evaluation of public investment decisions. In uncertainty in economics, 403-421. Academic Press.
Blundell, R., Bond, S., & Windmeijer, F. (2001). Estimation in dynamic panel data models: Improving on the performance of the standard GMM estimator. Emerald Group Publishing Limited.
Baker, S.R., Bloom, N., & Davis, S.J. (2016). Measuring economic policy uncertainty. The quarterly journal of economics, 131(4), 1593-1636.
Chen, P.F., Lee, C.C., & Zeng, J.H. (2019). Economic policy uncertainty and firm investment: Evidence from the US market. Applied Economics, 51(31), 3423–3435.
Chang, K., Wan, Q., Lou, Q., Chen, Y., & Wang, W. (2020). Green fiscal policy and firms’ investment efficiency: New insights into firm-level panel data from the renewable energy industry in China. Renewable Energy, 151, 589-597.
Damijan, J.P. (2018). Corporate financial soundness and its impact on firm performance: Implications for corporate debt restructuring in Slovenia. Post-Communist Economies, 30(2), 156–192.
Davydov, D. (2016). Debt structure and corporate performance in emerging markets. Research in International Business and Finance, 38, 299–311.
Demir, E., & Ersan, O. (2018). The impact of economic policy uncertainty on stock returns of Turkish tourism companies. Current Issues in Tourism, 21(8), 847–855.
Drobetz, W., El Ghoul, S., Guedhami, O., & Janzen, M. (2018). Policy uncertainty, investment, and the cost of capital. Journal of Financial Stability, 39, 28–45.
Demir, E., & Ersan, O. (2017). Economic policy uncertainty and cash holdings: Evidence from BRIC countries. Emerging Markets Review, 33, 189-200.
Grozdi?, V., Mari?, B., Radiši?, M., Šebestová, J., & Lis, M. (2020). Capital investments and manufacturing firms’ performance: Panel-data analysis. Sustainability, 12(4), 1689.
Gulen, H., & Ion, M. (2016). Policy uncertainty and corporate investment. The Review of Financial Studies, 29(3), 523–564.
Hambuckers, J., & Ulm, M. (2020). Interest rate differentials and the dynamic asymmetry of exchange rates.
Ibhagui, O.W., & Olokoyo, F.O. (2018). Leverage and firm performance: New evidence on the role of firm size. The North American Journal of Economics and Finance, 45, 57–82.
Iqbal, U., Gan, C., & Nadeem, M. (2019). Economic policy uncertainty and firm performance. Applied Economics Letters, 1–6.
Jara, M., López-Iturriaga, F., San-Martín, P., & Saona, P. (2019). Corporate governance in Latin American firms: Contestability of control and firm value. BRQ Business Research Quarterly, 22(4), 257–274.
Karadima, M., & Louri, H. (2020). Economic policy uncertainty and non-performing loans: The moderating role of bank concentration. Finance Research Letters, 101458.
Kaviani, M.S., Kryzanowski, L., Maleki, H., & Savor, P. (2020). Policy uncertainty and corporate credit spreads. Journal of Financial Economics, 138(3), 838–865.
Lee, N., & Lee, J. (2019). External financing, R&D intensity, and firm value in biotechnology companies. Sustainability, 11(15), 4141.
Liu, R., He, L., Liang, X., Yang, X., & Xia, Y. (2020). Is there any difference in the impact of economic policy uncertainty on the investment of traditional and renewable energy enterprises?–A comparative study based on regulatory effects. Journal of Cleaner Production, 255, 120102.
Lim, C.Y., Wang, J., & Zeng, C.C. (2018). China's “mercantilist” government subsidies, the cost of debt and firm performance. Journal of Banking & Finance, 86, 37-52.
Makololo, P., & Seetharam, Y. (2020). The effect of economic policy uncertainty and herding on leverage: An examination of the BRICS countries. Cogent Economics & Finance, 8(1), 1821482.
Nassar, S. (2016). The impact of capital structure on financial performance of the firms: Evidence from Borsa Istanbul. Journal of Business & Financial Affairs, 5(2).
Percy, W.W., & Munasinghe, P.G. (2015). Cash flows and firm performance: Some evidence from the Sri Lankan firms cash flow. Journal of Management Matters Faculty of Management Studies, Rajarata University of Sri Lanka, 2.
Phan, D.H.B., Iyke, B.N., Sharma, S.S., & Affandi, Y. (2020). Economic policy uncertainty and the financial stability–Is there a relation? Economic Modelling.
Peng, H., & Liu, Y. (2018). How government subsidies promote the growth of entrepreneurial companies in clean energy industry: An empirical study in China. Journal of Cleaner Production, 188, 508-520.
Saif Ul Islam, M., Meo, M.S., & Usman, M. (2020). The relationship between corporate investment decision and firm performance: Moderating role of cash flows. Journal of Public Affairs, e2445.
Trong, N.N., & Nguyen, C.T. (2020). Firm performance: The moderation impact of debt and dividend policies on overinvestment. Journal of Asian Business and Economic Studies.
Vieira, E.S. (2017). Debt policy and firm performance of family firms: The impact of economic adversity. International Journal of Managerial Finance.
Wu, J., Zhang, J., Zhang, S., & Zou, L. (2020). The economic policy uncertainty and firm investment in Australia. Applied Economics, 1–25.
Zhang, G., Han, J., Pan, Z., & Huang, H. (2015). Economic policy uncertainty and capital structure choice: Evidence from China. Economic Systems, 39(3), 439–457.
Zhang, H., Li, L., Zhou, D., & Zhou, P. (2014). Political connections, government subsidies and firm financial performance: Evidence from renewable energy manufacturing in China. Renewable Energy, 63, 330-336.
Zahra, S.A., & Garvis, D.M. (2000). International corporate entrepreneurship and firm performance: The moderating effect of international environmental hostility. Journal of business venturing, 15(5-6), 469-492.
Received: 29-Dec-2021, Manuscript No. aafsj-21-8371; Editor assigned: 01-Jan-2022; PreQC No. aafsj-21-8371(PQ); Reviewed: 17-Jan-2022, QC No. aafsj-21-8371; Revised: 22-Jan-2022, Manuscript No. aafsj-21-8371(R); Published: 29-Jan-2022