Research Article: 2021 Vol: 25 Issue: 4S
The Optimal Financing Structure and Its Impact on the Profitability of Business Enterprises
Hasan Subhi Hassan Hussein AL Abass, AL-Hadbaa University College
Citation Information: AL Abass, H.S.H.H. (2021). The optimal financing structure and its impact on the profitability of business enterprises. Academy of Accounting and Financial Studies Journal, 25(S4), 1-15.
Abstract
The aim of this research is to clarify the relationship between the financing structure of the companies under study listed in the Iraq Stock Exchange and the profitability measured by the return on assets. The research found that the dependence of the Iraqi company for carpets and modern sewing on long-term financing sources, and in a very large way, had a positive impact on the rate of return on assets. The research recommended the need to expand diversification of the financing structure, especially long-term. And intensify research studies by companies to enhance the possibility of choosing the best sources of financing for them by specialists in this regard.
Keywords
The Financing Structure, the Profitability of Enterprises, the Business Enterprises.
Introduction
The subject of the financing structure is one of the important topics in the field of financial management, which has gained importance through its impact and its connection with the objectives of financial management related to maximizing profit and/or maximizing the market value of the share in order to maximize the wealth of the owners, which is the goal that most companies seek to achieve, and to achieve these goals requires the existence of projects investment and the presence of sources to finance these projects, so one of the tasks of the financial management is to take the investment decision and then the appropriate financing decision, and the financing decisions are among the complex decisions that require study and research to determine the source of financing, whether it is through owned financing or through indebtedness, or determining the financing mix that It achieves the lowest cost, and from here this research was launched to determine the nature of the relationship between the financing structure and the profitability of the company.
Research Problem
In the field of improving their financial performance, companies seek to pay attention to choosing the appropriate financing structure, which is reflected in their achievement of market profitability, but most of them do not care about that, which may prevent them in certain financial problems.
Research Hypothesis
The research stems from the premise that “there is a close relationship between the financing structure and earnings per share.”
Research Objective
The research aims to achieve several goals, including:
1. Recognize the nature of the financing structure and the theories that explain it.
2. Measuring the effect of financing structure on earnings per share.
Research limits
Spatial boundaries: the clothing production company, the Iraqi carpet company, and the modern sewing company.
Time limits: 2007-2020
Research Methodology
To achieve the goal of the research and to prove or deny its hypothesis, the researcher relied on the descriptive approach and the quantitative method at the same time.
Research Structure
The First Axis: The Concept of Financing Structure
The financing decision determines how the company will obtain the sources of funds, whether financing is by equity only or by debt and equity. It also determines the ratio for each of these sources. The combination of debt and equity is called the financing structure (Brealy et al., 2019:6).
The term capital structure is used if it includes equity financing sources and long-term loans only, as the capital structure is defined as a mixture of long-term debt and equity. He defined the financing structure as “the structure of the sources of financing or the liabilities side and the right of ownership in the balance sheet statement.” He referred to other definitions of the financing structure, including that it represents the method by which the company’s assets are financed and is represented in the liabilities and property rights clauses in the balance sheet and includes short-term indebtedness (current liabilities) and long-term debt.( Al-Nuaimi & Al-Tamimi, 2019:349).
Gitman & Chad referred to the capital structure through the effect of the amount of leverage in the capital structure on the return and risk, as they defined the capital structure as a mixture of debt and equity held by the company, and the capital structure is one of the areas for complex financial decisions because it is linked to financial decisions Other. (Gitman & Chad, 2020: 508).
Finally, capital structure is meant as a mixture of long-term sources such as preferred stock, bonds, long-term loans, and retained earnings. That is, the term capital structure refers to the relationship between long-term sources of financing, and the appropriate capital structure is an important decision for financial management because it is related to the value of the company, and the permanent financing of the company represents long-term debt and shareholders' equity. The researchers touched on the definition of the financing structure to distinguish it from the capital structure, as the financing structure shows the pattern of total financing. (Subramanian & Paramasivan, 2017: 48).
It is clear from the above that all the previously mentioned definitions carry the same concept related to the financing structure, and the differences are in terms of expression only, except for some writers who did not distinguish between the financing structure and the capital structure. As a result, the financing structure represents the left side of the budget, which includes all liabilities and property rights. The capital is part of the financing structure and includes long-term liabilities represented by long-term loans that the company obtains from financial institutions, and equity, which represents paid-up capital, retained earnings and reserves. (Abdel Nafeh et al., 2015:247).
The Second Axis: The Components of the Financing Structure
The components of the financing structure explain how the company finances its long-term and short-term needs, such as purchasing fixed assets, raw materials, or to finance other expenses necessary for the continuation of the company's activity.
Debt Instruments (Corporate Bonds)
Indebtedness tools are one of the most important financing methods that companies and governments resort to in order to meet their financial needs when the self-financial resources are unable to do so. Bonds, especially those with a long term, are one of the most common and widely used types of these tools. Governments and companies alike resort to borrowing through public subscription so that the amount they borrow is divided into equal parts, each representing an age at which the government or company debt is proven. Although most Arab legislations have allowed joint stock companies the right to issue the mentioned loan bonds. (Valdez, 2018: 364).
These bonds are issued by private sector companies with the aim of borrowing from the public to meet their financial needs, and the issuance process is usually subject to the supervision of the concerned authorities in this regard, and these bonds carry a degree of risk compared to government bonds (Hussain, 2018: 102).
There are many types of these issuances depending on the terms of each issuance on the one hand, and the size and nature of the companies on the other hand, as there are so-called secured bonds, which are issued with a guarantee of mortgaging some of the company’s assets, in contrast to the unsecured bonds that are issued by large companies that are reliable in their performance, as well as On the partnership bonds, which give the investor the right to the company’s profits, in addition to the periodic interests he obtains and other bonds (Matar & Taim, 2015: 100).
Property Tools
Equity instruments are shares issued by joint stock companies to finance their long-term financial needs. Shares are certificates of ownership that entitle their owner to obtain part of the company’s real and financial assets, and they differ from other financial instruments as they do not have a nominal value or a maturity period, as they remain circulating in the markets indefinitely, except in the case of the company repurchasing it or upon dissolution of the company. And filtered Shares are divided into two types:
Ordinary Shares: An ordinary share is defined as an ownership instrument of a tradable financial nature, which gives its holder the right to obtain non-fixed returns in addition to his share in the company’s capital, which is confirmed by the share certificate. It has equal duties for its owners and is offered to the public through public subscription in the primary markets, and it is allowed to trade in the secondary markets, as its market value may decrease as a result of continuous changes that are due to different causes and evaluations in the financial market (Abdul Gawad, 2016: 98).
Also, this type of shares was not allocated with certain privileges, whether in relation to the distribution of profits or voting or in relation to the company's assets upon its liquidation, in addition to that, the ordinary share has no maturity date, is not subject to obsolescence, as well as being indivisible, and the holder of the ordinary share has the right Voting in selecting members of the board of directors. In addition to the bearer's participation in many important issues concerning the issuing company. Ordinary stock holders also enjoy the right of preference in buying shares, as this right gives the company's old shareholders priority in buying the new shares issued by the company (Abdullah & Faraj, 2019: 155).
Preferred Shares: These are the second type of shares that are exported by companies in addition to the ordinary shares, but they differ from the latter as they give the holder the right to advance and have preference over ordinary shareholders in obtaining part of the profits or the company’s assets upon its liquidation. (Abdul Qadir, 2018: 148). It also represents a title deed to its bearer, just like ordinary shares. In addition, it combines the characteristics of bonds and ordinary shares (Hanafi & Quriyas, 2017: 39).
It is clear to us that the holders of this type of shares have priority in fulfilling their rights from the fixed assets in the event of the company’s bankruptcy, as well as their priority in receiving profits, and also that they do not lose their right to receive them if the company does not announce the distribution of profits in a particular year, as the profits of these shares It is cumulative (Jamal, 2018: 55). On the other hand, holders of this type of shares often do not have the right to vote on the resolutions of the General Assembly.
Bank Borrowing: is represented in the loans that the company obtains from banks and the bank credit is secured and it is called secured credit because the bank lends on a short-term basis mostly and the guarantee provided by the company to the bank is the current assets such as inventory, receivables, and securities. Perhaps the banks do not lend to the total value of the secured assets, but to less than them, and it is desirable that the safety limit of the stock be more in the case if the loan is secured by the stock. But if the guarantee is a receivable, in the event of the company’s failure to pay, the bank collects the company’s receivables from the company’s customers and uses them to pay off the debt. As for the cost of bank credit, it is the interest rate that the bank imposes on the borrower this cost is determined by the income tax rate (Gupta & Sharma, 2020:18).
The Third Axis: The Theories That Explain the Financing Structure
Signal Theory
This theory is based on a basic principle, which is the asymmetry of information that characterizes markets. In fact, the information that institutions transmit is not necessarily true and honest. Hence, this theory proceeds from the fact that managers in the best performing institutions can issue special and effective signals, which distinguish them from other institutions of a higher level underperformance. The characteristic of these signs is that it will be difficult to imitate them by weak institutions. Therefore, we find that the sign theory is based on two ideas: (Abdul-Wahhab, 2019: 319).
1. The same information is not distributed in all directions, as managers in the institution can create information that is not available to investors.
2. Even if that information is published and available to everyone, it will not be perceived or understood in the same way.
There are many forms of signals used, some of which are in the form of capital structure, dividend policy, and it can also be in the form of complex (combined) securities, and the signal is not just a secret or misleading statement as many believe, but a real financial decision It is realistic and this leads to negative repercussions in the event of its appearance and discovery of its incorrectness. It is clear through the signal theory and information asymmetry that it raises many problems about the marginal cost of funds, as it becomes clear that the weighted average marginal cost of funds increases when the company resorts to external financing and this is by issuing and selling shares This difference between the two types of financing costs is due to the cost of issuance on the one hand, and on the other hand, an increase in the cost of funds may also occur if the issuance results in a decrease in the share price, which affects the evaluation of capital agreement projects (Barreau & Delahaye, 2018: 160). This theory proposes a model that attempts to reflect the quality of an institution on the basis of its financial structure. Investors classify the existing institutions in the market into two categories (A, B) so that institutions from (A) perform better than institutions from category (B), and in order to classify institutions in the two groups (A or B) Investors in the market determine a level that has the ability to borrow higher than (B) and so on. Therefore, resorting to this model is feasible in a financial market characterized by the lack of asymmetry in the resulting information, especially with the latter's possession by managers.
Funding Sources Sequence Theory
This theory is an alternative to the exchange theory, in which the information is assumed that the investors are not the same, and in general the investor has less information from within the company, so the basis of this theory is the media content or the so-called lack of information asymmetry in the framework of decisions of the financial structure, to clarify the asymmetry of information between managers and investors The following situation clarifies, the information asymmetry means that the company's managers have more information about the company's future and its activity than the investors. Suppose that the manager needs financing because there are profitable investment opportunities, and the managers ask investors to contribute to the financing of profitable companies, but there is doubt by the investors in achieving profits , and they have no way of validating the managers' claim (Gitman, 2020:533), if the managers try to sell shares to fund the investments, the investor pays prices that reflect the information available to them, meaning that the manager sells at a low price i.e. the price at which the managers can get if there is a similarity in the information investors will only accept if they pay a lower price that reflects the asymmetry in the information, so managers may decide to reject investments that achieve current value In order to avoid selling property shares at low prices, the only solution to this problem and to maintain the financing of investments, managers resort to other sources of funding, according to the priorities of the funding sources that he identified, which are as follows (Vernnim, 2017:659):
1. Internal funding is at the top of the list in preference.
2. Because returns and investment opportunities vary from year to year, companies can withdraw their cash balances.
3. If this is not enough and external financing becomes necessary, then it issues risk-free debts.
4. When the company cannot resort to conventional loans, it issues securities and starts from the least risky type and gradually moves to the most risky.
5. Finally, when all else fails, the company issues equity shares.
The theory of funding sources chain explains why profitable companies borrow less, not because there are targeted debt ratios, but because these companies do not need external financing. And companies with few profits issue debt because they do not have enough internal financing for investments and because debt financing is the first when choosing external financing. This theory is accepted that there is no specific ratio for mixing debt and ownership because there are two types of ownership, internal and external, the first at the beginning of the selection and the second the final choice. And the debt ratio reflects the company's accumulated need for external financing (Brealy et al., 2019: 493).
Market timing theory
Although this theory appeared early, the credit for its development and crystallization dates back to 2002, where they included evidence that proves the impact of the market timing theory on the structure of financing in the United States, and then both in 2007 proved that there is a stable and stable relationship between the theory Market Timing and Funding Structure Based on an Analytical Study of Enterprises in the Netherlands. Whereas, institutions may buy shares valued at less than their true value, or they may call their maturing bonds when the interest rate falls in order to reissue them again at a lower interest rate (Grigore & ?tefan, 2019: 864), and therefore this theory stems from the idea that the institution should To choose the appropriate financing based on the different prices of securities between different financial markets at a time when the institution needs financing, in other words, market conditions are the most important factor in making the financing decision. The assessment of appropriate market opportunities has been based on a ratio. For example, companies may tend to issue shares instead of borrowing when this ratio has a positive long-term impact on the capital structure (Ali, 2019: 14).
So, according to this theory, managers do not have to care about the source of funding, whether the internal sources of financing outweigh the external or vice versa. What is actually important is which of these sources is priced at exaggerated values (above or below the real value) in the financial markets. Based on that, the decision-makers must They are aware of the signals that can be read from the market, discrimination and asymmetry of information as well as determining the appropriate timing for decision-making, otherwise they will face the risk of making incorrect decisions (Deepa, 2017:81).
The Trade-off between Costs and Benefits theory
According to this theory, any increase in the level of debt causes an increase in bankruptcy, financial problems, and agency costs. Thus the value of the company decreases. Therefore, it is possible to define a capital structure Optimized by balancing the tax benefits and costs of bankruptcy and financial crises, and in order to achieve a balance in the company we must look at a level of debt at which it is possible to offset the financial costs with the tax benefits of additional debt (Karadeniz et al., 2015: 3). The swap theory predicts a target debt ratio that varies from company to company.
Safe companies that have tangible assets and tax savings have high target rates to a certain extent. As for companies that are exposed to risk, and their assets are intangible, their initial funding is from the right of ownership, meaning that this theory adopts moderate and rational debt ratios, but the facts were contrary to the expectations of this theory , there are many profitable companies that prefer less debt, but according to the expectations of the swap theory, as companies with high profits mean high borrowing capacity, they have large tax savings, so debt ratios should be high (Brealy et al., 2019: 414).
The Fourth Axis: the Relationship of the financing structure to the profitability of the company
The goal of maximizing profitability is one of the goals that the company seeks to achieve, as it is the focus of decisions in a way that suits the ability of the financial management to achieve this goal. The importance of this goal stems from being an important source of self-financing. Therefore, achieving this goal indicates the effectiveness of financial decisions. But the goal of maximizing profits has been criticized by many, including the exposure of investments to business risks as well as financial risks, if the company relies on funding sources to finance its investments, and thus these risks increase the rate of return required by the borrower and lenders, which increases the cost of capital and reduces earnings per share. While the stability of the required return from the lenders represented by interest and the stability of profits before interest with an increase in financial leverage, i.e. (the ratio of debt / equity) increases the profitability of the share, this is in terms of the impact of debt on the profitability of the company through financial and business risks, while some of them explained the impact of Debt (financial leverage) in earnings per share through the relationship between the return on investment and the cost of debt. The revenue capacity of the company is less than what the lenders expect, i.e. less than the cost of the debt (Al-Zubaidi, 2020: 52).
This was demonstrated by a study by (Rehman et al., 2018:52) that the type of debt used has an impact on the profitability of the company. If the companies have few sales, it is better to use short-term debt because of its strong and positive impact on profitability, and there is a negative relationship between long-term debt and profitability, and the researcher believes that the reason is due to the high amount The interest is for long-term debt, so the above study suggested that the company’s financing should not be from short-term debt if its sales are high because its term is short for a year or less, and that it is financed from long-term debt, and this means that the decision of the financing structure must take into account the size the sales (Abdel-Gawad & Al-Shdeifat, 2016).
The Fifth Axis: the Standard Aspect of the Impact of the Financing Structure and Earnings per Share
First: The companies under study
The research was limited to three companies working in the industrial field that are somewhat close in terms of production, in addition to that, these companies are listed in the Iraqi Stock Exchange, and these companies are represented by (the clothing production company, the modern sewing company, the Iraqi carpet company), and the structure analysis can be shown Financing and profitability as in the following Table 1.
| Table 1 Financing Structure and Return on Assets for a Clothing Production Company | |||
| Year | Short term financing | Long term financing | Return on Assets |
| 2007 | 42.9 | 57.1 | -0.24 |
| 2008 | 86.6 | 13.4 | -0.4 |
| 2009 | 65.5 | 34.5 | -0.3 |
| 2010 | 50.1 | 49.9 | 0.01 |
| 2011 | 68 | 32 | 0.14 |
| 2012 | 47.8 | 52.2 | -0.41 |
| 2013 | 84.7 | 15.3 | 0.09 |
| 2014 | 48.6 | 51.4 | 0.11 |
| 2015 | 57.8 | 41.2 | 1.4 |
| 2016 | 50.1 | 49.9 | 0.13 |
| 2017 | 34.5 | 65.5 | -5.1 |
| 2018 | 35.4 | 64.6 | -4.7 |
| 2019 | 17.7 | 82.3 | 0.3 |
| 2020 | 19.6 | 80.4 | 5.9 |
It is clear from the above table that the apparel production company’s dependence on short- and long-term funding sources at the same time, as these ratios vary from year to year during the study period 2007-2020, but the average ratio for the length of the study period was very close, as it was approximately within 50.45% of the sources Long-term financing and 49.55% for short-term sources, while the company incurred losses during the first three years, as the return on assets was negative, and then this ratio was taken by fluctuation as profit and loss, but the ratio in total was a loss of (-0.2) in Table 2.
| Table 2 Financing Structure and Return on Assets for the Modern Sewing Company | |||
| Year | Short term financing | Long term financing | Return on Assets |
| 2007 | 25.4 | 74.6 | 0.6 |
| 2008 | 10.3 | 89.7 | -0.5 |
| 2009 | 10.9 | 89.1 | -0.17 |
| 2010 | 13.5 | 86.5 | 0.07 |
| 2011 | 30.9 | 69.1 | -0.12 |
| 2012 | 19.4 | 80.6 | -0.11 |
| 2013 | 31.1 | 68.9 | -0.3 |
| 2014 | 13.8 | 86.2 | -0.01 |
| 2015 | 13.4 | 86.6 | 0.26 |
| 2016 | 12.6 | 87.4 | 10.6 |
| 2017 | 11.1 | 88.9 | 10.1 |
| 2018 | 19.7 | 80.3 | 17.04 |
| 2019 | 27.4 | 72.6 | 7.5 |
| 2020 | 17.3 | 82.7 | 19.4 |
From the above Table 2 notes, the modern sewing company relied on short and long-term financing sources at the same time, as it was very reliant on long-term financing sources, as it constituted approximately 80% of the total sources of financing during the study period, which was positively reflected on the rate of return on assets. The company achieved good profit rates, and the average return rate was about 4.6% during the period 2007-2020.
| Table 3 Financing Structure and Return on Assets for the Iraqi Carpets Company | |||
| Year | Short term financing | Long term financing | Return on Assets |
| 2007 | 20.3 | 79.7 | 0.23 |
| 2008 | 31.5 | 68.5 | 0.12 |
| 2009 | 36.6 | 63.4 | 0.13 |
| 2010 | 41 | 59 | 0.07 |
| 2011 | 36.3 | 63.7 | 0.09 |
| 2012 | 38.4 | 61.6 | 0.05 |
| 2013 | 34.6 | 65.4 | 0.05 |
| 2014 | 40.4 | 59.6 | 5.9 |
| 2015 | 36.6 | 63.4 | 5.3 |
| 2016 | 42.3 | 57.7 | 5.2 |
| 2017 | 35.01 | 64.99 | 5.8 |
| 2018 | 28.7 | 71.3 | 5.9 |
| 2019 | 31.5 | 68.5 | 2.5 |
| 2020 | 33.2 | 66.8 | 7.3 |
From the above Table 3 notes, The adoption of the Iraqi Carpet Company has shaped the trend of the Modern Sewing Company in financing its investments, which made it achieve good profits, as it relied very heavily on long-term financing sources, as it constituted approximately 65% of the total sources of financing during the study period, which was positively reflected on The rate of return on assets, as the company achieved good profit rates, and the average return rate was about 2.7% during the period 2007-2020.
Second: The model Description
In this topic, we will explain the impact relationship between the financing structure, measured by the ratio of short-term financing to the total sources of financing, and its impact on the profitability of the companies under study. This is according to the following function.
pro=f ( shde )
Third: Presentation and analysis of the standard results
Sleep Test
Here, we will rely on the unit root test of Phillips-Brown PP in order to indicate the extent to which the research variables are inactive or not, as the data in Table 4 indicate the presence of a unit root in the time series of the variables in question at their original level, which means accepting the null hypothesis (Ho), which It states that the time series will not be stationary, and this is confirmed by the value of Pro, as it was greater than (5%) at their original level. When taking the first difference between them, it became static, as the value of Pro was less than (5%). Therefore, it is an integral of the first degree I (1) in Table 4.
| Table 4 The Results of the PP Test for the Variables Return on Assets and the Ratio of Short and Long-Term Debt to the Total Sources of Financing | |||||||
| The Results of the PP Test | |||||||
| First Differences | The level | The variable | |||||
| Without a fixed limit and general Direction | Fixed limit and general Direction | Fixed limit only | Without a fixed limit and general Direction | Fixed limit and general Direction | Fixed limit only | variable | |
| 0.000 | 0.000 | 0.000 | 0.7429 | 0.2584 | 0.0503 | SHDE ? I(1) | Iraq Carpets Company |
| 0.000 | 0.000 | 0.000 | 0.5910 | 0.2266 | 0.6720 | PRO ? I(1) | |
| 0.000 | 0.000 | 0.000 | 0.2163 | 0.1766 | 0.0520 | SHDE ? I(1) | Modern Sewing Company |
| 0.000 | 0.000 | 0.000 | 0.6640 | 0.3256 | 0.8397 | PRO ? I(1) | |
| 0.000 | 0.000 | 0.000 | 0.0041 | 0.1265 | 0.1336 | SHDE ? I(1) | Clothing Production Company |
| 0.000 | 0.000 | 0.000 | 0.1632 | 0.9136 | 0.6499 | PRO ? I(1) | |
* The probabilistic value method Pro was used, according to which the parameter is significant if the value Pro is less than (0.05), and this indicates that the time series is free from the unit root and vice versa.
Estimating the relationship between the financing structure and profitability of the study sample companies
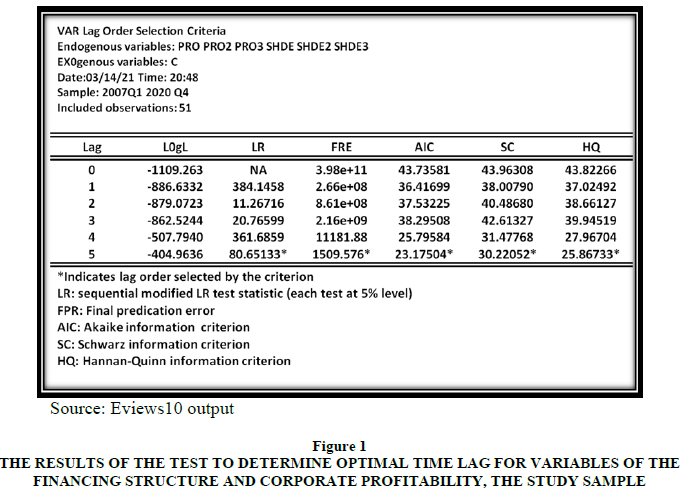
Optimal retardation test for the model, it is clear from the results of the criteria used in determining the optimal time lag in Figure 1 That the optimal lag is five chapters.
Figure 1 The Results of the Test to Determine Optimal Time Lag for Variables of the Financing Structure and Corporate Profitability, Th e Study Sample
The results of the co-integration test using the Johansen-Jeslius method (Al-Iraqiya Carpet Company).
We can conduct their co-integration according to the Johansen co-integration test, which confirms that the null hypothesis (Ho.) which states that there is no long-term integrative relationship between the variables under study, while the alternative hypothesis (H1) shows the existence of the integrative relationship in the long run between those variables. This is done by relying on the impact and maximum value tests.
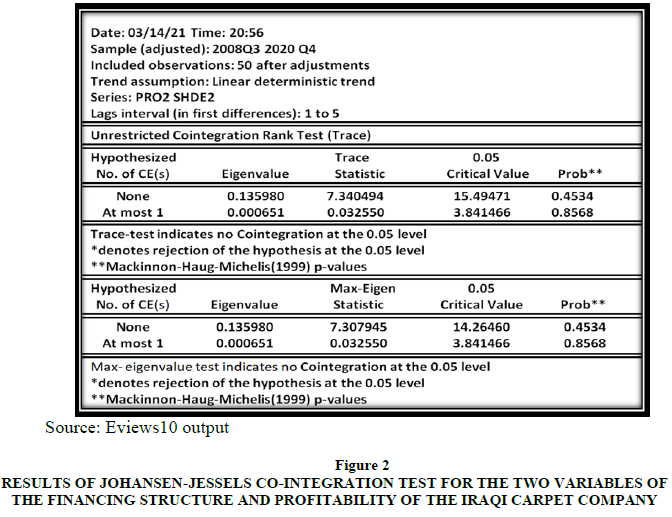
The results of Figure 2 indicate that there is no long-term integrative relationship between them, according to the results of the two tests, the effect and the maximum value. The impact test shows that there is no joint integration between the two variables, according to the value of Prob. (0.53) which is greater than (5%), As well as the calculated value amounted to (7.3), which is smaller than the tabular critical value of (15,49) at the level of significance (5%), which means that the null hypothesis (Ho.) is accepted, which states that there is no vector of co-integration between the two variables, that is, that (r=0) . As for the maximum value test, the same result was reached, as the value of Pro was (0.45), which is greater than (5%), in addition to that the calculated value amounted to (7.3) which is less than the tabular critical value of (14.26), Which confirms the absence of a vector of co-integration between the two variables, that is, the acceptance of the null hypothesis, which indicates the absence of a long-term equilibrium relationship between the two variables and that they both move in an independent direction from the other.
Figure 2 Results of Johansen-Jessels Co-Integration Test for the Two Variables of the Financing Structure and Profitability of the Iraqi Carpet Company.
Granger causality test results
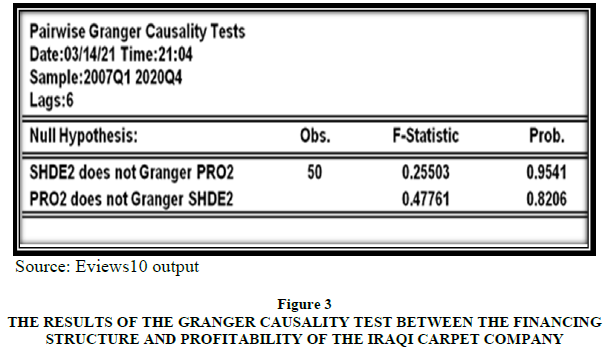
After it was found that there is no co-integration between the financing structure and Profitability of Al-Raqiah Carpets, we can reinforce this result by testing the Kranger causality, the result of which is supposed to be the absence of causality between the two variables. Figure 3 indicates the acceptance of the null hypothesis (Ho), which states that there is no short-term causal relationship between the two variables and in both directions. This is consistent with the results of the co-integration of the model itself.
Figure 3 The Results of the Granger Causality Test between the Financing Structure and Profitability of the Iraqi Carpet Company
Co-integration test results using the Johansen-Jeselius Methodology (Modern Sewing Company)
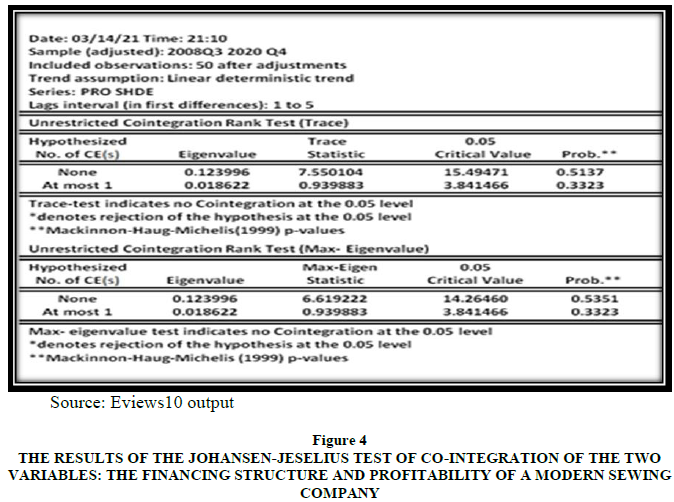
The results of Figure 4 show that there is no long-term integrative relationship between them, according to the results of the two tests, the impact and the maximum value. The impact test shows that there is no co-integration between the two variables, according to the value of Prob. of (0.51) which is greater than (5%), As well as the calculated value of (7.5), which is smaller than the tabular critical value of (15,49) at the level of significance (5%), which means that the null hypothesis (Ho.) is accepted, which states that there is no vector of co-integration between the two variables, that is, that (r=0) . As for the maximum value test, the same result was reached, as the value of Prob. was (0.53) which is greater than (5%), in addition to that the calculated value amounted to (6.6) which is less than the tabular critical value of (14.26), This confirms that there is no vector of co-integration between the two variables, that is, acceptance of the null hypothesis, which indicates that there is no long-term equilibrium relationship between the two variables and that they both go in an independent direction.
Figure 4 The Results of the Johansen-Jeselius Test of Co-Integration of the two Variables: The Financing Structure And Profitability of A Modern Sewing Company
Granger Causality Test Results
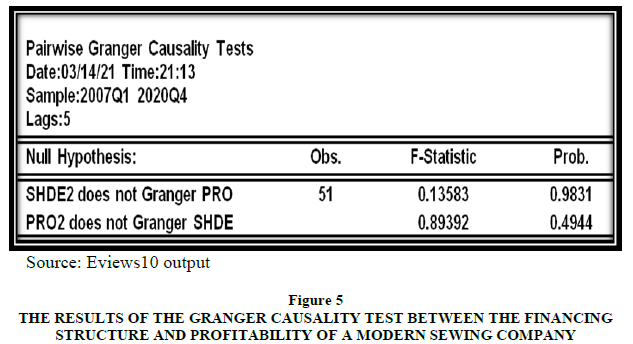
After it was found that there is no co-integration between the financing structure and profitability of Al Raqiah Carpets, we can reinforce this result by testing the Granger causality, which is supposed to result in the absence of causality between the two variables. Figure 5 indicates the acceptance of the null hypothesis (Ho.), which states that there is no short-term causal relationship between the two variables and in both directions. This is consistent with the results of the co-integration of the model itself.
Figure 5 The Results of the Granger Causality Test between the Financing Structure and Profitability of A Modern Sewing Company
The results of the co-integration test using the Johansen-Jeslius method (for a clothing production company)
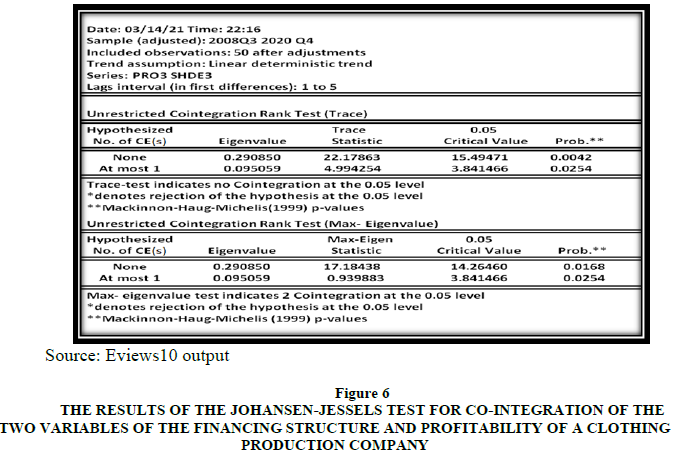
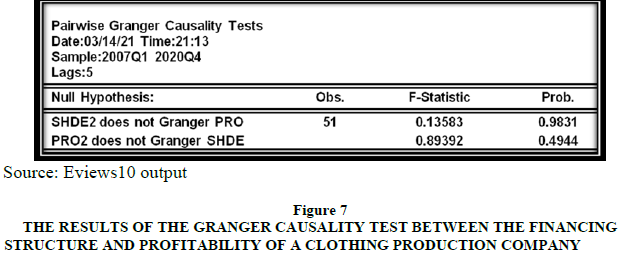
The results of Figure 6 show that there is a long-term integrative relationship between the financing structure and profitability, as the impact test indicates that there is a co-integration between the two variables because the value of Prob. which amounted to (0.004), is statistically significant as being less than (5%) at a significant level (5 %). This confirms the rejection of the null hypothesis and acceptance of the alternative hypothesis that confirms the existence of a long-term integrative relationship between these two variables. While the test of the greatest value reinforced the results of the first test, as it reached the same result, and that the value of Prob. (0.01), which is statistically significant, being less than (5%) at the same level of significance mentioned, i.e. acceptance of the alternative hypothesis, and despite the fact that Therefore, the Granger causality test proved the opposite, as there is no causal relationship between two variables under study, as the value of Prob. was (0.9), which is statistically insignificant as it is greater than (5%), which confirms this on the acceptance of the null hypothesis as shown in Figure 7.
Figure 6 The Results of the Johansen-Jessels Test for Co-Integration of the Two Variables of the Financing Structure and Profitability of A Clothing Production Company
Figure 7 The Results of the Granger Causality Test between the Financing Structure and Profitability of A Clothing Production Company
Conclusion and Recommendations
Conclusions
1. The Iraqi Carpet and Modern Tailoring Company’s dependence on long-term financing sources was very large, as it constituted approximately 65% and 80% of the total sources of financing, respectively, during the study period, which enabled them to achieve positive rates of return (profit).
2. The half-credit in a financing structure of a clothing production company is not feasible and successful in choosing, as it has incurred losses during its production process throughout the study period.
3. The search variables chains did not remain at their original level, while they were dormant when the first differences were taken for them and became integrated of the first degree.
4. The optimum lag time test revealed that the optimum lag time is 5 chapters.
5. The absence of a long-term and short-term equilibrium relationship between the financing structure and the return on assets in the two Iraqi modern carpets and sewing companies, according to the Johansen co-integration test and Granger causality.
6. The existence of a long-term equilibrium relationship between the financing structure and the return on assets in the clothing production company, according to the Johansen co-integration test, while Granger's causality confirmed the absence of that relationship.
Recommendations
1. The necessity of taking into consideration the adoption of the results of this study by investors when dealing in the Iraqi Stock Exchange.
2. Expanding the diversification of the financing structure, especially the long-term.
Intensifying research studies by companies to enhance the possibility of selecting the best sources of funding for them by specialists in this regard.
Acknowledgement
I would like to thank for the team of (Clothing, Modern Sewing, Carpets companies) and all its employees for helping me accomplish this scientific research, In additional to All the people who provided me with all data and information.
References
- Abdel, N.A., & Ghazi, T.F. (2015). Financial Markets, Wael Publishing and Distribution House, Amman.
- Abdel-Gawad, M.A., & Al-Shdeifat, A.I. (2016). Investment in the Stock Exchange: Shares-Bonds-Securities, Dar Hamed for Publishing and Distribution, Amman.
- Abdullah. A.F.M. (2019). Towards strengthening the role of Islamic banks in financing small and medium enterprises, Journal of Management and Business Science. 4(7).
- Abdul-Wahhab. (2019). Public finance, Dar Wael Publishing and Distribution House, Amman.
- Al-Jamal, J.J. (2018). Financial and Monetary Markets, Dar Al-Safaa for Printing and Publishing, Amman.
- Al-Nuaimi, A.T., & Al-Tamimi, A.F. (2019). Financial Analysis and Planning: Contemporary Trends, Arabic Edition, Amman: Al-Yazuri Publishing and Distribution.
- Al-Zubaidi, H.M. (2020). Advanced Financial Management, Al-Warraq Publishing and Distribution Corporation, Amman, Jordan.
- Barrean, & Delahay. (2018). Financial structural, Manufactured in the United States of America.
- Brealy., Marcus., & Myers. (2019). Fundamentals of corporate financial. McGraw-Hill/Irwin.
- Daden Abdel-Wahab, (2019). The Controversy Over Financing Structures of Small and Medium Enterprises, Al-Bahet Journal, University of Ouargla, (7).
- Deepa. R, (2017). A study on the determinants of capital structure and profitability, PHD, Pondicherry University
- Gitman, L., & Chad, J. (2020). Managerial Finance. Manufactured in the United States of America.
- Grigore, M., & ?tefan-Duicu, V. (2019). Agency Theory and Optimal Capital Structure, Challenges of the Knowledge Society,Economics.
- Gupta., Sharma., Shashik. (2020). Financial Management. Mrs. Usha RsjKumer for Kalyani Publisher: New Delhi.
- Hanafi, A., & Quriyas, S. (2017). The symbiotic role of the endowment system in financing sustainable development, Ain-Shams University.
- Hussain, A. (2018). Enterprise profitability management using functions, PhD thesis. Umm Al Qura University.
- Irfan, A. (2019). Determinants of capital structure: empirical evidence from Pakistan, Master thesis, University of twente enschede.
- Karadeniz, E., Serkan, Y., & Iskenderoglu, O. (2011). Firm size and capital structure decisions: Evidence from Turkish lodging companies. International Journal of Economics and Financial Issues, 1(1), 1.
- Matar, M., & Fayez, T. (2015), Investment Portfolio Management, Wael Publishing and Distribution House, Amman.
- Rehman. (2018). Financial Management, Journal of Baghdad University, 3(2), Iraq- Baghdad.
- Subramanian., & Paramasivan. (2017). Financial Management. New Age international (P) Limited: New Delhi
- Vernimmen, P. (2017). Corporate Financial Theory and Practice, John Wiley & Sons Ltd, The Atrium, Southern Gate, Chichester, West Sussex, PO198SQ, United Kingdom.
