Research Article: 2020 Vol: 24 Issue: 1
The Relationship between Capital Structure and Firm Value: Cases of Listed Companies in the Food and Beverages Industry in Vietnam
Tam Thanh Nguyen, FPT University
Ha Phu Nguyen, Vietnam National University
Linh B.K Nguyen, FPT University
Nam Thanh Vu, FPT University
Thinh Ung Le, FPT University
Abstract
Food and beverages (F&B) industry plays an important role in satisfying customer demand in domestic market and for exports. In the period of 2010-2018, the demand for F&B products and services was at the highest level and accounted for 22.3% of total consumer spending. However, by the end of 2019, the number of F&B companies listed on Ho Chi Minh and Hanoi Stock Exchanges represented less than 10% of the registered companies in this sector. Along with issues related to financial management of F&B businesses, the management of capital has gained a lot of interests from stakeholders in the market. It also highlights the importance to analyze the relationship between capital structure and firm value of these listed companies in F&B industry, especially in the context that Vietnamese government has improvements in supporting small and medium enterprises (SMEs) after the global financial crisis. In line with the rapid growth of Vietnamese F&B industry during the last 2 decades, the paper clarifies relevance of the research topic from both theoretical and practical approaches. Theoretically, theories related to capital structure and firm value developed by Modigliani & Miller (1963), Myers (1984), Jensen & Meckling (1976) set foundations for the relationship between these two factors. In addition, reviews on empirical researches show different results on how sources of funds associated with capital amounts can have either positive effect or negative effect on the firm value of companies in different industries and in F&B particularly. In order to test the relationship between capital structure and firm value of F&B companies listed on Vietnamese stock exchanges; the authors utilize financial data of 22 representatives in the period between 2014 and 2018 and the multi-regression models developed by Aggarwal & Padhan (2017). In the model, market capitalization and leverage are selected to represent for the capital structure and firm value, while other variables are considered as control variables which include firm quality, size, intangibles, profits, growth, liquidity and macroeconomic factors. The findings of the paper prove that the capital structure has positive relationship with the firm value. In addition, an increase in firm quality, tangibility, firm growth and GDP growth rate can improve the firm value. Besides, an increase leverage, or pursuing high profitability and liquidity associated with the existence of inflation would weaken firm value of F&B companies. The authors, therefore, recommend that fund managers and board of management should improve the strategic planning towards sustainable sources of funding and management cost of funding more efficiently.
Keywords
F&B Industry, Capital Structure, Firm Value.
Introduction
Over the last three decades, Vietnam has become one of the fastest growing economies in Southeast Asia and it is characterized by the young population. The population under the age of 35 years old accounts for 70%, and the average life expectancy reaches 76 years old, marking the highest level among countries with equivalent income level. In Vietnam, the emerging middle class is expected to increase from 13% in 2019 to 26% by 2026. In the period 2002-2018, more than 45 million people were lifted out of poverty, and GDP per capita increased by 2.5 times, standing over US$2,500 in 2018 (World Bank, 2019). Vietnam also has a combination of bank-based system and capital markets. Nowadays, Ho Chi Minh Stock Exchange (HOSE) and Hanoi Stock Exchange (HNX) manage transactions of more than 750 stocks with the total market capitalization of nearly USD 168,459 billion, which is equivalent to 71.6% of Vietnamese GDP in 2018. In addition, the bond market has been strengthened with transaction volume of USD 18,866 billion, creating more opportunities for listed enterprises to switch between debt and equity. Companies in private sectors have been able to access more diverse sources of capital, not just relying on stock issuance and bank credit. In all business sectors in Vietnam, the cost of debt and cost of equity change frequently and they are also sensitive to the economic cycle. From capital management perspectives, an optimal capital structure is important for listed firms as it helps determine a reasonable weighted average cost of capital and contributes to improving the company’s net cash flow in the future. Growing debates regarding capital structure and firm value have also drawn much interest from financial research community.
Among the listed companies in Vietnam, food and beverages (F&B) companies have grown very fast and played a vital role in satisfying the increasing demand of Vietnamese residents and for exports. According to survey’s results of Business Monitor International Ltd. (BMI), the total consumer spending of all sales channels was over more than VND 2,800 trillion in the period 2010-2018, in which consumption expenditure of F&B reached the highest level compared to other categories, accounting for 22.3% of total household expenditure. Sales of alcoholic beverages had an annual growth rate of 11.2% during 2002-2018. In 2018, alcoholic beverages reached USD 36,972 billion and it is expected to increase by 11.6% in period 2020-2025. The number of F&B accredited companies such as SQF, BRC and Global GAP is also increased. Since 2014, the Government of Vietnam has issued Resolution No. 26/ CT-TTg dated September 04, 2014 with supports for SMEs with income tax interest incentives, creating favorable conditions for F&B companies. In association with tropical climate and large population, consumption of F&B products such as beer, coffee, soft drinks and carbonated beverages is expected to continue to grow at a double-digit rate in the next decade.
F&B companies in Vietnam have recently recognized the importance of establishing strategy to increase equity capital and create momentum for business scale development as well as step by step liberalize international trade under commitments with the World Trade Organization since Vietnam became an official member in 2006. However, they are coping with a lot of difficulties, especially in determining weighted average cost of capital and issuing new stocks for business partners from abroad. Besides, the number of F&B companies listed in stock exchanges currently represents less than 10% of all registered firms in the F&B industry, so the industry may face with challenges competing with foreign competitors. Moreover, dramatic changes in the regulatory environment are also putting more pressures on F&B industry. Recently, By the end of 2019, the government has implemented new regulations on drunk-driving and taxation on alcohol, leading to severe effects on cash flows management of those who provide food and drinks services and products. Currently, capital structure of F&B companies. The capital structure in the F&B industry shows that about 60% of companies use a mixture of debt and equity, while cases of excessive debt and non-use of debt exist. In the meanwhile, debates about whether investors should use long-term investment in F&B industry or keep a portfolio of different stocks in different industries are continuing, leading to the need to research more on capital structure and firm value.
Based on these contexts, the authors focus on testing the relationship between capital structure and firm value in Vietnam’s F&B industry, using data from 22 selected firms listed on Vietnamese stock exchanges in period 2014-2018. This is the period witnessing new regulations supporting SMEs in Vietnam after severe effects from the global financial crisis. Besides the introduction, the paper is structured into 4 main sections. Section 2 systematizes theoretical and empirical studies related to the research topic. Section 3 proposes data and methodology applied in the paper, and section 4 interprets data analysis and results. The final section summarizes empirical findings and recommendations for relevant stakeholders in the market to make effective decision in the management of funds as well as managing the cost of capital for F&B businesses.
Literature Review
Analysis of corporate finance shows that capital structure is the mix of debt and equity used by the company in order to finance its business. By another definition, capital structure is a specific mixture of long-term funds, which are raised in capital markets (CFA Institute, 2019). Financial leverage is one of the important measurements to reflect ratio of the whole liabilities to total net worth of the firm (Aggarwal & Padhan, 2017). The firm’s value, on the other hand, is referred as enterprise value or the value of firm’s assets and it is known as the combination of the value of debt and the value of equity. The value of the firm could be measured by either its total book value or its total market value, which is normally denoted as total market capitalization. Since the middle of the 19th century, traditional theories implied the relationship between capital structure and firm value are highlighted in the literature. An optimal financial leverage associated with the maximum firm value is found in the earliest and most famous theory on capital structure propose by Modigliani & Miller (1958, 1963). The positive relationship exists in a perfect market condition, especially in a tax-deductible interest payments environment. The models of the issue-invest decisions proposed in their works implicate both rational decisions of firm managers and the importance shifting between borrowings and equity issues, that is based on not only costs of financing but also the riskiness of funding methods. In this process, the maximization of firm value is found based on optimal capital structure. It also implies crucial propositions relating to firm value and cost of capital in cases with taxes and without taxes. In the trade-off theory, Myers (1984) also emphasizes more about debt financing decision of managers based on how they recognize bankruptcy costs. It recommends an appropriate proportion of debt and equity in conditions that costs of financing are equivalent to benefits to the firm (Kraus & Litzenberger, 1973). As stated in Parrino et al. (2012), trade-off theory highlights the importance of optimal capital structure for the firm. In the meanwhile, the pecking order theory confirms both the importance of capital structure to the firm and advantages of accessing to the firm’s internal information based on assumptions about equality between rational interpretation of investors and internal information advantages of firms’ managers. It also states that funding decisions are based on cost of financing associated with underlying rules from internal sources to debt then externally raised equity (Myers & Majluf, 1984). Besides, the agency cost theory emphasis on the existence of agency costs as results of debt and outside equity (Jensen & Meckling, 1976). Graham & Tucker (2006) also find that both direct and indirect bankruptcy costs are extremely important in agency costs theory.
Based on these traditional theories, a lot of empirical studies have been found to address the efficiency and applicability theoretical approach into practice. Ogbulu & Emeni (2012) argue that withdrawn factors from theories such as “taxes, bankruptcy cost, agency cost, information asymmetry, interaction with input/or product and corporate control considerations” are extremely important to research on determinants of firm value, while others highlight requirements to suggest an optimum capital structure in relevant research topics. There are also researches’ results concluding about an optimum capital structure (Harris & Raviv, 1991; Hatfiled, Cheng & Davidson, 1994; Pandey, 2004), and others supporting for conclusions suggested in the pecking order theory (Flannery & Rangan, 2006). In the meanwhile, opinions of using debt to finance both seasonal and permanent increase in working capital, or the acquisition of plant, property equipment are also found in other researches (Hennessy & Whited, 2005; Titman & Tsyplakov, 2007; Frank & Goyal, 2008, Al-Fayoumi & Abuzayed, 2009). Furthermore, studies that support agency costs theory raise arguments on the mix effect between structure and firm value (Stulz, 1988; Aggarwal & Kyaw, 2006).
In contrast to literatures supporting traditional theories, criticism on efficiency and applicability of traditional theories in the real world is also found. Debates center on the irrelevant of traditional theories due to the fact that most of theoretical approach is not applicable for all types of firms in different industries, or even for firms within an industry (MacKay & Phillips, 2005; Graham & Leary, 2011). In reality, factors affecting corporate capital structure underly at unobserved firm-specific and time-invariant factors (Lemmon, Roberts & Zender, 2008). In other words, “one size fits all” both could not applicable in reality and is insensitive to capital structure.
Along with the development of literatures, recognition on determinants of capital structure and firm value and their effect direction have also gain a lot of interest from research community. A number of researches utilize market capitalization as a measurement for the firm value (Chadha & Sharma, 2016; Chowdhury & Chowdhury, 2010; Dhankar & Boora, 1996). Meanwhile, a number of studies desire to use market leverage to evaluate how the firm’s debt could be covered by the firm’s factual value and based on the assessment of investors (Danis, Rettl & Whited, 2014; Shah & Kausar, 2012; Charalambakis & Psychoyios, 2012; Antoniou, 2008; Feidakis & Rovolis, 2007; Bevan, 2004; Wiwattanakantang, 1999; Rajan & Zingales, 1995). Besides market leverage, Aggarwal & Padhan (2017) emphasize the importance of using firm quality and Z-score, which could be revealed in Altman (1968) to evaluate driving forces for capital structure and the firm value. Other researchers highlight the importance of firm size and its relationship to firm value, in which some found a significant positive relationship of the two variables (Dang, Li & Yang, 2017; Vo & Ellis, 2017; Fumani & Moghadam, 2015), while others came up with a contrast result (Muradoglu & Sivaprasad, 2011; Siahaan & Handayani, 2014). Various empirical studies applied tangibility as a factor of industry specific to examine relationship between capital structure and firm value (Shah & Kausar, 2012; Bevan, 2004; Voulgaris, 2004; Booth, 2001). Based on their argument, different industry employs different proportion of fixed assets and intensive capital, so it is believed that the company’s higher compositions of fixed assets offer a better collateral value for the firm, and thus the company could invest in more projects due to available funds. When studying the impact of capital structure on firm value, Aggarwal & Padhan (2017) also employ the return to assets (ROA) ratio along with many other researches on the topic (Vo & Ellis, 2017; Shah & Kausar, 2012; Rajan & Zingales, 1995). As firm value could be considerably influenced by firm’s total assets, which comprises not only current assets but also long-life assets, such as factories and equipment, the other studies applied the growth of total assets as a reflection of the growth of firm (Fumani & Moghadam, 2015; Alghusin, 2015; Titman & Wessels, 1988). Antoniou (2008) show that the firm’s higher liquidity could lower the firm’s financial distress, and the firm value could be positively related to its liquidity. Nevertheless, an extraordinary ratio might inform that the firm is not using its assets effectively and might misspend the capital for further investment opportunities, and lower the firm value. Other studies conclude that macro-economic factors can give mixed results into firm value (Chowdhury & Chowdhury, 2017; Gharaibeh, 2017; Fumani & Moghadam, 2015; Ogbulu & Emini, 2012). Additionally, conclusions about the existence of mixed results from empirical data of dissimilar industries can be found in many studies (Vo, 2017; Vo & Ellis, 2017; Dang, Li & Yang, 2017).
Recently, studies on optimal capital structure of firms in F&B in emerging economies have been found in some academic journals. Damayanti, Mulyyono & Murtaqi (2017) analyze the background and business issue in F&B market of Indonesia using regression models, thereby propose suggestion for optimal capital structure for F&B industry. In the meanwhile, Kuma (2018) bring out the financing pattern and factors affecting the capital structure of listed companies in F&B industry during the first and second economic reforms in India. However, few of them focus on Vietnamese market, creating motivation for studies about the relationship between capital structure and firm value of F&B companies in Vietnamese market.
Data and Methodology
Although the relationship between firm value and capital structure is positioned at the center of the research, there are different factors acting as control variables in the suggested regression model. In this paper, the authors proposed a model based on the original framework of Aggarwal & Padhan (2017). Instead of using different measurements of firm value such as market capitalization, enterprise value, or price-to-book ratio, the authors decided to use only market capitalization as the representative for firm value because of availability of data and information in Vietnamese financial market. Market capitalization, therefore, is used as a representative for firm value and is positioned as the dependent variable. In the meanwhile, independent variables used in the model include leverage, firm quality, size, tangibility, profitability, growth, liquidity, GDP growth rate and inflation. In Vietnamese stock exchanges, the research population include 35 listed firms as of December, 2019, and related financial data of these companies is gathered on the annual basis during the period between 2014 and 2018. However, further researches have excluded 13 companies due to the incomparability of their main business activities as well as the inadequacy of financial data, resulting in the rest of 22 companies to be selected in the research.
Data analysis method is firstly consisted of descriptive statistics, which show central tendency, a summary of a dataset through a single value reflecting the center of data distribution and the measures of the data points dispersion around the mean. The variables’ association is also be illustrated by Pearson’s correlation coefficient, which the magnitude of the statistical relationship, or correlation, as well as its direction could be displayed. One of the basic methods of linear regression analysis is Pooled OLS model, which is defined as one where the data on different individuals are simply pooled together, without any provision for individual differences that might lead to dissimilar coefficients (Hill et al., 2011). In addition, fix effect model could be used to control the time-invariant characteristics among firms by capturing these differences into the intercept. However, random effect model assumes the time-invariant characteristics are random and these differences are captured into the firm residual terms. The Hausman test and the Breusch – Pagan Lagrange test are then applied in order to find the most suitable model among Pooled OLS, FEM, and REM. Furthermore, the model detections such as multicollinearity, autocorrelation, and heteroscedasticity could be discovered, and fixed based on further test such as VIF and Wooldridge test.
In this paper, the authors follow these basic steps of data processing, then deciding to apply REM model due to its appropriateness, and it is illustrated as the following:

Where:  Market capitalization,
 Intercept ter,
 Market leverage,
 Firm quality,
 Firm tangibility,
 Firm profitability,
 Firm growth,
 Firm liquidity,
 Real GDP growth rate,
 Vietnam’s inflation,
  Residual term,
 Combined errors
Notes: i = 1, 2,…, 22 number of companies and t = 1, 2,…, 5 year
Information in Table 1 depicts variables used in the model and expected relationship between dependent and independent variables.
| Table 1 Description of Variables and Expected Relationships | ||
| VARIABLES | MEASUREMENT | RELATIONSHIP |
| Market capitalization |  |
|
| Leverage | 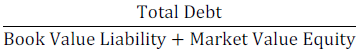 |
(+|−) |
| Firm quality | Z=1.2X1 + 1.4X2 + 3.3X3 + 0.6X4 + 1.0X5 Where: X1 = working capital/total assets X2 = retained earnings/total assets X3 = earnings before interest and taxes/total assets X4 = market value equity/book value of total liabilities X5 = sales/total assets Z = overall index |
(+) |
| Size | Ln(Total Assets) | (+) |
| Tangibility | 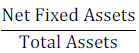 |
(+) |
| Profitability | 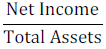 |
(+) |
| Growth | 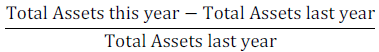 |
(+) |
| Liquidity | 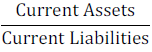 |
(+|−) |
| Macro factors | Annual GDP growth rate, Inflation | (+|−) |
| Sources: Variables in the models are adopted from Aggarwal and Padhan (2017) | ||
Results and Discussions
Results in Table 2 illustrate descriptive statistics of 10 variables deployed in the sample. Market capitalization and firm size demonstrates a small difference between their mean and median, which reveals a similarity in the total assets and contributed capital of the 22 selected companies.
| Table 2 Descriptive Statistics of Variables Used in the Model | ||||||||||
| M-CAP | LEV | QUAL-ITY | SIZE | TANG | PROF | GRO-WTH | LIQUI-DITY | GDP | INFLA-TION | |
| Mean | 12.11 | 0.27 | 4.07 | 12.33 | 0.20 | 0.08 | 0.14 | 2.43 | 9.10 | 2.54 |
| Median | 12.03 | 0.20 | 3.61 | 12.18 | 0.19 | 0.06 | 0.07 | 1.77 | 9.90 | 2.60 |
| Max | 14.46 | 0.77 | 20.96 | 13.86 | 0.47 | 0.78 | 1.17 | 26.04 | 11.2 | 4.70 |
| Min | 10.75 | 0.00 | 0.13 | 11.33 | 0.03 | -0.30 | -0.53 | 0.50 | 6.50 | 0.60 |
| Std. Dev. | 0.87 | 0.25 | 3.50 | 0.68 | 0.09 | 0.11 | 0.28 | 3.25 | 1.83 | 1.36 |
| Skewness | 0.75 | 0.49 | 2.62 | 0.70 | 0.54 | 2.78 | 1.31 | 5.71 | -0.33 | 0.20 |
| Kurtosis | 0.15 | -1.21 | 8.62 | -0.29 | 0.22 | 19.16 | 2.74 | 36.12 | -1.62 | -0.84 |
| Obs. | 110 | 110 | 110 | 110 | 110 | 110 | 110 | 110 | 110 | 110 |
| Source: The sample’s results are abstracted from descriptive statistics analysis using Stata 16.0 | ||||||||||
Besides, a moderate disparity in central tendency of leverage figures among companies is also illustrated. The low values expose an ineffective capital utilization of F&B companies. It also expresses that they still have further ability and ways to access debt. This displays their excessive reliance on external funds as well as their limited borrowing ability in the future. As the number of companies belong to the “Safe” zone, in accordance with firm quality, is occupying a substantial proportion, the overall industry quality is splendid. The average tangibility of selected enterprises is around 20%, which is low considering the nature of the industry. In accordance with low level of leverage, they can acquire additional external funds for further expansion. Firm’s asset growth also indicates F&B as a flourishing industry, though the substantial development only exists in some enterprises. The level of profitability, however, is considered as a small number. Yet, as nearly half of the selected enterprises have the ROA ratio ranging from 10-30%/ year, indicating an attraction of the industry to the investors. The liquidity ratio of the industry shows that the companies could favorably cover their short-term financial distress. Lastly, the macroeconomics figures describe that Vietnam is a fascinating destination for investors.
Table 3 shows data results from Pearson correlation test and it can illustrate the relationship between pairs of variables in the research. The strongest correlation is between leverage and firm quality. Firm quality and profitability as well as firm tangibility and size also demonstrate the high correlations. However, the results show that none of the pairwise correlation is high enough to might lead to multicollinearity problem.
| Table 3 Pearson Correlation Test | ||||||||||
| M-CAP | LEV | QUAL-ITY | SIZE | TANG | PROF | GRO-WTH | LIQUI-DITY | GDP | INFLA-TION | |
| M-CAP | 1.00 | |||||||||
| LEV | -0.36 | 1.000 | ||||||||
| QUALITY | 0.46 | -0.61 | 1.000 | |||||||
| SIZE | 0.87 | 0.07 | 0.10 | 1.000 | ||||||
| TANG | 0.51 | 0.02 | 0.16 | 0.52 | 1.000 | |||||
| PROF | 0.45 | -0.43 | 0.59 | 0.22 | 0.12 | 1.000 | ||||
| GROWTH | 0.17 | -0.03 | -0.09 | 0.29 | -0.05 | 0.02 | 1.000 | |||
| LIQUIDITY | -0.17 | -0.38 | 0.27 | -0.29 | -0.17 | -0.02 | -0.14 | 1.00 | ||
| GDP | 0.34 | -0.09 | 0.0001 | 0.02 | 0.07 | -0.05 | -0.08 | 0.02 | 1.00 | |
| INFLATION | 0.01 | -0.02 | 0.06 | 0.03 | -0.01 | -0.09 | -0.21 | 0.12 | 0.13 | 1.00 |
| Source: The sample’s results are abstracted from descriptive statistics analysis using Stata 16.0 | ||||||||||
The result of Hausman test that is illustrated shows the P-value of 0.4208, which is higher than 5%. However, the variant inflation factors (VIF) is also employed to detect possible multicollinearity, and it shows the value of 1.54, which is lower than 5. Thus, the variables only have a small to moderate correlation with each other. Besides, under the assumptions of REM, the model is not suffered from Heteroskedasticity error. However, the result from Wooldridge test demonstrates that autocorrelation error exits in REM applied in this research (Table 4).
| Table 4 Tests for the Most Appropriate Models | |||
| POOLED OLS | REM | FEM | |
| Breusch-Pagan Lagrange | 39.34 (Prob>Chibar2=0.0000) | ||
| Hausman | 9.18 (Prob>Chi2=0.4208) | ||
| VIF | 1.54 | ||
| Wooldridge | 19.015 (Prob>F=0.0003) | ||
Therefore, in order to control for the possible existed errors in the model, as autocorrelation, the feasible generalized least squares (FGLS) model is employed in analyzing the data, with a very strong assumption that the model for within-cluster error correlation is correctly specified. Analysis results between the variables using the FLGS model are shown as the following:

In details, market capitalization and firm’s leverage have a significant negative relationship at the significant level of 1%, with the coefficient of -1.08. The negative relation is consistent with previous studies which demonstrates that augmented leverage acts as a catalyst for an adverse effect on the firm value. (Aggarwal & Padhan, 2017; Dang, Li & Yang, 2017; Feidakis & Rovolis, 2007). Especially, findings in F&B industry of Vietnam is relevant to recommendation in the capital structure theories developed by Modigliani & Miller (1958) and Modigliani & Miller (1963). The firm quality score expresses the positive relationship with the firm’s market capitalization, at 1% level of significance, similar to the study of Aggarwal & Padhan (2017). The coefficient value of the model is 0.047. High firm quality, which reflects the firm’s high capacity of generating returns and operations, demonstrates the depression of the firm’s probability of bankruptcy, and hence, enhances the firm value. Enterprises’ size also performs a significant positive relation with firm value, with the correlation coefficient and significance level of 1.075 and 1%, respectively. This result is consistent with many empirical results (Aggarwal & Padhan 2017; Dang, 2011; Antoniou, 2008; Feidakis & Rovolis, 2007), in accordance with the fact the large companies tend to have large market capitalization. Besides, as large-scale enterprises are more likely to attract investors, there could be a surge in the firm’s share price when the firm heighten its asset value.
Additionally, tangibility expresses a significant positive impact on firm value, with a coefficient of 0.32 and at a level of significance of 1%. This relation is similar to the studies of Aggarwal & Padhan (2017); and Gharaibeh (2017) in testing the correlation of firm’s tangibility and its share price. As a higher proportion of factories as well as equipment over firm’s total assets might lead to firm’s greater capacity in products fabrication, together with the nature of the industry, firm’s tangibility is strictly related to the firm value.
The result from the regression analysis of firm growth illustrates its positive though the unconvincing effect on firm value. The coefficient of growth is 0.038 with the P-value of 0.141. The insignificant relation of growth and firm value is consistent with the researches of Aggarwal & Padhan (2017); and Purwohandoko (2017).
Firm’s profitability and firm value are expressed to have a significant negative correlation with the coefficient value of -0.211 together with the P-value of 0.010. Following the research of Aggarwal & Padhan (2017), there is a similarity between the result of this thesis with other previous empirical studies.
At the current moment, F&B industry is continuing the growth stage identified in the business cycle. Specifically, some companies are making efforts to restructure its operation for further growth. Many Vietnam listed companies, furthermore, namely KDC, MSN, SBC, and VNM, have been merged or acquired by foreign competitors in the period of 2014 to 2018. Consequently, current F&B listed companies are under potential competitions from not only domestic firms but also foreign enterprises. These firms’ profit, as a consequence, would be affected. Furthermore, along with the potential to grow from these deals, the firms’ total assets would also be enhanced. The firm’s profitability, which is measured by ROA might be witnessed with a diminution. Firms’ shares, on the other hand, would also express an increase in price, in accordance with the studies of Trautwein (1990) and Holderness & Sheehan (1985). As a consequence, the firm’s profitability and share price could move in the opposite direction in the selected period.
The utilization of accounting method of some companies, in addition, which is normally elucidated as a method to augment the net income while cash flow is unsustainable and unreliable, would also be reflected by the declining share price of the selected enterprises.
Firm’s liquidity illustrates a negative relation firm value with a correlation coefficient of -0.023 at a significant level of 1%. As verified in the previous section, the industry’s liquidity ratio in the selected period is merely 2.43, meaning that the enterprises are not utilizing their capital well. In other words, the firms might waste their long-term investment opportunities in current assets and lessen the value of the enterprises. The result demonstrates a similarity with the study of Batten & Vo (2017).
The macroeconomic factors, as expressed by Vietnam’s annual growth rate and inflation, demonstrate the inconclusive effects on Firm value. The coefficient of GDP growth rate and Inflation, in turn, are 0.292 and -0.174 while their P-values, subsequently, are 0.407 and 0.690. This result displays the insignificance impact with the dissimilar direction of the influence of annual GDP growth and Inflation on Firm value, in contrast with the result of Aggarwal & Padhan (2017). This difference could be explained by the difference in the research scope of the two researches, in testing the relationship of the firms’ share prices and the external factors.
Conclusions and Recommendations
The paper focused on examining the relationship between capital structure and firm value of F&B companies listed on stock exchanges of Vietnam. Other factors, namely firm quality or firm size, are also employed as a contributor to the explanations of firm value in the model, instead of the main focus of this research. Firm quality and liquidity, first of all, with a significant influence on firm value, should be taken a focal point in order to ensure the smooth business operations and the firm’s ability in accessing external funds, and improve long-term investments. Nonetheless, the liquidity should be capped with a point where the current assets could fully be utilized without wasting long-term investment opportunities. Additionally, as leverage is having a significant negative impact on firm value, this highlights the vital impact of capital structure on firm value. Thus, the fund manager and board or management need to look at their debt equity mix in order to fulfill multiple objectives by making better financial decisions.
Firm size and tangibility, besides, also act as a significant positive catalyst for firm value. Still, the insignificant relation between asset growth with firm value also suggests that the firm’s total assets as well as total net fixed assets stick with sustainable development, and effective management in the asset utilization.
Firm’s profitability also has a significant impact on firm value. In accordance with this result as well as the authors’ viewpoint, the investors should concentrate on specific firm’s condition as well as its cash flow, in order to have their rational investment decisions.
Furthermore, most F&B companies in Vietnam are not quite “aged” companies but they have loyal customers, especially those in the middle-income class. With huge demand for food and drink and stable market shares, domestic F&B firms in general and listed F&B firms in particular have a lot of opportunities to expand business lines in the future, especially if they are successful to set up an optimal capital structure and good management of funds. Therefore, management board should determine an optimal weighted average cost of capital and make thoroughly appraisal for investment projects as well as an appropriate planning for new equity issues if the firms have good new investment. Specifically, management boards need to forecast and take consideration on macro-economic effects, so that decisions on new equity issues or date of equity issues announcement are made appropriately. Among different methods of increasing charter capital, firms in F&B can select either retained earnings to pay off debt, reduce or eliminate dividends or issue new equity. Some excessive levered firms should neither take new investment with debt nor use receivable to repurchase stock.
Related to the existing literature on F&B research in Vietnam, the authors recommend both practitioners and researchers should perform further studies to determine the optimal capital structure in F&B industry.
References
- Aggarwal, R., & Kyaw, N.A. (2006). Leverage, investment opportunities, and firm value: A global perspectives. Journal of Financial Development, 1(2), 1-26.
- Aggarwal, D., & Padhan, P.C. (2017). Impact of capital structure on firm value: Evidence from Indian hospitality industry. Theoretical Economics Letters, 7(4), 982–1000.
- Al-Fayoumi, N.A. & Abuzayed, B.M. (2009). Ownership structure and corporate financing. Applied Financial Economics, Taylor & Francis Journals, 19(24), 1975–1986.
- Alghusin, N.A.S. (2015). Do financial leverage, growth and size affect profitability of Jordanian industrial firms listed? International Journal of Academic Research in Business and Social Sciences, 5(4), 385-398.
- Altman, E.I. (1968). Financial ratios, discriminant analysis and the prediction of corporate bankruptcy. The Journal of Finance, 23(4), 589-609.
- Antoniou, A., Guney, Y., & Paudyal, K. (2008). The determinants of capital structure: Capital market-oriented versus bank-oriented institutions. Journal of Financial and Quantitative Analysis, 43(1), 59–92.
- Batten, J., & Vo, X.V. (2018). Liquidity and firm value in an emerging market. The Singapore Economic Review, 64(2), 365–376.
- Bevan, A.A., & Danbolt, J. (2004). Testing for Inconsistencies in the Estimation of the UK Capital Structure Determinants. Applied Financial Economics, 14(1), 55–66.
- BMGV’s Vietnam 2018 Food and Beverage Survey (2018). Retrieved from https://bbgv.org/wp-content/uploads/2018/06/Vietnam-Food-Drink-Sector-Brief-BBGV-July2718.pdf
- Booth, L., Aivazian. V., Demirguc-Kunt, A., & Maksimovic, V. (2001). Capital structures in developing countries. The Journal of Finance, 56(1), 87–130.
- CFA Institute’s VFA program level II, training Documentary (2019). Retrieved from https://www.cfainstitute.org/
- Chadha, S., & Sharma, A.K. (2016). An empirical study on capital structure in Indian manufacturing sector. Global Business Review, 17(2), 411–424.
- Charalambakis, E.C., & Psychoyios, D. (2012). What do we know about capital structure? Revisiting the impact of debt ratios on some firm-specific factors. Applied Financial Economics, 22(20), 1727-1742.
- Chowdhury, A. & S.P. Chowdhury (2010). Impact of capital structure on firm’s value: Evidence from Bangladesh. Business and Economic Horizons, 3(3), 111–122.
- Dang, C., Li, Z.F., & Yang, C. (2017). Measuring firm size in empirical corporate finance. Journal of Banking & Finance, 86(C), 159-176.
- Dang, V.A. (2011). Testing capital structure theories using error correction models: Evidence from the UK, France and Germany. Applied Economics, 45(2), 171–190.
- Danis, A., Rettl, D.A., & Whited, T.M. (2014). Refinancing, profitability and capital Structure. Journal of Financial Economics, 114 (3), 424–443.
- Damayanti, S.M., Mulyono, J.J., & Mutaqi, I. (2017). The optimal capital structure: An empirical study of Indonesia company in the food and beverage industry. Journal of Ekonomi Dan Bisnis, 4(2), 93-106.
- Dhankar, R.S., & Boora, A.S. (1996). Cost of capital, optimal capital structure, and value of firm: An empirical study of Indian companies. The Journal for Decision Makers, 21(3), 29–36.
- Flannery, M.J., & Rangan, K.P. (2006). Partial adjustment toward target capital structure. Journal of Financial Economics, 67(2), 217-248.
- Feidakis, A., & Rovolis, A. (2007). Capital structure choice in European Union: Evidence from the construction industry. Applied Financial Economics, 17(12), 989–1002.
- Frank, M.Z & V.K. Goya (2008). Trade-off and Pecking order theories of debt-Handbook of Corporate Finance. Empirical Corporate Finance, 2(1),1-82.
- Fumani, M. A & A. Moghadam (2015). The effect of capital structure on firm value, the rate of return on equity and earnings per share of listed companies in Tehran stock exchange. Research Journal of Finance and Accounting, 6(15), 50-57.
- Gharaibeh, A.M. (2017). Factors influencing firm value as measured by the Tobin's Q: Empirical evidence from the Saudi stock exchange (TADAWUL). International Journal of Applied Business and Economic Research, 15(6), 333–358.
- Graham, J.R., & Leary, M.T. (2011). A review of empirical capital structure research and directions for the future. Annual Review of Financial Economics, 3(1), 309-345.
- Graham, J.R., & Tucker, A.L. (2006). Tax shelters and corporate debt policy. Journal of Financial Economics, 81(3), 563-594.
- Harris, M., & Raviv, A. (1991). The theory of capital structure. Journal of Finance, 46(1), 297-355.
- Hatfield, B.G., Cheng, T.W., & Davidson, N.W. (1994). The determination of optimal capital structure: Effect of firm and industry debt ratio on market value. Journal of Financial Strategic Decision, 7(3), 1-14.
- Hennessy, C.A., & Whited, T.M. (2005). Debt dynamics. Journal of Finance, 60(3), 1129-1165.
- Hill. R.C., Griffiths, W.E., & Lim, G.C. (2011). Principles of econometrics. (4th eds.,). John Wiley & Sons Inc.
- Holderness, C.G., & Sheehan, D.P. (1985). Raiders or saviors? The evidence on six controversial investors. Journal of Financial Economics, 14(4), 555-579.
- Jensen, M.C., & Meckling, W. (1976). Theory of the firm: Managerial behavior, agency costs and capital structure. Journal of Financial Economics, 3(4), 305-360.
- Kraus, A. & Litzenberger, R.H. (1973). A state-preference model of optimal financial leverage. The Journal of Finance, 28(4), 911-922.
- Kuma, R. (2018). Determinants of capital structure: A case study of food and beverages industry in India. Retrieved from https://www.researchgate.net/publication/321109159_Determinants_of_Capital_Structure _A_ case_study_of_Food_and_Beverages_Industry_in_India/link/5a0dc664a6fdcc2b5b5de52c/download
- Lemmon, M.L., Roberts, M.R., & Zender, J.H. (2008). Back to the beginning: Persistence and the cross-section of corporate capital structure. Journal of Finance, 63(4), 1575-1608.
- MacKay, P., & Phillips, G.M. (2005). How does industry affect firm financial structure?. Review of Financial Studies, 18(4), 1433-1466.
- Modigliani, F., & Miller, M.H. (1958). The cost of capital, corporation finance and the theory of investment. American Economic Review, 48(3), 261-297.
- Modigliani, F., & Miller, M.H. (1963). Corporate income taxes and the cost of capital: A correction. American Economic Review, 53(3), 433-443.
- Muradoglu, Y.G., & Sivaprasad, S. (2011). Capital structure and abnormal returns. International Business Review, 21(3), 328–341.
- Myers, S. (1984). The Capital structure Puzzle. The Journal of Finance, 39(3), 574-592.
- Myers, S., & Majluf, N. (1984). Corporate financing and investment decisions when firms have information that investors do not have. Journal of Financial Economics, 13(2), 187-221.
- Ogbulu, M.O., & Emeni, K.F. (2012). Capital structure and firm value: Empirical evidence from Nigeria. International Journal of Business and Social Science, 3(1), 103-111.
- Pandey, I.M. (2004). Financial management. Vikas Publishing House, Pvt. Ltd, New Delhi, pp. 517-540.
- Parrino, R., Kidwell, D.S., & Bates, T. (2012). Fundamentals of corporate finance. (2nd eds.,). Corporate Governance, H Kent Baker and Ronald Anderson (editors), John Wiley & Sons Inc.
- Purwohandoko (2017). The Influence of firm’s size, growth, and profitability on firm value with capital structure as the mediator: A study on the agricultural firms listed in the Indonesian stock exchange. International Journal of Economics and Finance, 9(8), 103-110.
- Rajan, R., & Zingales, L. (1995). What do we know about capital structure? Some evidence from international data. The Journal of Finance, 50(5), 1421-1460.
- Shah, S.Z.A., & Kausar, J. (2012). Determinants of capital structure of leasing companies in Pakistan. Applied Financial Economics, 22, 1841–1853.
- Siahaan, U.M., & Handayani, S.R. (2014). The influence of company size and capital structure towards liquidity, corporate performance and firm value for large and small group companies. European Journal of Business and Management, 6(18), 148-156.
- Stulz, R. (1998). Management control of voting rights: Financing policies and the market for corporate control. Journal of Financial Economics, 20(1), 25-54.
- Titman, S. & Tsyplakov, S. (2007). A dynamic model of optimal capital structure. Review of Finance, 11(3), 401-451.
- Titman, S., & Wessels, R. (1988). The determinants of capital structure choice. The Journal of Finance, 43(1), 1-19.
- The World Bank’s Overview (2019). Retrieved from https://www.worldbank.org/en/country/vietnam/overview
- Trautwein, F. (1990). Merger motives and merger prescriptions. Strategic Management Journal, 11(4), 283–295.
- Vo, X.V. (2017). Determinants of capital structure in emerging markets: Evidence from Vietnam’, Research in International Business and Finance, 40, 105–113.
- Vo, X.V. & Ellis, C. (2017). An empirical investigation of capital structure and firm value in Vietnam. Finance Research Letters, 22(C), 90–94.
- Voulgaris, F., Asteriou, D., & Agiomirgianakis, G. (2004). Size and determinants of capital structure in the Greek manufacturing sector. International Review of Applied Economics, 18(2), 247–262.
- Wiwattanakantang, Y. (1999). An empirical study on the determinants of the capital structure of Thai firms. Pacific-Basin Finance Journal, 7(3), 371–403.