Research Article: 2018 Vol: 22 Issue: 1
The Relevance/Reliability Impact the Financial Crisis and SFAS 161 Had on the Use and Reporting of Derivatives within the Banking Industry
David Caban, Rollins College
Keyword
Derivatives, Bank Holding Companies, SFAS 161, Financial Crisis.
Introduction
This paper investigates the impact the 2008 Financial Crisis and contemporaneous disclosure requirements, under SFAS 161, had on the value relevance of the notional amounts of derivatives. In particular, the paper examines the association between changes in notional amounts of derivatives and changes in share prices within the banking industry and compares how this association has changed during the periods before and after these events. Derivatives are classified by general purpose, risk management vs. trading and bank holding companies (BHC) by market making and nonmarket making banks in an effort to identify differential effects the events may have had within each category.
The research questions addressed are important for a number of reasons. First, the use of derivatives has increased dramatically over the past several years, while research on the relevance of notional amounts has remained stagnant. During the time period sampled in this study, the total notional amount of derivative contracts held by the top 25 BHCs increased fivefold from $48.1 trillion dollars in the first quarter of 2002 to $236.6 trillion dollars in the last quarter of 2015. Investors have diverse opinions on the benefits of derivatives. For example, in 2002 and 2003, respectively, in his annual letters to shareholders, Warren Buffet, Chairman of Berkshire Hathaway Inc., referred to derivatives as time bombs and financial weapons of mass destruction (Berkshire Hathaway Inc. Shareholder Letters 2002, 2003). Meanwhile, in May of 2005, Alan Greenspan, then Chairman of the Federal Reserve Board, stated that the use of derivatives were key factors underpinning the resilience of our large banking institutions which permitted the unbundling of financial risks (FRB, Forty-First Annual Conference on Bank Structures, 2005). These diverse opinions are reflective of the contradicting views market participants have on derivatives. Because the use of derivatives has increased so dramatically in recent years, opinions are so diverse and historical accounts of their benefits and detriments are confounding, it is imperative to re-examine their association with firm value after potential influential events have transpired and to understand how they relate to prior associations.
Second, the banking industry has undergone major structural and regulatory changes in recent years. Investment banks such as Morgan Stanley, Goldman Sachs, Merrill Lynch and Bear Stearns either became or were merged into a BHC during the Financial Crisis. This has increased the heterogeneity within this industry. Though prior research in the banking industry has generally distinguished between large and small banks, research examining the value relevance of notional amounts derivatives has not made such distinctions.
This study considers two contemporaneous events that transpired during 2008 and 2009 hypothesized to affect the markets perception of the relevance and reliability of derivative instruments and related reporting, respectively. The first event considered is the 2008 Financial Crisis. This crisis, which began mid-year 2007 and culminated at the end of 2008, resulted in the collapse of some of the most reputable financial institutions. The effects of the crisis were not limited to the banking industry; almost all industries were adversely affected by the crisis. Much has been written about the crisis by regulators, academicians and others in an effort to offer insight on the causes and remedies. Research on the causes of the crisis usually includes an examination of the role derivatives played. Kothari and Lester (2012) find that the rising popularity of derivative instruments contributed to the advent of the 2008 financial crisis. Barth and Landsman (2010) examine four areas, which may have potentially played a role in the crisis: Fair values, asset securitization, derivatives and loan loss provisions. While they do not precisely define the role derivatives played in the markets as overall positive or negative, they recommend more disaggregated information and increased transparency in the disclosures; an area directly related to the second event considered.
The second event considered is the pronouncement of SFAS No. 161 disclosures about Derivative Instruments and Hedging Activities effective beginning in 2009. An often overlooked fact was that SFAS No. 133 did not carry forward SFAS No. 119 requirement for disclosures of notional amounts of derivatives because the FASB believed then that the enhanced disclosures of SFAS No. 133 would obviate their need. Notional amounts give market participants an idea of the extent of involvement in derivatives (FASB, 1990). Notional amounts are not actually exchanged between parties, but they are an integral part in the computational formula used to determine the periodic cash flows that are paid or received during the life of the contract (Seow and Tam, 2002). SFAS No. 161 not only re-introduced the requirement that such disclosures on notional amounts of derivatives be presented in the notes to the statements but also required that the information be presented in a simple to follow tabular format (Exhibit 1).
| Exhibit 1: Sample Disclosure Note Required Under Sfas 161 | ||||||
| SunTrust Banks, Inc. Notes to the Consolidated Financial Statements, continued |
||||||
|---|---|---|---|---|---|---|
| As of December 31, 2012 | ||||||
| Asset Derivatives | Liability Derivative s | |||||
| (Dollars in millions) | Balance Sheet Classifications | Notional Amounts | Fair Value | Balance Sheet Classifications | Notional Amounts | Fair Value |
| Derivatives designated in cash flow hedging relationships | ||||||
| Interest rate contracts hedging | ||||||
| Floating rate loans | Trading assets | $17,350 | $771 | Trading liabilities | $-- | $-- |
| Total | 17,350 | 771 | -- | -- | ||
| Derivatives designated in fair value hedging relationship | ||||||
| Interest rate contracts covering | ||||||
| Fixed rate debt | Trading assets | 1000 | 61 | Trading liabilities | -- | -- |
| Total | 1,000 | 61 | -- | -- | ||
| Deivatives not designated as hedging instruments | ||||||
| Interest rate contracts covering: | ||||||
| Fixed rate debt | Trading assets | -- | -- | Trading liabilities | 60 | 10 |
| MSRs | Other assets | 6,185 | 150 | Trading/Other liabilities | 12,643 | 33 |
| LIFS, IRLCs | Other assets | 2,333 | 6 | Other liabilities | 7,076 | 15 |
| Trading activity | Trading assets | 81,930 | 6,044 | Trading liabilities | 86,037 | 5,777 |
| Foreign exchange rate contracts covering: | ||||||
| Commercial loans | Trading assets | -- | -- | Trading liabilities | 34 | -- |
| Trading activity | Trading assets | 2,451 | 66 | Trading liabilities | 2,326 | 63 |
| Credit contracts covering: | ||||||
| Loans | Trading/Other assets | -- | -- | Other liabilities | 445 | 8 |
| Trading activity | Trading assets | 1,958 | 55 | Trading liabilities | 2,081 | 49 |
| Equity contracts-Trading activity | Trading assets | 15,748 | 1,342 | Trading liabilities | 22,184 | 1,529 |
| Other contracts: | ||||||
| IRLCs and other | Trading/Other assets | 6,783 | 132 | Other liabilities | 142 | 1 |
| Commodities | Trading assets | 255 | 29 | Trading liabilities | 255 | 29 |
| Total | 117,643 | 7,824 | 133,283 | 7,514 | ||
| Total derivatives | $135,993 | $8,656 | $133,283 | $7,514 | ||
While this information may have been available through other sources, the markets perception of reliability may differ by source. Ahmed et al. (2006) find that recognized derivative fair values are value relevant while similar disclosed fair values are not. They pose two possible explanations for this, the “limited attention” and “costly information processing models” or perceived higher standards required by auditors for recognized items versus those disclosed. In similar fashion, the new tables required by SFAS 161 may help investors overcome the “costly information processing”. While SFAS 161 does not make any changes between recognized and disclosed information, the new tables make the information much easier to reconcile and track with recognized data. This may cause management and auditors to impose higher standards of reliability in similar fashion to recognized data. Auditing enhances the credibility of financial statement information (Kohlbeck 2008) and these new tables incentivize the auditor to perform enhanced auditing techniques, bringing them closer to the reliability spectrum of recognized financial data. In summary, SFAS 161 reintroduced the requirement to explicitly disclose notional amounts of derivatives and made derivative information, in general, easier to read and interpret; factors this study hypothesizes have led to greater information reliability.
Risk management derivatives serve to reduce risk within a firm by offsetting the risk of an economic event affecting the firm in the future. The uniqueness of these financial instruments is that they reduce risk without affecting the expected returns at a low implementation cost. Therefore, with the Financial Crisis stressing the importance of managing risk properly and new disclosures potentially increasing the reliability of derivative disclosures, the expectation is for these derivatives to be positively associated with firm value and that the studied events have increased their value relevance. Trading derivatives, on the other hand, are not intended to reduce risk. They are, however, a source of core revenues for market making banks and their risk can be properly managed. On the other hand, they represent only transitory revenues for nonmarket making banks. For these reasons, it is hypothesized that trading derivatives will be relevant only to market making banks in both periods studied. While the expectation is for the aforementioned events to affect the value relevance of trading derivatives, no prediction is made on the direction. This is because the effect depends on how the Financial Crisis affected market perception of the relative benefits and risks of such derivatives. Thus, the general expectation is that these events affected the associations between notional amounts and share prices differently; based on derivative and bank categories. Two complimentary pooled regression tests are performed to examine the differences in investor valuation of notional amounts of derivatives
before and after the Financial Crisis/SFAS 161. The first test serves to examine the value relevance difference between the pre and post periods and any differential association related to derivative type, risk management vs. trading. The second test examines the value relevance of these notional amounts both by derivative and bank category to ascertain if there is a differential effect of pre and post associations within the bank categories for both derivative categories.
When examined at the overall bank level, the study finds that risk management derivatives shift from insignificant to significant and trading derivatives are given incrementally more value relevance after the events. This is consistent with the idea that the financial crisis may have increased their relevance; while SFAS 161 may have increased the reliability on related reported information. When examined at the bank category level, results are consistent with an implied “bailout” effect for market making banks as risk management derivatives go from being significant to insignificant, for these banks in particular. This may be a reflection of investors perception that these banks will be “bailed out” should any catastrophic adverse event occur; thus the function these derivatives perform are less valuable to investors. Association with firm value for risk management derivatives appears to be stronger for nonmarket making banks, while associations for trading derivatives are stronger for market making banks. Overall, the findings confirm that the events studied affect the association between derivatives and firm value differentially when they are segregated by bank and derivative classifications.
This paper contributes to the literature by examining the effects the financial crisis and contemporaneous new disclosures have on the value relevance of notional amounts of derivatives. There have been no major studies on the relevance of notional amounts subsequent to these events. Furthermore, this paper shows that inferences made when examining the association between derivatives and firm value should not be limited to derivative classifications only. While prior research in this area has examined relationships by derivative classification and classified banks into “large” and “small” categories, there is no research examining the relationship by the bank classifications used within this study. Recent entrants into the banking industry, now classified as BHC, have stressed the importance of making such a distinction as they have increased the heterogeneity within the banking industry beyond “large” and “small”. Future research may consider a second category besides “large” and “small”; those whose main revenues derive from trading activity (or noninterest income) and the more conventional banks whose major revenue streams are derived from loans and deposits. With the increased use of derivatives and their potential to impact firm valuation in a sudden and extreme manner, it is important to understand how certain events have affected the markets perception of their usage and how new accounting promulgations affect users’ perception of the reliability of reported data.
The remainder of this paper is organized as follows: Section II describes the evolution of derivative accounting standards and related research. Section III provides a review of the theories that motivate the hypotheses. The research design is developed in Section IV. Section V describes the sample data and provides results. The final section presents concluding remarks summarizing the papers findings.
Derivative Accounting And Related Research
Current State of Derivative Accounting
Currently derivative accounting is governed by SFAS No. 133, Accounting for Derivative Instruments and Hedging Activities and its amendment, SFAS No. 161 Disclosures about Derivative Instruments and Hedging Activities. SFAS No. 133 became effective on June 16, 1999. This statement is widely considered the most complex accounting standard ever passed by the FASB. The banking industry was opposed to its implementation, claiming that it would increase the volatility of their financials while ironically also claiming the information was already public due to the requirements of SFAS No. 107 and SFAS No. 119 (Duangploy and Helmi, 2002). This statement establishes the criteria for which a derivative may be classified as a hedging derivative (risk management) or a trading derivative; to which different accounting rules apply. Among its biggest changes from prior statements is the requirement that the fair values of derivatives be recognized on the statement of financial position as either assets or liabilities. Gains and losses are recognized as profit or losses or as part of comprehensive income depending on the derivative classification. SFAS No. 133 did not carry forward SFAS No. 119 requirement for disclosures of notional amounts of derivatives because the FASB believed then that the enhanced disclosures of SFAS No. 133 would obviate their need.
SFAS No. 161 became effective for financial statements issued after November 15, 2008. This statement re-introduced the requirement that notional amounts of derivatives be disclosed in the notes to the financial statements. The statement requires enhanced disclosures relating to derivatives and thus improves the transparency of derivative disclosures. The biggest contribution of this statement is that it required that information relating to the type of risk, accounting designation, fair values, gains and losses and location on the statements be presented in tabular format in the disclosure notes. This format represents a vast improvement on the organization of such information from prior standards. To illustrate these improvements in disclosures, a sample disclosure table for SunTrust Bank (one of the sample banks) is reproduced in Exhibit 1. Whether these improved disclosures increase the relevance/reliability of notional amounts of derivatives is at the heart of this study.
The Evolution of Derivative Accounting prior to SFAS 133 and 161
Motivated by the increasing complexity of financial instruments and their poor disclosures, the FASB initiated a long term project, in May of 1986. At the onset of this initiative, guidance on derivative disclosures was provided by SFAS 52 and SFAS 80. These standards, however, lacked consistent application, did not provide the transparency required and at times provided conflicting guidance (Duangploy and Helmi, 2002). Among the first statements issued under the new initiative was SFAS No. 105, issued in 1990, which required that all entities disclose information about any financial instruments with off-balance sheet risk of accounting loss. SFAS No. 105 specifically mentions the value of notional amounts as a measure of overall derivative risk exposure. Prior research points to paragraph 89 of SFAS No. 105 as motivation for the use of such a proxy: 89. The Board concluded that disclosing information about the face or contract amount (or notional principal amount) of financial instruments with off-balance-sheet risk provides a useful basis for assessing the extent to which an entity has open or outstanding contracts. The disclosure of that amount is intended to apprise investors, creditors and other users that the entity is engaged in certain activities whose off-balance-sheet risk is beyond what is currently recognized in the statement of financial position. The face or contract amount gives investors and creditors an idea of the extent of involvement in transactions that have off-balance-sheet risk (emphasis added). That information conveys some of the same information provided by amounts recognized for on-balance-sheet instruments (FASB, 1990).
SFAS No. 107 followed and became effective in 1992. This statement extended the fair value disclosures to include all types of derivatives with potential of accounting losses not previously required. It did not amend any requirements related to notional amount disclosures. In 1994, the FASB issued SFAS No. 119 which required separate disclosures of the fair values of derivatives from other financial instruments. This standard also required the distinction between trading derivatives and risk management derivatives. Furthermore, it expanded disclosure requirements for all derivatives, even if they do not have potential for accounting losses, such as options. SFAS No. 119 was then followed by SFAS No. 133 and No. 161 described earlier in this section.
Pre-Crisis Research
Because research specifically examining the relationship between notional amounts of derivatives and firm value is limited, a brief summary of related research is offered first. Most research examining the relationship between derivatives and firm value focus on the fair values of derivatives; either recognized or disclosed.
Three major studies were published in 1996 examining the relationship between fair value disclosures under SFAS No. 107 and bank share prices. Barth et al. (1996) found that fair values on loans, securities and long-term debt disclosed under SFAS No. 107 were consistently significant in providing explanatory power for bank price movements while the fair value of derivatives were not. Eccher et al. (1996) found that fair value disclosures on financial instruments were value relevant only under limited conditions, while Nelson (1996) found that reported fair values of financial instrument were value relevant but off-balance sheet financial instruments, which would include derivatives, were not found to be value relevant. Ahmed et al. (2006) supports the SFAS No. 133 requirement to recognize, rather than disclose, the fair values of derivatives. The study compares the value relevance of derivatives for banks that have both recognized and disclosed derivatives prior to SFAS No. 133. Furthermore, it examines the value relevance of derivatives for banks that only disclosed prior to SFAS No. 133 and subsequently recognized after SFAS No. 133. In both cases, they find that recognized fair values were value relevant while those disclosed were not.
The literature examining the relationship between notional amounts of derivatives and firm valuation is less extensive. Using disclosures under SFAS No. 105, Riffe (1996) and McAnally (1996) both find a positive relationship between notional values of derivatives and bank equity values. However, both of these studies focused on loan commitments and swaps. Venkatachalam (1996), using disclosures under SFAS No. 119, provides evidence that the fair value estimates for derivatives are value relevant and provide incremental explanatory power above their notional amounts. The study also provides evidence that notional amounts are negatively correlated with bank equity values. Furthermore, Venkatachalam breaks out notional amounts by risk management and trading derivatives and finds that while risk management derivative notional amounts are significant, the notional amounts of trading derivatives are not. A limitation of Venkatachalams study is that it is limited to only two years of data and less than 200 observations. Seow and Tam (2002) examine the value relevance of fair values of derivatives and notional amounts using a returns-regression framework. While they find that the fair value of derivatives is value relevant, they do not find any evidence of notional amounts being value relevant. A limitation of their study is that they only use 106 observations. Furthermore, their design appears flawed in that they assign banks to hedging and non-hedging groups and run two separate regressions for each group to test the relevance by derivative category, but many banks possess both types of derivatives which could lead to wrong inferences. Wang et al. (2005) examine if notional amounts under SFAS 133 provide incremental value above and beyond earnings and book value. They find mixed results, with notional amounts of trading derivatives being significant but related gains/losses not being significant. For the non-trading category, they find that only the notional amount of foreign exchange derivatives is significant at the 5% level, while those for interest rate derivatives are not significant at this level. This study also only uses two years of SFAS 133 data and combines it with six years of SFAS 119 disclosures.
Many of these studies acknowledge their limitations and call for future research extending their contributions. None of these studies distinguish between bank characteristics that may alter the relevance of each type of derivative. Furthermore, there have been no major studies examining how SFAS No. 161 may have affected the reliability perception of such disclosures.
Post Crisis Research
Van Der Stede (2011) reflects on how the financial crisis, with the regulatory reforms and augmented disclosures it spawned, will affect accounting research. The study focuses on how these changes have affected internal management practices and concludes that research on how the crisis has affected incentives and risk management offers the greatest research opportunities. In particular, this paper invites researchers to focus on financial institutions and the challenges new disclosures pose for them. Following the paper’s advice, there was an explosion in derivative research and its effect on firms. This increase, however, was greatly concentrated on credit default swaps (CDS); probably because these were often mentioned as contributors to the crises. Thus, post-crises research can be divided into two general categories: CDS research and the more general derivative hedging strategies research.
Saretto and Tookes (2013) examine how CDS affect a firm’s capital market structure. They find that firms with CDS contracts initiated on their debt are able to raise more capital through the debt market and obtain longer maturities. Subrahmanyam et al. (2014) use CDS to examine the relationship between the use of CDS and firm credit risk as expressed by rating downgrades or bankruptcy filings. Surprisingly, they find that the use of CDS actually increases the firms’ credit risk. Shan et al. (2015) examine how the use of CDS affects debt covenant agreements. They propose that because CDS can be used as a means to protect the lender from the credit risk of their borrowers, banks reduce their monitoring rigor. The paper finds that borrowers with CDS outstanding face less strict debt covenant restrictions because of this. In similar fashion, Chakraborty et al. (2015) analyse the relationship between loans extended to firms with CDS initiations and a lenders moral hazard. The paper speculates that the introduction of CDS leads banks to relax their monitoring mechanisms. The paper finds that, while CDS firms pay a higher spread than non-CDS firms, they do not go bankrupt at a higher rate. Following the same theme, Martin and Roychowdhury (2015) investigate whether the initiation of CDS on a borrower’s debt leads to the reduction in conservative financial reporting by that firm. The paper contends and finds that, because CDS provide lenders with protection against negative credit outcomes, the banks monitoring motivation is reduced leading to less conservative accounting practices. Boehmer et al. (2015) extends these studies to examine how the initiation of CDS on a firm affects their equity. Because the initiation of CDS is associated with reduced monitoring by credit holders, the paper proposes and finds that there exists a spill-over effect to the equity markets. More specifically, firms with CDS initiations exhibit lower liquidity and less efficient pricing on their equity. In one of the latest papers addressing the effects of CDS, Amiran et al. (2017) study the effects the introduction of CDS trading for an entity’s debt has on the syndicated loan market for the loans held by the firm. They find that when CDS trading is initiated, underlying loans are deemed riskier. They contend that CDS trading reduces the effectiveness of the lead lender in addressing adverse selection problems. Thus, the general theme of these papers is that the initiation of CDS on a firms’ debt lead to several adverse selection and moral hazard problems. The main catalyst for these negative effects is the fact that the lenders can transfer credit risk, leading to a reduction of one of the main monitoring mechanisms in the market.
The stream of literature focusing on the general use of derivatives as risk management tools during the post-crisis period begins with Chen (2011). This paper, using a large sample of hedge funds, which trade derivatives, examines the relationship between derivative use and risk after the financial crisis. It finds that derivative users exhibit lower funds risk. Beneda (2013) examines the relationship between derivative use and reported earnings volatility. A well-implemented derivative strategy should decrease earnings volatility, all things equal. Results show a strong correlation between the firm’s use of derivatives and a reduction in earnings volatility. Treanor et al. (2014) show that while the use of hedging through operational strategies is more effective than through derivatives, derivative hedging is less expensive, easier to implement and can be used as a fine tuning risk hedging mechanism to compliment operational hedging strategies. Both Nguyen and Liu (2014) and Chaudhry et al. (2014) show that derivatives can be effectively used to manage interest rate and foreign exchange risk. Both studies find that firms employing derivative strategies are more profitable and less risky than their counterparts that do not employ a derivative hedging strategy. Choi et al. (2015) show that changes in accounting rules regarding derivatives can influence managerial practices related to reporting earnings. They investigate how the promulgation of FAS 133 affected the use of derivatives as an earnings-smoothing mechanism. They find that FAS 133 attenuated the use of derivatives as a smoothing mechanism. Cassar and Gerakos (2017) examine hedge funds risk management practices, including risk management through derivatives, during the financial crisis. They find that funds using formal risk models performed significantly better during the worst months of 2008.
In summary, the latest research on derivatives has shown mixed results pertaining to the use of derivatives. The line of research focusing on CDS show that using derivatives may have the unintended consequence of making the firm riskier, while the recent research on risk management with derivatives has shown some success in reducing a firms risk profile. Various papers call for renewed research on derivative use after the financial crisis. While these papers answer the call, most of them rely on data covering both the pre and post periods studied in this paper. Thus, they are limited in that none of them take into consideration the possibility that practices and perceptions may have been altered by the aforementioned events. An extension to most of these papers could be to see if results hold when segregating the data into pre and post period samples. This paper contributes towards this literature in that it reaffirms the need to do so.
Theory And Hypotheses Development
Theory
The notional principal amount is the most commonly used volume measure of derivatives and foreign exchange contracts. Notional amounts are not actually exchanged between parties, but they are an integral part in the computational formula used to determine the periodic cash flows that are paid or received during the life of the contract (Seow and Tam 2002). These amounts are directly related to the leverage introduced by derivatives which make them more volatile than their underlying asset. By simply increasing a notional amount, periodic payments or receipts are increased without actually exchanging additional funds.
Anecdotal evidence of the detrimental effects this leverage and volatility can introduce is vast. For instance, AIG was at the centre of the Financial Crisis because they magnified their risk by selling derivatives without properly offsetting their positions (Barth and Landsman 2010). Barings PLC, the oldest merchant bank in Great Britain, declared bankruptcy in 1995 after a rogue trader speculated and lost large amounts on Nikkei-225 stock index futures and options (Kuprianov 1995). While negative instances of derivative use affect market perception because they receive great attention by the press, their occurrences are small relative to the vast use of derivatives. The benefits of derivative use, while often ignored by less sophisticated investors, are often appreciated by those with more knowledge on the matter. For instance, in May of 2005, Alan Greenspan, then Chairman of the Federal Reserve Board, stated that the use of derivatives were key factors underpinning the resilience of our large banking institutions which permitted the unbundling of financial risks (FRB, Forty-First Annual Conference on Bank Structures, 2005). The diversity in opinions and outcomes on the use of derivatives is related to how effectively their risk is managed.
The discounted cash flow (DCF) model is one of the most fundamental and commonly used methodologies to determine asset values. It is based on the theory that the value of any asset is equivalent to the present value of expected future cash flows (or returns) discounted at a rate that compensates the investor for the time value of money and a risk premium (Fama, 1977). Robichek and Myers (1966) extend this model to the “certainty equivalent model” but the general concept is unchanged.
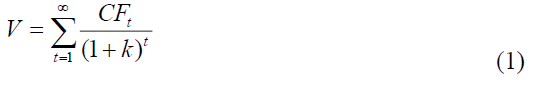
Where:
V=Present Value of an Asset
CFt=Expected Cash Flow at time t
k=is the required rate of return, a function of time value of money and risk
From the formula above, it can be seen that any financial instrument capable of reducing the overall risk while maintaining expected cash flows constant should increase the value of an asset. In prior sections of this paper derivative characteristics were described on a stand-alone basis. The main implication of this description is that they tend to add more leverage and increase volatility on a stand-alone basis. But risk within both categories of derivatives, risk management and trading derivatives, should not be viewed on a stand-alone basis. Idiosyncratic risks of individual derivatives are usually properly managed. Risk management derivatives are used to offset the risk of another economic event; usually an asset, liability or future commitment. When viewed in this portfolio context, they reduce the overall risk of a firm while maintaining expected returns. The risk introduced by trading derivatives is not inherently offset by another economic event associated with the firms’ future cash flows, but their risk is usually properly managed. Most firms manage the risk within the trading category by trading an offsetting position, permitting the firm to obtain valuable trading revenues on each side of the transactions without substantially increasing their overall risk. This assumption is strongly supported by the correlation of changes in fair values of trading assets and liabilities presented in Table 2 Pearson and Spearman Correlation Coefficients which is above 0.999; indicating that positive changes (assets) in the values of trading derivatives are offset by negative changes (liabilities) in the values of trading derivatives.
Complementing the above theory, the differential earnings response coefficients theory is used to develop hypotheses 3 and 4. An explanation for the weak returns-earnings relation is that earnings contain a transitory component which is either value irrelevant or contains very little valuation impact (Basu, 1997; Hayne, 1995; Hoskin et al., 1986; Ramesh and Thiagarajan, 1993; Ramakrishnan and Thomas, 1993). Markets will give higher value relevance to those earnings they view as a permanent part of a firms? core business. Thus, the value relevance of trading derivatives may be different depending on the markets perception of their nature, permanent vs. transitory, in relation to the bank category.
Hypotheses Development
Market perceptions on the effectiveness of corporate strategies and reliability of financial data are often affected by external events. Areas where diverse opinions exist, due to the complexities of the issues examined, are relatively more susceptible to general changes in market opinions following such events. This paper examines two events that could have potentially affected the markets perception on effectiveness of derivative strategies and the reliability of related disclosures.
SFAS No. 105 supports the view that notional amounts can give investors and creditors an idea of the extent of involvement in transactions that have off-balance-sheet risk (FASB, 1990). While SFAS No. 105 is not effective during the sample period studied, this view is supported by the re-introduction of the requirement to disclose notional principal amounts by SFAS No. 161. The fact that the requirement had not been carried forward by SFAS No. 133 increases the likelihood that the re-introduction of such requirement has provided incremental reliability and relevance to the data. Though this data was available through other sources, mainly Federal Regulator databases with call report information, market perceptions of reliability may differ. In particular, these disclosures are now subject to more scrutiny as private audit firms are now responsible for verifying their reliability and reconciling them with the data presented on the face of the statements.
The growing use of derivatives during the past years is likely to make such instruments more relevant in determining valuation in the banking industry. Improved disclosures may make the information more reliable. Recent events may have altered market perception of their use. Two events that may have affected the association between notional amounts of derivatives and firm valuation in the banking industry are considered.
The first event is the 2008 Financial Crisis. Derivative use has been associated with the crisis. While the press has focused on their negative implications, it is not entirely clear the effect the crisis had on the overall market perception of derivatives. The crisis may have diminished the markets confidence in the ability of firms to properly implement derivative strategies or it may have accentuated the need for risk management strategies using derivatives in the eyes of the markets. Furthermore, these effects may be different for risk managing derivatives versus trading derivatives. The markets may view the crisis as proof that firms do not properly manage the risk within the trading category or may appreciate the additional regulation imposed and survivorship of stronger players in this arena.
The second event considered is the promulgation of SFAS No. 161. SFAS No. 161 not only re-introduced the requirement that such disclosures on notional amounts of derivatives be presented in the notes to the statements but also required that the information be presented in a simple to follow tabular format. This statement may potentially incentivize auditors to perform enhanced auditing techniques on such disclosures; serving to increase their reliability and thus strengthening the association between derivatives and firm valuation. Unlike the financial crisis, the effects of this event should only have positive implications for the relevance of such disclosures towards firm valuation.
Therefore, in keeping with the pre-established theory that risk management derivatives serve to reduce firm risk while maintaining expected returns, the first hypothesis, relating to risk management derivatives without distinction to bank category is stated as follows.
H1: Notional amounts of risk management derivatives will be positively associated with share price changes in both periods.
It is further hypothesized that the financial crisis, its subsequent stricter regulations and improved accounting disclosures have increased the positive association in a significant manner in the post period versus the pre-crisis period. Therefore, the second hypothesis is as follows.
H2: The effects of the financial crisis and improved post crisis disclosures, through SFAS 161, will increase the positive association between notional amounts of risk management derivatives and share prices in the post period.
Though no distinctions are made between bank categories for the first two hypotheses relating to risk management derivatives, this distinction will be necessary when examining trading derivatives. Trading derivatives are a major source of revenues for market making banks. These banks are the main traders of such derivatives, charging substantial fees for such transactions. Thus for these banks, revenues derived from the trading of derivatives are considered permanent in nature. On the other hand, trading derivatives are rarely used as a permanent revenue source by nonmarket making banks. Core revenues from non-market making banks are derived mostly from the issuance of loans and deposits. Therefore, any revenues derived from trading derivatives by nonmarket making banks are considered temporary in nature. Following prior research establishing that markets give higher relevance to those earnings they view as a permanent core part of a business entity, it is hypothesized that trading derivatives will only be value relevant for market making banks. No predictions are made on the direction of the change due to the confounding effects the Financial Crisis may have had on the markets perception. Thus the third hypothesis is stated as follows.
H3: Trading derivatives are value relevant only for market making banks in both periods.
Finally, as with risk management derivatives, it is hypothesized that the improved disclosure will increase the value relevance of the notional amounts of trading derivatives. This increase in value relevance will only affect market making banks due to the different nature of earnings (transitory vs. permanent) between both bank categories, as previously mentioned. Therefore, the fourth and final hypothesis is stated as follows.
H4: The value relevance of trading derivatives will increase in the post crisis period only for market making banks.
Research Design
A cross-sectional pooled regression model based on Ohlson’s (1995) valuation framework is estimated to assess the association between notional amounts of derivatives and firm valuation. In particular, it examines if changes in notional amounts of derivatives provide incremental information explaining changes in share prices above and beyond that provided by earnings and book value. While there are various banking models used in prior research, these models tend to incorporate banking specific categories such as loans and deposits among their control variables. Due to the heterogeneous characteristics of the sample used, where for many of the banks, the core business is not loan and deposit driven; a more general model is used for this study. Barth et al. (1998) used a model consistent with the Ohlson Framework (1995) to evaluate value relevance of revalued assets. A similar version of this model was also used by Wang et al. (2005) the latest paper to examine the value relevance of notional amounts of derivatives.
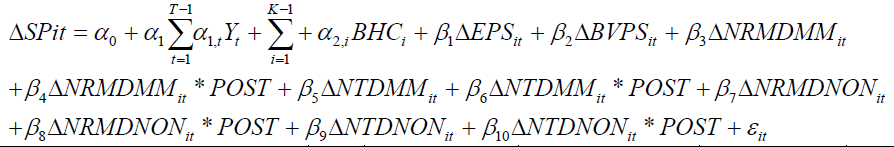
The intercept in Equation (2) is permitted to vary by year and bank using a fixed effects model in order to control for year specific and firm specific effects not captured by the other control variables. A changes model is used to help mitigate potential omitted variable bias and reduce any multicollinearity issues. All variables are scaled by shares outstanding to help reduce heteroskedasticity. Barth and Clinch (2009) state that shares outstanding are the best scalars in the context of a modified Ohlson (1995) valuation model. Newey and West (1987) robust standard errors are applied to control for heteroskedasticity and serial correlation. The coefficients of the explanatory variables for notional amounts of derivatives are permitted to differ across pre and post periods by interacting these variables with a dummy variable indicating the observation belongs to the post crisis/amended disclosures period. The model to test hypotheses 1 and 2 is specified as follows:
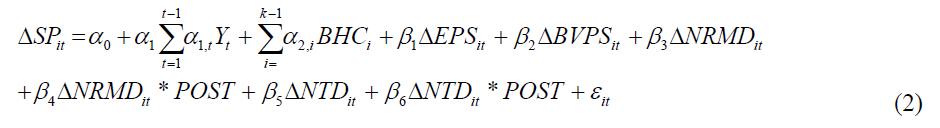
Where T is the number of years in the sample, K is the number of bank holding companies in the sample and subscripts i and t indicate firm and year, respectively. The variables are defined as follows:
ΔSP=Change in Stock Price from year t-1 to year t
Y=1 if the observation belongs to year t and 0 otherwise
BHC=1 if the observation belongs to bank holding company i and 0 otherwise
ΔEPS=Change in Earnings per Share from year t-1 to year t
ΔBVPS=Change in Book Value per Share from year t-1 to year t
ΔNRMD=Change in Notional Amounts of Risk Management Derivatives per Share from year t- 1 to year t
ΔNTD=Change in Notional Amounts of Trading Derivatives per Share from year t-1 to year t
POST=1 if observation belongs to years 2009-2012; 0 otherwise
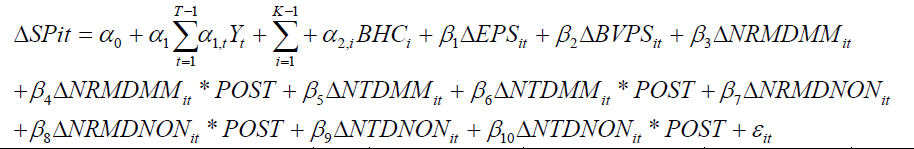
The second model further breaks out risk management and trading derivatives by bank category, market makers and nonmarket makers, in order to test the differential effects, the events may have depending on the nature of the bank. Equation (3) serves to test hypotheses 3 and 4 and is specified as follows:
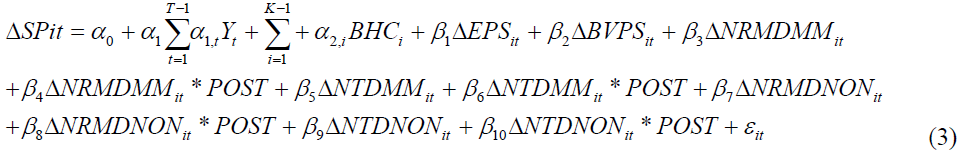
Variables in this model are related to those of the first model. The new variables in this model are:
ΔNRMDMM=Change in notional amounts of risk management derivatives per share for market making banks from year t-1 to year t
ΔNTDMM=Change in notional amounts of trading derivatives per share for market making banks from year t-1 to year t
ΔNRMDNON=Change in notional amounts of risk management derivatives per share for non-market making banks from year t-1 to year t
ΔNTDNON=Change in notional amounts of trading derivatives per share for non-market making banks from year t-1 to year t
Once again the coefficient of the explanatory variable for notional amounts of derivatives is permitted to differ across pre and post periods with an interaction term. Because the examination is done at the derivative and bank category levels, the model includes four interaction terms to capture the four possible combinations.
Sample Selection and Results
Sample
This study uses a sample of public banks that file with the Federal Reserve System on form FR Y-9C for the period beginning in 2002 and ending in 2015. It begins with a cross-section of all banks that have derivatives in both the 1st quarter of 2002 and the last quarter of 2015 obtained from the Bank Regulatory Database. This provides a total of 319 banks. The sample obtained is intersected with the CRSP database, eliminating 129 banks that did not have share price information in CRSP. The compustat bank database was used for financial data (other than derivatives data). A total of 78 banks were eliminated because they lacked complete financial data, leaving 112 banks. Because many banks possess similar names, in order to ensure the correct data is cross-referenced between both databases, total assets are obtained from the Compustat Bank Database using stock symbol and total assets from the Bank Regulatory Database using their regulatory RSSD ID number; all banks with the same names in each database that do not have matching total assets are eliminated. This process eliminated a total of 26 banks leaving the final sample data with 86 banks amounting to a total of 1,233 observations for a levels model and 1,117 observations for the changes model used in the main analysis.
For purposes of this study market makers are defined as those banks that average at least 5% of their total revenues in derivative trading revenue. Six BHCs qualify as market making banks based on available information per these criteria; these are JP Morgan Chase & Co., Bank of America Corporation, Citigroup Inc., Morgan Stanley, The Goldman Sachs Group and The Bank of New York Mellon Corp. Two of these banks, Morgan Stanley and Goldman Sachs, were eliminated because they became BHC in 2009 and therefore notional amounts are not available for prior years. The four remaining banks amount to 64 observations for market making banks in the study.
Descriptive Statistics
Descriptive statistics in Table 1 compare the explanatory variable both on a period basis, 2002-2008 versus 2009-2015 and on a bank category basis. The table shows that market making banks have a mean EPS more than 50% greater than that of the nonmarket makers during the pre-crisis period. Overall, on a net income basis, market making banks average over 30 times the net income earned by nonmarket makers during this period. After the crisis market making banks average net income that is 18 times that of nonmarket making banks on an overall basis and 4.8 times on a per share basis. While the performance of market making banks appears to have improved after the crisis, the performance of nonmarket making banks has deteriorated after the crisis. Book value of equity is greater for market making banks in both periods and has increased by approximately 80% after the crisis while nonmarket makers have increased their book values, on average, only 7.5% during the same time period. Market making banks account for over 99% of all notional amounts of trading derivatives in both periods and over 90% of all notional amounts of risk management derivatives.
| Table 1 : Descriptive Statistics For All Explanatory Variables | ||||||||||
| Pre: 2002-2008 | Post: 2009-2015 | |||||||||
|---|---|---|---|---|---|---|---|---|---|---|
| (N=573) | (N=544) | |||||||||
| Variables 1 ($ Amount Per share) |
Mean | Standard Deviation |
Min | Median | Max | Mean | Standard Deviation |
Min | Median | Max |
| EPS | 1.953 | 1.744 | -11.328 | 1.867 | 8.857 | 1.117 | 3.048 | -16.052 | 1.054 | 24.882 |
| EPSMM | 3.070 | 2.516 | -5.080 | 3.419 | 7.501 | 4.642 | 6.543 | -0.222 | 2.733 | 24.882 |
| EPSNON | 1.909 | 1.694 | -11.328 | 1.851 | 8.857 | 0.968 | 2.574 | -16.052 | 1.029 | 8.032 |
| BVPS | 17.863 | 10.927 | 3.820 | 15.511 | 145.454 | 20.778 | 19.482 | -2.258 | 16.556 | 162.778 |
| BVPSMM | 31.815 | 26.181 | 13.021 | 26.546 | 145.454 | 56.158 | 51.144 | 5.350 | 35.686 | 162.778 |
| BVPSNON | 17.307 | 9.485 | 3.820 | 15.375 | 65.157 | 18.647 | 13.121 | -2.258 | 16.008 | 76.621 |
| NTD | 510 | 3,535 | 0 | 0 | 68,310 | 1,732 | 9,974 | 0 | 0 | 92,764 |
| NTDMM | 12,016 | 13,986 | 1,867 | 7,149 | 68,310 | 29,216 | 31,517 | 1,273 | 17,764 | 92,764 |
| NTDNON | 51.325 | 200.021 | 0.000 | 0.000 | 2,015 | 76.720 | 275.335 | 0.000 | 0.000 | 2,842 |
| NRMD | 19.660 | 42.334 | 0.000 | 3.738 | 343.102 | 22.638 | 57.145 | 0.000 | 4.686 | 444.238 |
| NRMDMM | 112.200 | 87.517 | 17.757 | 95.528 | 343.102 | 115.606 | 99.005 | 3.624 | 58.483 | 294.001 |
| NRMDNON | 15.972 | 34.875 | 0.000 | 3.345 | 299.033 | 17.038 | 48.440 | 0.000 | 4.393 | 444.238 |
The definition of each variable is as follows: EPS is annual basic earnings per share for all sample banks, EPSMM and EPSNON are the annual earnings per share for market making banks and non-market making banks, respectively; BVPS is book value of equity per share for all sample banks, BVPSMM and BVPSNON are the book value per share for market making banks and non-market making banks, respectively; NTD is the notional amount of trading derivatives for all sample banks, NTDMM and NTDNON are the notional amounts of trading derivatives for market making banks and non-market making banks, respectively; NRMD is the notional amount of risk management derivatives for all sample banks, NRMDMM and NRMDNON are the notional amounts of risk management derivatives for market making banks and non-market making banks, respectively.
*Significant at the 0.05 level for the Pearson correlations. Pearson (Spearman) correlation coefficients are above (below) the diagonal.
The definition of each variable is as follows: SP is the share price two months after fiscal year end, EPS is annual basic earnings per share, BVPS is book value of equity per share, NTD is the notional amount of trading derivatives, NRMD is the notional amount of risk management derivatives, FVATDMM is the recognized fair value of assets related to trading derivatives for market making banks, FVLTDMM is the fair value of liabilities related to trading derivatives for market making banks, FVATDNON is the fair value of assets related to trading derivatives for non-market making banks and FVLTDNON is the fair value of liabilities related to trading derivatives for non-market making banks.
| Table 2: Pearson And Spearman Correlation Coefficients | |||||||||
| N=1,117 | SP | EPS | BVPS | NTD | NRMD | FVATDMM | FVLTDMM | FVATDNON | FVLTDNON |
|---|---|---|---|---|---|---|---|---|---|
| SP | 1.0 | 0.2763* | 0.7481* | 0.1594* | 0.0757* | 0.1075* | 0.0997* | 0.0150 | 0.0152 |
| PS | 0.6134 | 1.0 | 0.2816* | 0.5366* | 0.4751* | 0.4229* | 0.4212* | 0.2437* | 0.2445* |
| BVPS | 0.6768 | 0.4259 | 1.0 | 0.3512* | 0.1334* | 0.3028* | 0.2921* | 0.0411 | 0.0407 |
| NTD | 0.3458 | 0.5912 | 0.4727 | 1.0 | 0.5213* | 0.9549* | 0.954* | 0.0013 | 0.0015 |
| NRMD | 0.2486 | 0.6299 | 0.2871 | 0.6525 | 1.0 | 0.5271* | 0.5332* | 0.3393* | 0.3373* |
| FVATDMM | 0.1261 | 0.2932 | 0.2347 | 0.4049 | 0.3522 | 1.0 | 0.9997* | -0.0228 | -0.0227 |
| FVLTDMM | 0.1258 | 0.2931 | 0.2344 | 0.4049 | 0.3522 | 1.000 | 1.0 | -0.0228 | -0.0227 |
| FVATDNON | 0.3188 | 0.4721 | 0.3935 | 0.8149 | 0.4831 | -0.1531 | -0.1531 | 1.0 | 0.9998* |
| FVLTDNON | 0.2769 | 0.4543 | 0.3584 | 0.8110 | 0.5169 | -0.1487 | -0.1487 | 0.9461 | 1.0 |
*Significant at the 0.05 level for the Pearson correlations. Pearson (Spearman) correlation coefficients are above (below) the diagonal.
The definition of each variable is as follows: SP is the share price two months after fiscal year end, EPS is annual basic earnings per share, BVPS is book value of equity per share, NTD is the notional amount of trading derivatives, NRMD is the notional amount of risk management derivatives, FVATDMM is the recognized fair value of assets related to trading derivatives for market making banks, FVLTDMM is the fair value of liabilities related to trading derivatives for market making banks, FVATDNON is the fair value of assets related to trading derivatives for non-market making banks and FVLTDNON is the fair value of liabilities related to trading derivatives for non-market making banks.
The Pearson and Spearman Correlations are presented in Table 2. While many of the coefficients are significant, of all the pairs of explanatory variables, only the relationship of notional amounts of trading derivatives with earnings per share and with risk management derivatives are above 50%. This is driven by the differential in notional amounts of trading derivatives and earnings per share between market making banks and non-market making banks in the same direction as seen in Table 1. As mentioned in a previous section, there is a very strong correlation between fair value of liabilities and fair values of assets, an indication of effective hedging within the trading category for both types of banks. All other variables exhibit low correlation levels, suggesting multicollinearity among the variables in the model is not an issue. Additionally, variance inflation factor (VIF) computed for the regression models are all below 2.50, supporting the low mutlicollinearity found in the correlation tables.
Empirical Results
The analysis in this section uses notional amounts of risk management derivatives (NRMD) and trading derivatives (NTD) but does not distinguish between bank categories. Table 3 reports the regression results for Equation 2. These results pertain to hypotheses 1 and 2. The coefficients of interest are  measures the overall association of the related variable with share price changes in pre-crisis period,
  measures the overall association of the related variable with share price changes in the post crisis period and β4 measures the incremental weight in valuation the related variable is given during the post crisis period. The overall estimated regression model helps explain 48.32% of the variance in share prices for the sample data as indicated by the adjusted R². Results show that NRMD were not significantly associated with share price changes before the financial crisis/SFAS 161 (t-statistic=0.69). On the other hand, NRMD becomes significantly positively associated with share price changes during the post crisis period (t-statistic for
  ). This association is significant at the 1% level of significance. The positive and significant coefficient on ΔNRMD*POST, suggest that NRMD are given more weight in valuation after the financial crisis and pronouncement of SFAS No. 161.
| Table 3: Tests Of Value Relevance Of Notional Amounts Of Derivatives By Derivative Category In The Pre- And Post-Financial Crisis/Sfas 161 | |||||
 |
|||||
| Variable3 (N=1,117) | Expected Sign | Estimated Coefficient1 | t-statistic 2 | p-value | |
|---|---|---|---|---|---|
| ?EPS | + | 0.5569*** | 2.78 | 0.006 | |
| ?BVPS | + | 0.5991*** | 4.55 | 0.000 | |
| ?NRMD | H1 | + | 0.0179 | 0.69 | 0.490 |
| ?NRMD*POST | H2 | + | 0.0447** | 2.12 | 0.034 |
| ?NTD | ? | -0.0003 | -0.54 | 0.589 | |
| ?NTD*POST | ? | 0.0005* | 1.81 | 0.071 | |
| (β3 + β4) | H1 | + | 0.0626*** | 7.61 | 0.006 |
| (β5 + β6) | ? | 0.0002 | 0.14 | 0.710 | |
| Adjusted R2 | 48.32% | ||||
Notes:
1.*/**/*** Significant at 0.10/0.05/0.01 level; NS=expected to be Not Significant
2.The t values are based on standard errors adjusted for heteroscedasticity
3.All variables are presented on a per share basis
4.t-statistics for the sum of coefficients were determined using an F-test with the null hypothesis: βit+βit=0
5.The sample includes 1,117 annual observations from 2002-2015
6.The Post observations begin in year 2009
7.Y: Year; BHC: Bank Holding Company; for Bank i at time t, SP: Stock Price two months after end of year; EPS: Earnings Per Share; NRMDMM: Notional Amount of Risk Management Derivatives for Market Makers; NRMDNON: Notional Amount of Risk Management Derivatives for Non Market Makers; NTDMM: Notional Amount of Trading Derivatives for Market Makers; NTDNON: Notional Amount of Trading Derivatives for Non Market Makers; Y=1 if the observation belongs to year t=T for T=1, 2, 3,
...10 and 0 otherwise; BHC=1 if the observation belongs to bank holding company i=K for K=1, 2,
...88 and 0 otherwise; and POST=1 if the observation belongs to the post-Crisis/SFAS 161 period beginning in Year 2009 and 0 otherwise.
These results partially support hypothesis 1 and fully support hypothesis 2. Skinner (1996) commenting on Venkatachalam (1996) states that perhaps lack of results or negative results suggests market participants view hedging as a costly and ineffective strategy. Another suggestion he makes is that market participants don’t trust managers to use derivatives to effectively reduce risk or that they don’t understand how derivatives are used. All these are plausible explanations for the lack of significance during the pre-crisis period. The fact that these derivatives become subsequently significantly positively associated with changes in share prices after the crisis may suggest that the crisis stressed the importance of properly hedging risks through the use of derivatives and that the new disclosures provided improved reliability and transparency on the disclosure of these derivatives.
Although the results on the coefficient pertaining to notional amounts of trading derivatives (NTD) are not related to any of these hypotheses, a brief explanation is warranted for comparison with the subsequent model where results are analysed by bank category. Results show that NTD were not significantly associated with share price changes during the pre-crisis period (t-statistic= -0.54). After the financial crisis NTD remain insignificant overall (t-statistic =0.14). Interestingly, the coefficient of ΔNTD*POST is positive and significant at the 10% level of significance (t-statistic=1.81) this suggest that though NTD remain overall insignificant during the post crisis period, they experienced an incrementally significant increase in relevance in the post crisis period.
Table 4 reports regression results pertaining to equation 3. The main objective of this analysis is to determine how the aforementioned events affected associations at the bank category level and if these inferences differ from those obtained without such distinction. Therefore, in this analysis bank categories are broken out into market making banks and nonmarket making banks. These results pertain to hypotheses 3 and 4. Coefficients β3 through β10 are the coefficients of main interest and their interpretations are similar to those in equation 2. The overall estimated regression model helps explain 49.32% of the variance in share prices for the sample data as indicated by the adjusted R². Results show that notional amount of risk management derivatives for market making banks (NRMDMM) are significantly positively correlated with changes in share prices during the pre-crisis period (t-statistic=2.61). The incremental change in association between these two variables was significantly negative after the crisis (t-statistic= -3.07) leading to an overall insignificant association during the post crisis period (t-statistic=1.50). The incrementally negative results in this category and their subsequent insignificance during the post crisis period may be the result of an implicit “bailout” by the Federal Reserve for larger banks after the crisis.
For nonmarket making bank, results relating to risk management derivatives are consistent with equation 2, suggesting that inferences made at the overall bank category level are dominated by those for nonmarket making banks in this particular derivative category. Results show that notional amounts of risk management derivatives (NRMDNON) are insignificant during the pre-crisis period (t-statistic=0.45), are given an incrementally significant positive association after the crisis (t-statistic=2.41) and become overall significantly positively related to share price changes during the post crisis period (t-statistic=7.90). This suggests that the markets do not apply the “bailout” effect to smaller banks and therefore the crisis may have increased their relevance and SFAS 161 may have increased the reliability of the disclosure information.
Notional amounts of trading derivatives for market making banks (NTDMM) follow a pattern similar to those obtained without the bank category distinction in equation 2. This suggests that perhaps inferences obtained for market making banks dominate those at the overall bank level. Trading derivatives for market making banks were not significant during the pre-crisis period (t-statistic= -1.34). Results show that they remained overall insignificant during the post crisis period (t-statistic=0.1). However, the positive and significant coefficient on ΔNTDMM*POST (t-statistic=2.76) suggests that NTDMM are given more weight in valuation after the crisis and SFAS 161.
Results for notional amounts of trading derivatives for Non Market Making banks (NTDNON) are consistent with expectations. Because revenues related to these derivatives are not a core component of their business model, the coefficients of NTDNON is not expected to be significant for any of the related variables. In line with these expectations, results show that all coefficients for Non Market Making banks related to trading derivatives are insignificant.
Sensitivity Analyses
Both specifications are estimated using a levels model, scaled on a per share basis as in the equations above. Untabulated results for this model are similar to those presented in Tables 4 and 5 with a few exceptions. Results for specification #2, using the levels model, show that NRMD are significantly positively related with share price changes during the post crisis period and become negatively related to share price changes after the crisis. These results suggest that under this model inferences are dominated by market making banks and as a results are in line with those found for market making banks when segregated from nonmarket making banks. This can be attributed more to a flaw in the levels model which has less control of omitted variables than the changes model. For NTD, results are similar to those presented in Tables 4 with the exception that positive coefficient on the interactive term is significant at a higher confidence level in the levels model. Overall these results are consistent with the specifications used in the study.
| Table 4: Tests Of Value Relevance Of Notional Amounts Of Derivatives By Derivative Category And Bank Category In The Pre- And Post-Financial Crisis/Sfas 161 | |||||
 |
|||||
| Variable3 | Expected | Estimated | t-statistic2 | p-value | |
|---|---|---|---|---|---|
| ( N = 1,117) | Sign | Coefficient1 | |||
| ?EPS | + | 0.5578 *** | 2.79 | 0.005 | |
| ?BVPS | + | 0.6008 *** | 4.58 | 0.000 | |
| ?NRMDMM | H1 | + | 0.0601 *** | 2.61 | 0.009 |
| ?NRMDMM*POST | H2 | + | -0.0823 *** | -3.07 | 0.002 |
| ?NTDMM | H3 | ? | -0.0005 | -1.34 | 0.180 |
| ?NTDMM*POST | H4 | ? | 0.0007 *** | 2.76 | 0.006 |
| ?NRMDNON | H1 | + | 0.0183 | 0.45 | 0.655 |
| ?NRMDNON*POST | H2 | + | 0.6650 ** | 2.41 | 0.016 |
| ?NTDNON | H3 | NS | -0.0026 | -0.34 | 0.735 |
| ?NTDNON*POST | NS | 0.0298 | 0.58 | 0.562 | |
| (β3 + β4) | H1 | + | -0.0222 | 1.50 | 0.221 |
| (β5 + β6) | H3 | ? | 0.0002 | 0.10 | 0.747 |
| (β7 + β8) | H1 | + | 0.6833*** | 7.90 | 0.005 |
| (β9 + β10) | H3 | NS | 0.0272 | 0.00 | 0.946 |
| Adjusted R2 | 49.32% | ||||
Notes:
1.*/**/*** Significant at 0.10/0.05/0.01 level; NS=expected to be Not Significant
2.The t values are based on standard errors adjusted for heteroscedasticity
3.All variables are presented on a per share basis
4.t-statistics for the sum of coefficients were determined using an F-test with the null hypothesis: βit+βit=0
5.The sample includes 1,117 annual observations from 2002-2015
6.The Post observations begin in year 2009
7.Y: Year; BHC: Bank Holding Company; for Bank i at time t, SP: Stock Price two months after end of year; EPS: Earnings Per Share; NRMDMM: Notional Amount of Risk Management Derivatives for Market Makers; NRMDNON: Notional Amount of Risk Management Derivatives for Non Market Makers; NTDMM: Notional Amount of Trading Derivatives for Market Makers; NTDNON: Notional Amount of Trading Derivatives for Non Market Makers; Y=1 if the observation belongs to year t=T for T=1, 2, 3,
...10 and 0 otherwise; BHC=1 if the observation belongs to bank holding company i=K for K=1, 2,
...88 and 0 otherwise; and POST=1 if the observation belongs to the post-Crisis/SFAS 161 period beginning in Year 2009 and 0 otherwise.
A third model, scaling changes in levels of the variables by beginning of period market value of equity is also estimated. In this model, risk management derivatives go from insignificant in the pre-crisis period to positive and significant for nonmarket makers in post period. Risk management derivatives were not significant for market making banks in either period, though the incremental effect of the post period was significantly negative at the 10% level of confidence. Trading derivatives were not found to be significant for either bank classification, though the incremental effect for nonmarket makers during the post crisis period was significantly negative at the 10% level of confidence.
A post crisis period only regression is estimated including the two new market making banks to enter the banking industry, Goldman Sachs and Morgan Stanley. The inclusion of Goldman Sachs and Morgan Stanley did not change any inferences for the Post Crisis period and did not change the relative differences between market making banks and non-market making banks during this period.
Finally, the year 2009 is included in the crisis period to determine if spill-over effect of the crisis will accentuate post crisis results and change differential inferences between both periods. Results showed that differential differences between periods, derivative category and bank category do not differ when 2009 is included as part of the crisis period.
Concluding Remarks
This study contributes to existing literature in various ways. First, it updates prior existing literature specifically studying notional amounts of derivatives, the last of which was conducted in 2005. Various events and dynamic changes have occurred in the banking industry that may alter inferences made by prior literature. In addition, the results of this literature had been mixed. Since the last known paper addressing notional amounts of derivatives, their use has increased dramatically within the banking industry. There have been regulatory changes, accounting disclosure amendments and external events that serve to alter market perception on derivatives; which may ultimately alter their association with firm value.
Secondly, this study contributes to prior literature by showing that the banking industry is becoming less of a homogenous group. Prior literature in this area, focused on differentiating between types of derivatives but mostly ignored bank characteristics. This paper shows that an assumption that these banks are a homogenous group can lead to improper inferences. With investment banks joining the banking industry this distinction is even more important than ever. Finally, specific results obtained show that SFAS 161 may have increased the market perception of the reliability of data as both types of derivatives shift from insignificant to significant after the new standard became effective. Furthermore, results show that the financial crisis appears to have strengthened the implied “bailout” for larger banks as risk management derivatives become insignificant, for these banks in particular, after the crisis. Association for risk management derivatives appear to be stronger for nonmarket making banks, while associations for trading derivatives are stronger for market making banks. Overall, this study confirms that events affect the association between derivatives and firm value differentially when they are segregated by the different classifications used in this study.
Endnote
1. Market Making banks are those engaging in the trading of derivatives as a core part of their business revenues. Specific determining characteristics are defined in the Sample Section of this paper.
2. While there has been plenty of research on the fair value of derivatives, the last paper examining the effects of notional amounts, published in a peer-reviewed journal, was Wang and Makar, 2005.
3. Data Source: OCC Bank Derivatives Report. www.occ.gov.
4. SFAS No. 161 was an amendment to FASB No. 133.
5. This is often overlooked because researchers often obtain derivatives data from the call reports.
6. See appendix for examples of notional amounts in computational formulas by derivative type.
7. This information has been available through the quarterly call reports all regulated financial institutions must file with Federal Financial Institutions Examination Council. www.ffiec.gov.
8. The focus of this statement is on derivatives on a stand-alone basis. How this volatility can be used to reduce overall volatility will be addressed in a subsequent paragraph.
9. As implied by the comments made by Warren Buffet, cited in the introduction, this is not always the case even with more sophisticated investors.
10. The correlation in the table is expressed in positive terms because both assets and liabilities are inputted with positive values.
11. SFAS 133 was effective during the entire “pre” period examined. While it is still effective till this day, its amendment, SFAS 161, became effective during the post period of this study only.
12. Scaling per share is done to variables not already captured on a per share basis. In other words, stock price is market value of equity scaled by shares outstanding; not stock price scaled by shares outstanding.
13. Stock Prices used are two months after end of fiscal year to ensure financial information is captured in the price.
14. A degree of flexibility was allowed for negligible differences.
| Appendix: Common Derivative Instruments And Related Notional Amounts |
|||
| Contract Type | % of Sample | Underlying Financial Instrument (Notional) | Leverage |
|---|---|---|---|
| Interest Rate Futures: | 87% | ||
| $100,000 par value 6% coupon 20-year bond | $1 change in Futures produces $1,000 gain or loss |
||
| $1,000,000 of a 90-day US Treasury bill | $1 change in Futures produces $2,500 gain or loss |
||
| $1,000,000 of a 90-day US Euro dollar time deposit. | $1 change in Futures produces $2,500 gain or loss |
||
| Foreign Exchange Futures: | 10% | ||
| Foreign Exchange Swaps | A notional for each currency of equivalent economic value at inception is determined. | A change in the exchange rate is directly leveraged by the notional amount in the payer currency. | |
| Equity Derivatives Contracts: | 2% | ||
| S&P 500 Contracts | S&P 500 Index times a multiple of 250 | 1-point change in the Index produces a $250 gain or loss |
|
| DJ Industrial Average | DJI Index times a multiple of 10 | 1-point change in the Index produces a $10 gain or loss | |
| NASDAQ 100 | NASDAQ 100 Index times a multiple of 100 | 1-point change in the Index produces a $100 gain or loss |
|
| NYSE | NYSE Index times a multiple of 500 | 1-point change in the Index produces a $500 gain or loss |
|
| Options | Stock Price *100 (per contract) |
$1 change in stock price produces a $100 change in the intrinsic value (time value not included) | |
| Commodity and Others | 1% | ||
| Commodity Futures | Notional (varies) x Fixed Price produces a change in the contract directly related to the notional amount | $1 change in commodity price | |
The above information is only a representation of various typical derivative contracts used in the market and is not intended to represent all exhaustive possibilities. Notional and calculations of notional may vary by contract, industry, derivative type, etc.
References
- Ahmed, A.S., Kilic, E. & Lobo, G.J. (2006). Does recognition versus disclosure matter? Evidence from value-relevance of banks recognized and disclosed derivative financial instruments. The Accounting Review, 81, 567-588.
- Amiran, D., Beaver, W., Landsman, W.R. & Zhao, J. (2017). The effects of credit default swap trading on information asymmetry in syndicated loans. Journal of Financial Economics, 126(2), 364-382.
- Barth, M., Beaver, W.H. & Landsman, W.R. (1996). Value-relevance of banks fair value disclosures under SFAS 107. The Accounting Review, 71, 513-537.
- Barth, M. & Clinch, G. (2009). Scale effects in capital markets-based accounting research. Journal of Business Finance and Accounting, 36(3), 253-288.
- Barth, M. & Landsman, W.R. (2010). How did financial reporting contribute the financial crisis? European Review, 19, 399-423.
- Basu, S. (1997). The conservatism principal and the asymmetric timeliness of earnings. Journal of Accounting and Economics, 24, 3-37.
- Beneda, N. (2013). The impact of hedging with derivative instruments on reported volatility. Applied Financial Economics, 23,165-179.
- Boehmer, E., Chava, S. & Tookes, H.E. (2015). Related securities and equity market quality: The case of CDS. Journal of Financial and Quantitative Analysis, 50(3), 509-541.
- Buffet, W. (2002). Berkshire Hathaway Inc. shareholder letters. Available at: http://www.berkshirehathaway.com/letters/2002pdf
- Buffet, W. (2003). Berkshire Hathaway Inc. Shareholder Letters. Available at: http://www.berkshirehathaway.com/letters/2003ltr.pdf
- Cassar, G. & Gerakos, J. (2017). Do risk management practices work? Evidence from hedge funds. Review of Accounting Studies, 22(3), 1084-1121.
- Chakraborty, I., Chava, S. & Ganduri. R. (2015). Credit default swaps and moral hazard in bank lending. Working Paper.
- Chaudhry, N.I., Mehmood, M.S. & Mehmood, A. (2014). Dynamics of derivative usage and firm’s value. Wulfenia Journal, 21(6), 122-140.
- Chen, Y. (2011). Derivatives use and risk taking: Evidence from the hedge fund industry. Journal of Financial and Quantitative Analysis, 46(4), 1073-1106.
- Choi, J.J., Mao, C.X. & Upadhyar, A.D. (2015). Earnings management and derivative hedging with fair valuation: Evidence from the effects of FAS 133. The Accounting Review, 90(4), 1437-1467.
- Duangploy, O. & Helmi, D. (2002). Analysis of derivatives unrealized gains/losses from pre SFAS 133 disclosures: Banking industry. Academy of Accounting and Financial Studies, 6, 1-10.
- Eccher, A., Ramesh, K. & Thiagarajan, S.R. (1996). Fair value disclosures bank holding companies. Journal of Accounting and Economics, 22, 79-117.
- Fama, E.F. (1977). Risk adjusted discount rates and capital budgeting under uncertainty. Journal of Financial Economics, 5, 3-24.
- Financial Accounting Standards Board. (FASB). (1990). Disclosure of information about financial instruments with off-balance-sheet risk and concentrations of credit risk. Statement of Financial Accounting Standards No. 105. Norwalk, CT: FASB.
- Financial Accounting Standards Board. (FASB). (1991). Disclosures about fair value of financial instruments. Statement of Financial Accounting Standards No. 107. Norwalk, CT: FASB.
- Financial Accounting Standards Board. (FASB). (1994). Disclosure about derivative financial instruments and fair value of financial instruments. Statement of Financial Accounting Standards No. 119. Norwalk, CT: FASB.
- Financial Accounting Standards Board. (FASB). (1998). Accounting for derivative instruments and hedging activities. Statement of Financial Accounting Standards No. 133. Norwalk, CT: FASB.
- Financial Accounting Standards Board. (FASB). (2008). Disclosures about derivative instruments and hedging activities. Statement of Financial Accounting Standards No. 161. Norwalk, CT: FASB.
- Greenspan, A. (2005). Testimony at the Federal Reserve Bank of Chicago?s Forty-first Annual Conference on Bank Structures, Chicago, Illinois. Available at: http://www.federalreserve.gov/boarddocs/speeches/2005/20050505/
- Hayn, C. (1995). The information content of losses. Journal of Accounting and Economics, 20, 125-153.
- Hoskin, R.E., Hughes, J.S. & Ricks, W.E. (1986). Evidence on the incremental information content of additional firm disclosures made concurrently with earnings. Journal of Accounting Research, 24, 1-32.
- Kohlbeck, M. (2008). An analysis of recent events on the perceived reliability of fair value measures in the banking industry. Working paper, Florida Atlantic University.
- Kothari, S.P. & Lester, R. (2012). The role of accounting in the financial crisis: Lessons for the Future. Accounting Horizons, 26(2), 335-351.
- Kuprianov, A. (1995). Derivatives debacles: Case studies of large losses in derivatives markets. Federal Reserve Bank of Richmond. Economic Quarterly, 18.
- Martin, X. & Roychowdhury, S. (2015). Do financial market developments influence accounting practices? Credit default swaps and borrowers’ reporting conservatism. Journal of Accounting and Economics, 59, 80-104.
- McAnally, M.L. (1996). Banks, risk and FAS 105 disclosures. Journal of Accounting and Economics, 11, 453-490.
- Nelson, K. 1996. Fair value accounting for commercial banks: An empirical analysis of SFAS No. 107. The Accounting Review, 71, 161-182.
- Newey, W.K. & West, K. (1987). A simple, positive semi-definite heteroscedasticity and autocorrelation consistent variance matrix. Econometrica, 55, 703-708.
- Nguyen, H. & Liu, M. (2014). Effective derivative hedging and initial public offering long-run performance. Accounting and Finance, 54, 1263-1294.
- Ohlson, J. (1995). Earnings, book values and dividends in security valuation. Contemporary Accounting Research, 11(2), 661-687.
- Ramesh, K. & Thiagarajan, S.R. (1993). Estimating the permanent component of accounting earnings using the unobservable components model: Implications for price-earnings research. Journal of Accounting, Auditing and Finance, 399-425.
- Ramakrishnan, R.T.S. & Thomas, J.K. (1998). Valuation of permanent, transitory and price irrelevant components of reported earnings. Journal of Accounting, Auditing & Finance, 13(3), 301-336.
- Riffe, S. (1996). The valuation of off-balance sheet financial instrument disclosures in the banking industry: In Derivatives, regulation and banking industry. Advances in Finance, Investment and Banking Services, 93-121.
- Robichek, A. & Myers, S.C. (1966). Conceptual problems in the use of risk-adjusted discount rates. The Journal of Finance, 21(4), 727-730.
- Saretto, A. & Tookes, H.E. (2013). Corporate leverage, debt maturity and credit supply: The role of credit default swaps. The Review of Financial Studies, 26(5), 1190-1205.
- Shan, S.C., Tang, D.Y. & Winton, A. (2015). Do credit derivatives lower the value of creditor control rights? Evidence from debt covenants. Working Paper.
- Skinner, D. (1996). Are disclosures about bank derivatives and employee stock options, value relevant? Journal of Accounting and Economics, 22, 393-405.
- Subrahmanyam, M.G., Tang, D.Y. & Wang, S.Q. (2014). Does the tail wag the dog? The effect of credit default swaps on credit risk. The Review of Financial Studies, 27(10), 1960-2926.
- Treanor, S.D., Simkins, B.J., Rogers, D.A. & Carter, D.A. (2014). Does operational and financial hedging reduce exposure? Evidence from the US airline industry. The Financial Review, 49, 149-172.
- Van Der Stede, W.A. (2011). Management accounting research in the wake of the crisis: Some reflections. European Accounting Review, 20(4), 605-623.
- Venkatachalam, M. (1996). Value relevance of banks derivative disclosures. Journal of Accounting and Economics, 22, 327-355.
- Wang, L., Alam, P. & Makar, S. (2005). The value-relevance of derivative disclosures by commercial banks: A comprehensive study of information content under SFAS Nos. 119 and 133. Review of Quantitative Finance and Accounting, 25, 413-427.