Review Article: 2023 Vol: 27 Issue: 2
The Role of Non-RD Expenditures in Promoting Innovation in Europe
Angelo Leogrande, LUM University Giuseppe Degennaro
Alberto Costantiello, LUM University Giuseppe Degennaro
Lucio Laureti, LUM University Giuseppe Degennaro
Citation Information: Leogrande, A., Costantiello, A., & Laureti, L. (2023). The role of non-r&d expenditures in promoting innovation in europ. Academy of Accounting and Financial Studies Journal, 27(2), 1-32.
Abstract
In this article we estimate the value of “Non-R&D Innovation Expenditures” in Europe. We use data from the European Innovation Scoreboard-EIS of the European Commission from the period 2010-2019. We test data with the following econometric models i.e.: Pooled OLS, Dynamic Panel, Panel Data with Fixed Effects, Panel Data with Random Effects, WLS. We found that “Non-R&D Innovation Expenditures” is positively associated among others to “Innovation Index” and “Firm Investments” and negatively associated among others to “Human Resources” and “Government Procurement of Advanced Technology Products”. We use the k-Means algorithm with either the Silhouette Coefficient and the Elbow Method in a confrontation with the network analysis optimized with the Distance of Manhattan and we find that the optimal number of clusters is four. Furthermore, we propose a confrontation among eight machine learning algorithms to predict the level of “Non-R&D Innovation Expenditures” either with Original Data-OD either with Augmented Data-AD. We found that Gradient Boost Trees Regression is the best predictor for OD while Tree Ensemble Regression is the best Predictor for AD. Finally, we verify that the prediction with AD is more efficient of that with OD with a reduction in the average value of statistical errors equal to 40,50%.
Keywords
Innovation and Invention, Processes and Incentives, Management of Technological Innovation and R&D, Diffusion Processes, Open Innovation.
JEL Classification
O30; O31, O32; O33; O36.
Introduction
The non-R&D Expenditures variable in European countries is analyzed below. This variable considers the type of technological innovation that is achieved without investing in research and development. The non-R&D Expenditure in European countries is analyzed below. This variable considers that type of technological innovation that is achieved without investing in research and development. In fact, part of the expenditure for innovation is carried out without moving research and development as for example in the case of investments in machinery and equipment, or in the case of the acquisition of patents and licenses. However, through this expenditure it is possible to consider the diffusion of new technologies and new ideas in production systems. In this regard, we propose a distinction between strong technological innovation or technological innovation constituted using research and development and weak technological innovation or that type of innovation obtained through non-R&D expenditures. The differences between the two types of innovations are significant and concern not only the products and services generated by the innovation but also the socio-economic dimension of technological innovation. In fact, where on the one hand strong technological innovation is achieved by large companies that can invest in the construction of large research centers, on the other hand weak technological innovation is achieved in small and medium-sized enterprises that lack resources financial to invest directly in research and development. However, there is a close link between strong technological innovation and weak technological innovation at least within countries that have intermediate levels of technological innovation. In fact, for these types of countries that are not really champions in technological innovation, then the two forms of innovation interpenetrate, complement, and reinforce each other. This two-way relationship is since for non-R&D expenditure to be established it is necessary that there are positive externalities generated by the investment in R&D that create that climate favorable to technological innovation that produces the forms of open innovation, of collaboration and cooperation between organizations, companies and institutions and creates a favorable environment for technological innovation. However, for countries that are heavily invested in research and development, too great a gap is created between large and medium-sized manufacturing companies that export high-tech products and small and medium-sized enterprises. In this case, small and medium-sized enterprises have difficulty in carrying out non-R&D activities and lack the ability to grasp the positive externalities deriving from the R&D investments of large industrial companies. In any case, regardless of the level of technological innovation, there is still a role for non-R&D expenditures which consists in allowing small and medium-sized enterprises to interpret the innovations present in the market and introduce them into their organizational structure, generating a growth in competitiveness that often it is not due to product innovation but rather to process innovation.
The article continues as follows: in the second paragraph a synthetic analysis of the scientific literature is presented, in the third paragraph the results of the econometric analysis are indicated and discussed, the fourth paragraph analyzes the results of clustering with the k-Means algorithm, the fifth paragraph proposes a network analysis with adjustment and optimization of clustering results with k-Means algorithm, the sixth paragraph contains the comparison between eight machine learning algorithms for the prediction of non-R&D expenditures with Original-Data, the seventh paragraph shows the results of the comparison between eight machine learning algorithms trained with Augmented Data-AD, the eighth paragraph concludes.
Literature Review
An analysis of some articles in the literature considered valid for framing the question of the role of non-R&D expenditures in the context of national innovation systems is briefly presented below.
Xu et al. (2021) consider the role of government research subsidies and non-research technological innovation, R&D investments, and the performance of listed pharmaceutical companies in China in the period between 2009 and 2015. The results show that government subsidies have a positive impact on research and development while having zero impact on technological innovation. On the contrary, investments in Research and Development have a positive impact on technological innovation not deriving from research. The authors verify that the positive impact of R&D investments have a positive impact on technological innovation persists in both public and private enterprises. Lopez-Rodriguez & Martinez-Lopez (2017) afford the question of the role of non-R & D innovation activities within the Total Factor Productivity-TFP. The authors therefore propose a model to consider both the effects of R&D activities and the effects of non-R&D activities on firm productivity levels. The results of the analysis calculated in the context of the EU-26 in the period 2004-208 show that the distinction between R&D and non-R&D is very relevant for the calculation of Total Factor Productivity. Hou et al. (2018) analyze the relationship between investment in Non-R&D Innovation Activities and the impact on regional innovation performance in China. The authors verify the existence of a negative relationship between the value of investment in non-R&D innovation activities and the value of innovation performance both in Chinese regions with a high level of innovation and in Chinese regions with low levels of technological innovation. The authors suggest that the negative impact of Non-R&D innovation activities on technological innovation is minimal only for those regions that have an intermediate value of orientation towards technological innovation. The authors criticize European economic policies based on growth in investment in research and development (Hervás-Oliver et al., 2021). In fact, although the idea of increasing expenditure on research and development as a percentage of GDP to 3% is laudable, there are also doubts about the effective effectiveness of this economic policy. In fact, research and development does not depend only on the growth of the value of investments but rather also on a set of contextual elements such as cooperation between companies and research centers and on innovation that does not derive from research and development. The authors therefore believe that it is necessary to reformulate the economic policies of research and development to also grasp the contextual and environmental elements with a role also for non-R&D innovation. Thomä & Zimmermann, (2020) consider the role of Non-R&D Innovation activities in the development of technological innovations and competitiveness for German small and medium-sized enterprises. Tsuji et al. (2018) analyze the characteristics of research and development spending in some ASEAN countries, namely: Indonesia, Laos, Thailand, the Philippines, and Vietnam. The authors divided the companies analyzed into two groups, namely: companies that invest in research and development activities and companies that invest in Non-R&D Innovation activities. The results of the analysis show the differences between companies that focus on research and development and companies that invest in non-R&D innovation activities. On the one hand, the companies that invest in Research and Development constitute cross-functional teams of production, engineering, marketing, and IT, while the group that invests in non-R&D innovation activities invests in the development of human resources and quality certifications. Through this analysis, the authors verify that there are many Asian SMEs that can produce innovation without having research and development-oriented departments.
Wu et al. (2022) consider the impact of non-R&D spending on Chinese state-owned industrial enterprises through a regional panel analysis. The authors calculate the impact of non-R&D innovation activities of state-owned industrial enterprises on the development of Total Factor Productivity in Chinese regions. The results show that the Non-R&D Innovation Expenditures of state-owned enterprises in China have a positive impact on economic growth. Kale (2022) focuses on the role of non-R&D innovation expenditures in the development of technological innovation in India from a neo-Schumpeterian perspective. The analysis considers the period between 1981 and 2017. The results show that:
1. Innovation in manufacturing companies depends on factors that go beyond investment in Research and Development;
2. Research and Development alone cannot explain the innovation processes in newly industrialized countries such as India;
3. National innovation systems play a decisive role in the development of technological innovation at the country level.
Finally, in the breakdown of the effects that promote non-R&D innovation, the author verifies the predominant role of human capital and remittances from abroad. Lewandowska & Švihlíková, (2020) verify the existence of a positive role of non-R & D innovation expenditures in promoting innovation in the European regions of NUTS2. Zhang (2022) compares the performance and characteristics of technological innovation of firms investing in R&D versus firms investing in non-R&D innovation. The analysis is conducted on a sample of 1392 Chinese manufacturing companies. The results show that on the one hand the companies that produce non-R&D innovation focus on the knowledge present in the company to produce innovation, while on the other hand the companies that invest in R&D access external networks thanks to the use of scientific collaborations and feedback of suppliers. Furthermore, companies that carry out non-R&D innovation tend to use the substitutability of external and internal factors to produce process innovation, while companies oriented towards R&D tend to replace internal and external resources applied to product innovation. Spithoven & Merlevede, (2022) refer to the role of investments in research and development and investments of foreign companies on companies that do not carry out research and development activities considering three regions of Belgium between 2000 and 2017. The results show that companies that invest in research and Development can produce positive effects on the innovative activity even of companies that are devoid of investments in R&D. On the other hand, the impact of foreign direct investments in terms of increasing the innovativeness of non-R&D firms is reduced. The authors conclude with suggestions of regional economic policy of technological innovation by proposing interventions aimed at varying the methodologies for promoting spillover effects based on regional characteristics.
Ma et al. (2021) consider the role of non-R&D intangible capital in determining the Total Factor Productivity-TFP. The econometric analysis is conducted for 13 developed countries in the period between 1995 and 2010. The results show that the growth of non-R&D intangible capital has a positive effect in terms of growth of Total Factor Productivity. Furthermore, the outputs show that non-R&D intangible capital have a positive impact in terms of spillovers effect on various industries and that the growth of R&D and ICT have a positive impact in determining non-R&D intangible capital. Thomä & Zimmermann, (2019) show that SMEs can growth in innovation through non-R&D activities even in a context of high-performing firms that invest in human capital with STEM characteristics. The authors use data from German SMEs. Ganescu & Serbanica, (2021) consider that while the differences in terms of technological innovation between Eastern European countries and other European countries are significant, there are some variables such as non-R&D Innovation Expenditures, for which the same areas converge. Guo et al. (2017) consider the role of non-R&D activities in developing innovative performance in a set of 329 Chinese small and medium-sized enterprises operating in the manufacturing sector. The authors break down non-R&D activities into three components: “technology adoption”, “imitation and minor modification”, and “innovative marketing”. The authors verify that absorptive capacity has a positive impact in positively linking “innovative marketing” with innovation performance. Corrado et al. (2020) emphasize the positive role that investing in non-R&D activities has in promoting intangible capital. Lacová & Hu?ady, (2018) highlight the role of fiscal policies, taxation, and incentives as a tool for promoting research and development within the European Union countries. The authors verify that where there are important fiscal policies in favor of research and development, investment in non-R&D innovation is significantly reduced.
The Econometric Models for the Estimation of the Non-R&D Innovation Expenditures
In the following analysis we present an econometric model for estimating non-R&D Innovation Expenditures in Europe. The data are obtained through the analysis of the European Innovation Scoreboard-EIS database of the European Union for 36 countries1 in the period 2010-2019 Appendix. The data were analyzed using a set of econometric models, namely Pooled OLS, WLS, Panel Data with Fixed Effects, Panel Data with Random Effects and Dynamic Panel at 1 Stage. Specifically, the following equation was estimated:
The value of Non-R&D Innovation Expenditures is positively associated with:
1. Innovation Index: is a variable that considers overall the value of performance in terms of technological innovation at the country level. The indicator takes into consideration all the elements of an institutional, financial, entrepreneurial type and relating to human capital that may have some impact in terms of technological innovation. Obviously, there is a positive relationship between the value of the innovation index and the value of non-R&D expenditures since generally the countries that invest more in technological innovations, whether they are supported by research and development, have precisely the best performances in terms of innovation (Leogrande et al., 2022).
2. Firm Investments: is a variable that considers three indicators, namely investments in R&D, investments in non-R&D expenditures and the ability of companies to increase the IT skills of their employees. Obviously, there is a positive relationship between this variable and the value of non-R&D expenditures both because this variable is constituted by the indicator, and because many small and medium-sized enterprises cannot afford to create research and development departments and therefore must implement forms of non-R&D activity (Costantiello et al., 2021).
3. Foreign-Controlled Enterprises-Share of Value Added: is a variable that considers the added value of foreign-controlled companies in millions of euros. Companies operating in the financial sector are excluded from the indicator. Foreign-controlled companies are companies that have their headquarters in another country other than the one considered. There is a positive relationship between the presence of foreign-controlled companies and non-R & D expenditure. This relationship can be understood considering that foreign-controlled companies are generally medium-large companies that invest significantly in research and development. In other words, they are companies that contribute significantly to the construction of an institutional, social, and economic environment favorable to scientific research. On the contrary, the companies that make non-R&D expenditure are small and medium-sized enterprises which however take advantage of the spillovers generated by large foreign-controlled companies. It is therefore a question of that systemic, environmental and contamination effect that allows the strengthening of national systems of technological innovation.
4. New Doctorate Graduates: is an indicator that measures the supply of new second level graduates in all training fields. The indicator also captures the number of PhD students for most countries. There is a positive relationship between the value of the offer of new graduates and PhD students and the Non-R&D Expenditures. This relationship stems from the fact that there is a connection between the value of human capital and the innovations resulting from non-R & D expenditures. However, it must be considered that this relationship does not operate directly but rather indirectly, that is: human capital has a positive impact on R&D and through this path creates the conditions to increase the value of non-R&D expenditures. In fact, it should be considered that non-R & D expenditures is a context variable that is valued above all where technological innovation systems are significantly oriented towards R&D (Leogrande et al., 2022).
5. Tertiary Education: is an indicator that considers the number of people who have a qualification after secondary education out of the population aged between 25 and 34 years. There is a positive relationship between the value of Tertiary Education and the value of non-R&D expenditures in Europe. This relationship is since the quality of trained human capital has a positive impact on the growth of non-R&D expenditures. However, also in this case, as in the previous point, this relationship operates indirectly, i.e. Tertiary Education tends to have a positive impact on Research and Development. And generally, the countries where there is greater Research and Development also can support more complex non-R&D Expenditures systems thanks to the creation of open innovation systems, cooperation and acting on the context variables of technological innovation systems at national level.
6. Lifelong Learning: is a variable that considers the population aged between 25 and 64, who carry out training and education activities that could be useful in some way for the current or future improvement of the working condition. There is a positive relationship between the value of lifelong learning and the value of non-R & D Expenditures nationwide. This relationship can be better understood considering that the improvement of human capital connected to lifelong learning generates a positive environment for technological innovation, especially for that released from investment in research and development. In fact, although non-R & D expenditure can be understood as a weak form of technological innovation, it still requires a socio-economic context positively oriented towards knowledge (Costantiello et al., 2022).
7. Basic School Entrepreneurial Education and Training: is an indicator that measures the presence of training courses in business culture and management in primary and secondary schools. There is a positive relationship between the value of the presence of entrepreneurship education at the school level and the presence of non-R&D expenditures. Also in this case, as in the previous ones relating to human capital, it is possible to verify that the growth of the knowledge economy constitutes an essential element for the affirmation of non-R&D expenditure. From a strictly sociological and behavioral point of view, this relationship is since the creation of a favorable environment for knowledge, research and development has a positive impact on non-R&D expenditure. In fact, this type of innovation is typical of small and medium-sized enterprises which generally do not have the possibility to create large research and development departments and therefore have the need to draw on forms of widespread knowledge, to use open innovation and to optimize the positive externalities of R&D departments.
8. Trademark Applications: is an indicator that considers the number of trademark applications that are filed with the Patent Office of the European Union and at the World Intellectual Property Office. There is a positive relationship between the value of patent applications and the value of non-R & D expenditures which can be justified considering that in general it is the countries with the most human capital that generate the greatest number of files in the patent office. It obviously follows that where human capital has evolved and where significant investments are made in patents then there is also greater value in terms of non-R & D expenditures. It should be considered that non-R & D expenditures are, for example, expenses on plants and machinery, many of which are realized through patents filed Table 1.
| Table 1 Econometric Estimations Of The Non-R&D Innovation Expenditures In Europe |
||||||||||||
|---|---|---|---|---|---|---|---|---|---|---|---|---|
| Non-R&D innovation expenditure | Dynamic Panel | Fixed Effects | Random Effects | Pooled OLS | WLS | Average | ||||||
| Coefficient | P-value | Coefficient | P-value | Coefficient | P-value | Coefficient | P-value | Coefficient | P-value | |||
| const | -1,1244 | 1,9190 | 2,3201 | 6,1224 | * | 3,0508 | 2,4576 | |||||
| Basic-school entrepreneurial education and training | A4 | 0,9039 | *** | 0,5256 | *** | 0,5495 | *** | 0,6119 | *** | 0,6680 | *** | 0,6518 |
| Enterprises providing ICT training | A15 | -0,5368 | *** | -0,4274 | *** | -0,4209 | *** | -0,4482 | *** | -0,4704 | *** | -0,4607 |
| Finance and support | A17 | -0,2565 | *** | -0,2716 | *** | -0,2693 | *** | -0,2828 | *** | -0,2416 | *** | -0,2644 |
| Firm investments | A18 | 1,8634 | *** | 1,7594 | *** | 1,6893 | *** | 1,4728 | *** | 1,7688 | *** | 1,7107 |
| Foreign-controlled enterprises – share of value added | A20 | 1,0860 | ** | 1,4595 | *** | 1,5544 | *** | 1,9907 | *** | 1,8025 | *** | 1,5786 |
| Government procurement of advanced technology products | A22 | -2,5395 | *** | -2,8899 | *** | -3,1807 | *** | -4,8948 | *** | -3,7567 | *** | -3,4523 |
| Human resources | A23 | -2,7253 | *** | -2,3723 | *** | -2,4187 | *** | -2,8074 | *** | -3,0315 | *** | -2,6710 |
| Innovation index | A24 | 1,5423 | *** | 1,7750 | *** | 1,9487 | *** | 2,9551 | *** | 2,4714 | *** | 2,1385 |
| Intellectual assets | A29 | -0,6149 | *** | -0,7372 | *** | -0,8443 | *** | -1,4471 | *** | -0,9236 | *** | -0,9134 |
| International co-publications | A30 | -0,3363 | *** | -0,3130 | *** | -0,3438 | *** | -0,5064 | *** | -0,4133 | *** | -0,3826 |
| Lifelong learning | A32 | 0,6978 | *** | 0,6979 | *** | 0,7188 | *** | 0,8571 | *** | 0,8740 | *** | 0,7691 |
| Medium and high-tech product exports | A35 | -0,3915 | *** | -0,4074 | *** | -0,4387 | *** | -0,6561 | *** | -0,4546 | *** | -0,4697 |
| Most-cited publications | A36 | -0,3130 | *** | -0,5183 | *** | -0,5233 | *** | -0,5286 | *** | -0,4675 | *** | -0,4701 |
| New doctorate graduates | A37 | 0,9491 | *** | 0,8190 | *** | 0,8432 | *** | 0,9853 | *** | 1,0229 | *** | 0,9239 |
| R&D expenditure business sector | A46 | -0,4370 | ** | -0,4919 | *** | -0,4594 | *** | -0,3058 | *** | -0,6085 | *** | -0,4605 |
| Tertiary education | A53 | 1,0575 | *** | 0,8518 | *** | 0,8418 | *** | 0,7999 | *** | 0,9049 | *** | 0,8912 |
| Trademark applications | A56 | 0,3884 | *** | 0,4784 | *** | 0,5301 | *** | 0,8197 | *** | 0,5023 | *** | 0,5438 |
| Non-R&D innovation expenditure | A38(-1) | 0,1563 | *** | |||||||||
The value of Non-R&D Innovation Expenditures is negatively associated with:
1. Finance and Support: is a variable consisting of two sub-variables, namely “R&D expenditure in the public sector” and “Venture capital expenditures”. That is, it is a variable that sums up the forms of public or private funding for research and development. There is a negative relationship between the development of a financial system aimed at supporting research and development and non-R&D expenditures. This relationship can be understood considering that expenditure on technological innovation can be divided into two different types, i.e. weak innovation which is represented by non-R&D expenditures and strong innovation constituted instead by investment in R&D. Obviously, countries that have more advanced financial systems, that have more efficient financial markets and larger companies on average tend to support strong technological innovation achieved with R&D rather than weak technological innovation achieved with non-R&D expenditures (Laureti et al., 2020).
2. International Scientific Co-Publications: is an indicator that considers the number of scientific publications that have at least one foreign co-author. These publications are considered as a proxy of the quality of scientific research. There is a negative relationship between the value of international scientific publications and the value of non-R&D expenditure. This relationship can be better understood considering that while international scientific publications are produced by large universities or large research centers, non-R&D expenditure is typical of SMEs Figure 1. And generally, in countries where there are large universities and large research centers, the system tends to be oriented more towards strong technological innovation - R&D and less towards weak technological innovation, non-R&D expenditures (Leogrande et al., 2022).

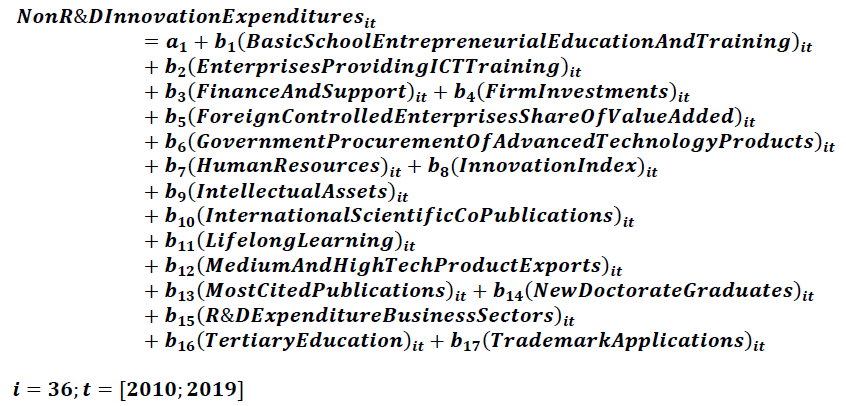
Figure 1: Econometric Estimations Of The Non-R&D Innovation Expenditures In Europe. Average Values.
3. R&D Expenditure Business Sector: is an indicator that considers the overall expenditure on R&D in the whole private sector compared to the Gross Domestic Product. It is therefore an indicator that captures the creation of new knowledge by companies. This indicator is particularly useful in those industrial sectors that are significantly aimed at scientific research, i.e. the pharmaceutical sector, the chemical sector and electronics. Obviously, there is a negative relationship between the value of private sector R&D spending as a percentage of GDP and the value of non-R & D expenditures. As we have already underlined in the previous points, non-R & D expenditures is typically associated with the presence of small and medium-sized enterprises while business R&D investment is typical of large and very large industrial organizations (Leogrande et al., 2020).
4. Enterprises Providing ICT Training: is an indicator that considers the number of companies that have developed the ICT skills of their employees with respect to the total number of companies. ICT skills are essential for the development of the digital economy in the knowledge and information economy. Furthermore, this indicator is considered in the EIS-European Innovation Scoreboard as a proxy of the ability of companies to improve the skills of employees in a broad sense. There is a negative relationship between the ability of companies to develop employees' ICT skills and the overall value of non-R&D Expenditures. This negative relationship is since employees' ICT skills generally support strong technological innovation, i.e. the type of innovation that emanates directly from R&D (Laureti et al., 2022).
5. Medium and High-Tech Product Exports: is an indicator that considers the technological competitiveness of the EU or the ability to commercialize products and services that are the result of investment in research and development. This value makes it possible to enhance the new technologies that are considered vital for the competitiveness of the countries. Medium- and high-tech products are essential for economic development, for the growth of productivity and well-being and for the development of well-paid employment. There is therefore a negative relationship between the export value of medium and high technology products and the value of non-R & D expenditures. This negative relationship can be understood considering obviously that countries that export medium and high technology products invest more in R&D than non-R&D activities (Angelo et al., 2022).
6. Most-Cited Publications: is the number of scientific publications that fall into the top-10% in terms of citations worldwide out of the total number of scientific publications. This indicator is considered a measure of the efficiency of research systems as the most cited scientific publications are of a high standard. There is a negative relationship between the value of the most cited scientific publications and the value of non-R&D expenditure at country level. This relationship can be better understood considering that obviously in countries where scientific research systems are more competitive there is also an orientation towards R&D rather than non-R&D activities. As we have already pointed out, non-R&D activities are typical of small and medium-sized enterprises which generally do not have research and development departments and therefore are unable to use the research outputs of top scientists or top universities.
7. Intellectual Assets: is a variable made up of three sub-variables, namely “PCT patent Applications”, “Trademark Applications”, “Design Applications”. There is a negative relationship between the “Intellectual Assets” variable and the value of non-R&D Expenditures. This negative relationship can be better understood considering that intellectual goods are generally produced because of investment in that kind of strong technological innovation that relates to R&D. However, in this regard, the only “Trademark Applications” that we have previously found is an exception, which instead has a positive relationship with non-R&D expenditures. However, if “Trademark Applications” is added to other forms of intellectual assets, the overall value is negatively associated with the value of non-R&D expenditures (Costantiello et al., 2021).
8. Human Resources: is a variable made up of the sum of three sub-variables, namely: “New Doctorate Graduates”, “Population aged 25-34 with tertiary education” and “Lifelong learning”. There is a negative relationship between the value of Human Resources and the value of non-R&D Expenditures. However, the data is counterfactual and seems to be contradictory with respect to the analysis of the previous points. In fact, if the constituent sub-variables of "Human Resources" are taken individually, it is possible to verify that there is a positive relationship between the individual variables and the value of non-R&D expenditures. This condition can be understood considering that countries that have very high levels of Human Resources obviously tend to invest more in R&D rather than non-R&D activities. In summary, we must therefore conclude that if there is a too high level of human capital then the impact on non-R&D expenditures is negative, while if human capital is moderately developed in the individual Human Resources sub-variables, then the impact on non-R&D expenditures is positive (Leogrande & Costantiello, 2021).
9. Government Procurement of Advanced Technology Products: is an indicator that considers the government's ability to promote technological innovation through purchases. In other words, a low value is assigned to the variable if the government chooses its technological supplies only based on price, on the contrary a value of 7 is assigned if the criterion of performance and innovation is chosen in the choice of supplies. There is a negative relationship between the value of the government's ability to stimulate technological innovation with its purchases and non-R&D expenditures. Obviously, governments that are more oriented towards making purchases based on innovation will also tend to privilege R&D products while discarding companies that have optimized non-R&D activities Figure 2.

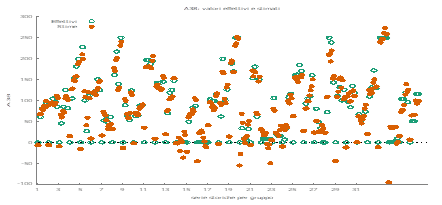
Figure 2: Value Of The Impact Of The Model Variables On Non-R & D Expenditures Obtained As The Average Of The Econometric Models Tested I.E .: Wls, Pooled Ols, Dynamic Panel, Panel Data With Fixed Effects, Panel Data With Random Effects.
Rankings and Clusterization with k-Means Algorithm
In this paragraph we first present the rankings of countries by value of non-R & D expenditures and then we present an analysis of the concretization with the k-Means algorithm to verify the presence of clusters in the data. The reference period of the data is 2014-2021.
Serbia ranks first by value of Non-R&D Innovation Expenditures in 2021 with a value of 234.17 units, followed by Estonia with a value of 220.69 units and Lithuania with a value of 1 162.60 unit. In the middle of the table there are Norway with a value of 78.00 units, followed by Finland with a value of 77.59 units and Iceland with a value of 77.19 units. Slovenia closes the ranking with a value of 8.62 units, followed by Bosnia and Romania with a value of 0.00 units. On average, the value of Non-R&D Innovation Expenditures in 2021 was equal to a value of 85.07 units. Luxembourg is in first place by value of the percentage change of Non-R&D Innovation Expenditures between 2016 and 2021 with a value equal to 245.43% equal to a value of 47.99 units, followed by Norway with a value equal to 159.88% equal to a value of 47.99 units and from Spain with a value equal to 90.13% equal to an amount of 38.23 units. In the middle of the table there are Germany with a value equal to 5.44% equal to an amount of 8.29 units, followed by Croatia with a value of 2.37% equal to an amount of 2.82 units, and Slovakia. with a value of 2.12% equal to an amount of 2.19 units. Turkey closes the ranking with a value equal to -79.27% equal to an amount of -185.62 units, followed by Slovenia with a value equal to -87.12% equal to an amount of -58.13 units and from Romania with a value equal to -100.00% equal to an amount of -40.38 units Figure 3.

Figure 3:Clusterization With The K-Means Algorithm Optimized With The Elbow Method.
A clustering is carried out below with the k-Means algorithm optimized with the Silhouette coefficient. The clusters are identified below:
1. Cluster 1: Latvia, Sweden, Malta, Greece, Czech Republic, Hungary, Portugal, Slovakia, Slovenia, Bosnia, Ukraine, Montenegro, Cyprus, Luxembourg, Norway, Netherlands, Romania, United Kingdom, Bulgaria, Italy, Belgium, Finland, Iceland, Denmark, Spain, Austria, France, Ireland.
2. Cluster 2: Serbia, Turkey, Lithuania, Germany, Estonia, Croatia, Poland, North Macedonia.
Considering the value of the median of the countries by value of the Non-R & D Innovation Expenditures, it appears that the median value of the countries in cluster 2 is higher than cluster 1. In particular, the following ordering of clusters is shown: C2=142.65>C1=69.74.However, to have a further comparison on the accuracy of the number of clusters, a further clustering model was created using the Elbow method. Using the Elbow method, it is possible to verify the presence of three different clusters, namely:
1. Cluster 1: Netherlands, Luxembourg, Montenegro, Bosnia, Romania, Spain, Denmark, Ireland, France, Finland, Norway, Austria, Cyprus, United Kingdom;
2. Cluster 2: Serbia, Turkey, Lithuania, Estonia, Germany;
3. Cluster 3: Greece, Czech Republic, Hungary, Sweden, Slovakia, North Macedonia, Portugal, Ukraine, Latvia, Malta, Poland, Slovenia, Italy, Croatia, Iceland, Belgium, Bulgaria.
From the point of view of the median, the following ordering of the clusters results, i.e. C2 = 162.60> C3 = 93.54> C1 = 63.13.
Considering the comparison between the optimization of the k-Means algorithm with the Silhouette coefficient and the optimization of the k-Means algorithm with the Elbow method, we choose the optimization with the Elbow method. This choice is due since the heterogeneity of European economies is such as to require a number of clusters greater than 2. In fact, since there is a relationship between growth in gross domestic product and investment in technological innovation, and since there are enormous per capita income gaps between the various European countries it follows that the optimization of the k-Means algorithm with the largest number of clusters is the preferred one.
Network Analysis with the Distance of Manhattan as a Tool to a Further Optimization of Clusterization with k-Means Algorithm
Since the k-Means algorithm is unsupervised, it follows that the decision about the number of clusters rests with the analyst. Furthermore, the comparison between the Silhouette coefficient and the Elbow Method may be insufficient to identify the optimal number of clusters, although using two methods is certainly better than using only one. In this regard, as further proof of the structure of the clusters, a network analysis is presented with the use of the Manhattan distance. In particular, in the following analysis we try to understand whether the detected network structures, i.e. those structures that have a node value greater than three, are coherent or not with the cluster structure obtained by comparing the Silhouette Coefficient and the Elbow Method as in the previous paragraph. Obviously, if the network analysis is not coherent with the optimization of the k-Means algorithm then we propose a modification of the number of k to maximize the ability of design the optimal number of clusters.
The application of the algorithm shows that there are the analysis shows that there are four complex network structures and three structures with simplified networks. There is a relationship between Ireland, France, Austria, Iceland, Italy, Belgium, Ukraine, and Slovenia. In particular:
1. Ireland has a connection with France for a value equal to a value of 0.99 units, with Austria for an amount of 0.22;
2. France has a connection with Ireland for a value of 0.99 units and with Austria for a value of 0.28 units;
3. Austria has a connection with France for a value of 0.28 units, with Ireland for a value of 0.22 units and with Iceland for a value of 0.36 units;
4. Iceland has a connection with Austria for a value of 0.36 units, with Italy for a value of 0.27 units and with Belgium for a value of 0.22 units;
5. Belgium has a connection with Iceland for a value of 0.2 units, with Italy for a value of 0.27 units and with Austria equal to an amount of 0.36 units;
6. Italy has a connection with Ireland for a value of 0.27 units, with Belgium for a value of 0.44 units and with Ukraine for a value of 0.3 units;
7. Ukraine has a connection with Italy for a value of 0.3 units and with Slovenia for a value of 0.41 units.
There is a complex network structure between Bosnia, Montenegro, Luxembourg, Netherlands or Figure 4:

Figure 4: Network Structures Deriving From The Application Of Manhattan's Distance.
1. Luxembourg has a connection with Montenegro for a value of 0.32, with the Netherlands for a value of 0.34;
2. Bosnia has a connection with Montenegro for a value of 0.34 units;
3. Montenegro has a connection with Luxembourg for a value of 0.32 units, with the Netherlands for a value of 0.24 units, with Bosnia for a value of 0.34 units;
4. The Netherlands has a connection with Luxembourg for a value of 0.34 units and with Montenegro for a value of 0.24 units.
5. Montenegro is the country most connected in the network structure analyzed with 4 connections.
There is a complex network structure between North Macedonia, Poland, and Croatia. Particularly:
1. Croatia has a connection with Poland for a value of 0.42 units;
2. Poland has a connection with Croatia for a value of 0.42 units and with North Macedonia for a value of 0.4 units;
3. Northern Macedonia has a connection with Poland for a value of 0.4 units.
4. Poland is the country with greater connections in this network structure with a number of connections of 2 out of 3 knots.
There is a connection between Portugal, Hungary, and Greece or:
1. Portugal has a connection with Hungary for a value of 0.37 units;
2. Hungary has a connection with Portugal for a value of 0.37 units and with Greece for a value of 0.4 units;
3. Hungary has a connection with Greece for a value of 0.4 units.
In this Network structure Hungary is the most connected country with a number of connections equal to 2 out of three knots. In addition, there are three structures with simplified networks or:
1. Spain and Denmark are connected with a value of 0.35 units;
2. The Czech Republic and Sweden are connected with a value of 0.34 units;
3. Norway and the United Kingdom are connected with a value of 0.28 units.
If we compare the network analysis network optimized with the distance of Manhattan with the clusterization made with the K-means algorithm optimized with the silhouette coefficient we can verify that the Cluster 1 is made up of two complex networks structures. It follows that by further optimizing the K-means algorithm in the light of the results of the complex network structure it appears that the optimal number of Clusters is 4. In fact, putting k = 4 in the k-Means algorithm is possible to obtain clusters that reflect in the best way the complex network structures analyzed with the distance of Manhattan Figure 5.

Figure 5:Clusterization As Suggested By Complex Network Structures With Distance Of Manhattan.
Therefore, we propose clusterization with the k-Means algorithm with a number of clusters equal to 4 as resulting from the comparison between the clustering with the Elbow method and the network analysis optimized with the Manhattan distance.
1. Cluster 1: Turkey, Serbia, Lithuania.
2. Cluster 2: Poland, North Macedonia, Croatia, Germany, Latvia, Greece, Sweden, Malta, Estonia, Czech Republic, Hungary;
3. Cluster 3: Austria, Iceland, France, Ireland, United Kingdom, Belgium, Bulgaria, Italy, Finland, Norway, Slovenia, Cyprus, Ukraine, Spain, Portugal, Denmark, Slovakia;
4. Cluster 4: Montenegro, the Netherlands, Bosnia, Luxembourg, Romania;
Analyzing the median value of the clusters Table 2, the following order is obtained, i.e. C1 = 162.6> C2 = 121.15> C3 = 77.19> C4 = 10.01.
| Table 2 Optimization Of The K-Means Algorithm With Silhouette Coefficient, The Elbow Method, And The Distance Of Manhattan |
||||
|---|---|---|---|---|
| k | Silhouette Coefficient | Optimization | Optimal Choices | Motivations |
| 2 | 0,494 | Silhouette Coefficient | 3 | The best choice in the sense of Silhouette Coefficient |
| 3 | 0,372 | Elbow Method | 2 | The best choice in the sense of the Elbow Method |
| 4 | 0,425 | Network Analysis with Distance of Manhattan | 1 | It matches the two complex networks structures analyzed with the Distance of Manhattan, it is the second best choice in the sense of the Silhouette Coefficient with an ability to explain the European heterogeneity better than the Elbow Method |
| 5 | 0,407 | Residual k-Means Clusters | ||
| 6 | 0,408 | |||
| 7 | 0,341 | |||
| 8 | 0,356 | |||
| 9 | 0,350 | |||
| 10 | 0,382 | |||
| 11 | 0,350 | |||
| 12 | 0,313 | |||
Prediction with Original Data-OD
A comparison of eight machine learning algorithms for predicting the future value of “Non-R & D Innovation Expenditures” is presented below. The algorithms are ordered according to the predictive performance calculated in terms of minimization of statistical errors and maximization of R-Squared. The statistical errors used are: Mean absolute error, Mean squared error and Root mean squared error. The algorithms were trained with 70% of the available data while 30% of the data was used for actual prediction. For the evaluation of the algorithms, rankings are identified. The value of the positioning of each algorithm in each of the four rankings is then calculated, i.e. for R-Squared, Mean absolute error, Mean squared error and Root mean squared error. Finally, the rankings are added up and the algorithm with the lowest ranking is chosen, which is therefore the highest ranking in the rankings combinations Table 3. Therefore, the following ordering of the algorithms derives, namely:
| Table 3 Prediction With The Application Of The Gradient Boosted Trees Regression Algorithm |
|||||||||
|---|---|---|---|---|---|---|---|---|---|
| Country | 2021 | Prediction | Absolute Variation | Percentage Variation | Country | 2021 | Prediction | Absolute Variation | Percentage Variation |
| Austria | 48,87 | 60,71 | 11,84 | 24,23 | Lithuania | 162,60 | 133,39 | -29,21 | -17,96 |
| Belgium | 106,93 | 102,38 | -4,55 | -4,26 | Luxembourg | 33,73 | 10,02 | -23,71 | -70,28 |
| Bosnia and Herzegovina | 0,00 | 16,65 | 16,65 | Malta | 103,46 | 113,58 | 10,12 | 9,78 | |
| Bulgaria | 48,37 | 8,62 | -39,75 | -82,18 | Montenegro | 10,01 | 15,26 | 5,25 | 52,42 |
| Croatia | 121,56 | 99,32 | -22,24 | -18,29 | Netherlands | 15,24 | 10,04 | -5,19 | -34,08 |
| Cyprus | 124,52 | 113,21 | -11,32 | -9,09 | North Macedonia | 124,51 | 121,63 | -2,88 | -2,31 |
| Czechia | 124,59 | 81,66 | -42,93 | -34,46 | Norway | 78,00 | 42,00 | -35,99 | -46,15 |
| Denmark | 70,45 | 39,55 | -30,90 | -43,86 | Poland | 87,91 | 147,42 | 59,51 | 67,69 |
| Estonia | 220,69 | 111,76 | -108,93 | -49,36 | Portugal | 47,99 | 110,93 | 62,94 | 131,15 |
| Finland | 77,59 | 74,63 | -2,96 | -3,81 | Romania | 0,00 | 67,73 | 67,73 | |
| France | 64,70 | 76,73 | 12,03 | 18,59 | Serbia | 234,17 | 154,54 | -79,63 | -34,00 |
| Germany | 160,79 | 119,27 | -41,52 | -25,82 | Slovakia | 105,70 | 66,52 | -39,19 | -37,07 |
| Greece | 121,15 | 67,33 | -53,82 | -44,43 | Slovenia | 8,62 | 72,69 | 64,07 | 742,94 |
| Hungary | 67,26 | 124,24 | 56,98 | 84,71 | Spain | 80,65 | 70,19 | -10,45 | -12,96 |
| Iceland | 77,19 | 116,77 | 39,58 | 51,27 | Sweden | 75,83 | 123,79 | 47,97 | 63,26 |
| Ireland | 69,03 | 64,91 | -4,12 | -5,96 | Turkey | 48,55 | 154,54 | 105,99 | 218,32 |
| Italy | 121,56 | 76,14 | -45,42 | -37,36 | Ukraine | 93,55 | 108,63 | 15,09 | 16,13 |
| Latvia | 65,08 | 131,96 | 66,89 | 102,79 | United Kingdom | 61,58 | 74,63 | 13,05 | 21,19 |
1. Gradient Boosted Trees Regression with a payoff of 5;
2. Tree Ensemble Regression with a payoff of 10;
3. PNN-Probabilistic Neural Network with a payoff value of 12;
4. Random Forest with a payoff value of 14;
5. ANN-Artificial Neural Network with a payoff value of 19;
6. Polynomial Regression with a payoff value of 25;
7. Linear Regression with a payoff value of 27;
8. Simple Regression Tree with a payoff value of 32.
Therefore by applying the best predictor algorithm or the Gradient Boosted Trees Regression it is possible to verify the following predictions Figure 6:
1. Austria with an increase from an amount of 48.87 units up to a value of 60.71 units or a change equal to an amount of 11.84 units equal to a value of 24.23;
2. Belgium with a decrease from an amount of 106.93 units up to a value of 102.38 units or equal to an amount of -4.55 units equal to an amount of -4.26%;
3. Bosnia with a variation from an amount of 0.00 units up to a value of 16.65 units;
4. Bulgaria with a decrease from an amount of 48.37 units up to a value of 8.62 units or equal to a variation of -39.75 units equal to an amount of -82.18%;
5. Bulgaria with a variation from an amount of 121.56 units up to a value of 99.32 or a variation equal to an amount of -22.24 units equal to an amount of -18.29%;
6. Cyprus with a variation from an amount of 124.52 units up to a value of 113.21 units or equal to a value of -11.32 units equal to a value of -9.09%;
7. Czech Republic with a variation from an amount of 124.59 units up to a value of 81.66 or equal to a value of -42.93 units equal to a value of -34.46%;
8. Denmark with a variation from an amount of 70.45 units up to a value of 39.55 units or equal to a variation of -30.90 units equal to a value of -43.86%;
9. Estonia with a variation from an amount of 220.69 units up to a value of 111.76 units equal to an amount of -108.93 units or equal to a value of -49.36%;
10. Finland with a variation from an amount of 77.59 units up to a value of 74.63 units or equal to a variation of -2.96 units equal to a value of -3.81%;
11. France with an increase from an amount of 64.70 units up to a value of 76.73 units or equal to a value of 12.03 units equal to an amount of 18.59%;
12. Germany with a variation from an amount of 160.79 units up to a value of 119.27 units or equal to a value of -41.52 units equal to a value of -25.82%;
13. Greece with a variation from an amount of 121.15 units up to a value of 67.33 units or equal to a value of -53.82 units equal to an amount of -44.43%;
14. Hungary with a change from an amount of 67.26 units equal to a value of 124.24 units or equal to a value of 56.98 units equal to an amount of 84.71%;
15. Iceland with a variation from an amount of 77.19 units up to a value of 116.77 units or equal to an amount of 39.58 units equal to a value of 51.27%;
16. Ireland with a variation from an amount of 69.03 units up to a value of 64.91 units or equal to an amount of -4.12 units equal to a value of -5.96%;
17. Italy with a variation from an amount of 121.56 units up to a value of 76.14 units or equal to a value of -45.42 units equal to a value of -37.36%;
18. Latvia with a variation to an amount of 65.08 units up to a value of 131.96 units or equal to a value of 66.89 units equal to a value of 102.79%;
19. Lithuania with a variation from an amount of 162.60 units up to a value of 133.39 units or equal to a variation of -29.21 units equal to an amount of -17.96%;

Figure 6:Variations Of "Non R&D Innovation Expenditures" As Predicted With The Gradient Boosted Trees Regression Algorithm.
1. Luxembourg with a decrease from an amount of 33.73 units up to a value of 10.02 units or equal to a value of -23.71 units equal to an amount of -70.28%;
2. Malta with a variation from an amount of 103.46 units up to a value of 113.58 units or equal to a variation of 10.12 units equal to an amount of 9.78%;
3. Montenegro with a variation from an amount of 10.01 units up to a value of 15.26 units equal to an amount of 5.25 units equal to a value of 52.42%;
4. Netherlands with a variation from an amount of 15.24 units up to a value of 10.04 units or equal to a variation of -5.19 units equal to a value of -34.08%;
5. North Macedonia with a variation from an amount of 124.51 units up to a value of 121.63 units or equal to a value of -2.88 units equal to a value of -2.31%;
6. Norway with a variation from an amount of 78.00 units up to a value of 42.00 units or equal to a value of -35.99 units equal to a value of -46.15%;
7. Poland with a variation from an amount of 87.19 units up to a value of 147.42 units or equal to a value of 59.51 units equal to a value of 67.69%;
8. Portugal with a variation from an amount of 47.99 units up to a value of 110.93 units or equal to a value of 62.94 units equal to an amount of 131.15%;
9. Romania with a variation from an amount of 0.00 units up to a value of 67.73 units;
10. Serbia with a variation from an amount of 234.17 units up to a value of 154.54 units or equal to a variation of -79.63 units equal to a variation of -34.00%;
11. Slovakia with a variation from an amount of 105.70 units up to a value of 66.52 units or equal to a value of -39.19 units equal to a value of -37.07%;
12. Slovenia with a variation from an amount of 8.62 units up to a value of 72.69 units equal to a value of 64.07 units equal to an amount of 742.94%;
13. Spain with a variation from an amount of 80.65 units up to a value of 70.19 units or equal to a value of -10.45 units equal to a value of -12.96%;
14. Sweden with a variation from an amount of 75.83 units up to a value of 123.79 units or equal to a value of 47.97 units equivalent to an amount of 63.26%;
15. Turkey with a variation from an amount of 48.55 units up to a value of 154.54 units or equal to an amount of 105.99 units equal to an amount of 218.32%;
16. Ukraine with a variation from an amount of 93.55 units up to a value of 108.63 units or equal to a value of 15.09 units equal to a value of 16.13%;
17. United Kingdom with a variation from an amount of 61.58 units up to a value of 74.63 units or equal to a value of 13.05 units equal to a value of 21.19% Table 4.
| Table 4 Statistical Results Of The Prediction With Machine Learning Algorithms |
||||
|---|---|---|---|---|
| Statistical Measures | ANN | PNN | Gradient Boosted Trees Regression | Random Forest |
| R^2 | -0,1974600381 | -0,0827754202 | 0,0364087507 | 0,2175561535 |
| Mean Absolute Error | 0,2471445231 | 0,2259009863 | 0,1762310847 | 0,2483272007 |
| Mean Squared Error | 0,1018042964 | 0,0847154900 | 0,0665028392 | 0,0916161006 |
| Root Mean squared Error | 0,3190678555 | 0,2910592552 | 0,2578814441 | 0,3026815168 |
| Mean Signed Difference | -0,0605295054 | 0,1640246306 | -0,0222549711 | -0,1217597094 |
| Statistical Measures | Linear Regression | Polynomial Regression | Simple Regressione Tree | Tree Ensemble Regression |
| R^2 | -1,36236754996 | -1,52832240332 | -2,12493831222 | -0,09172312996 |
| Mean Absolute Error | 0,36048516108 | 0,33511187440 | 0,49555340780 | 0,18638984481 |
| Mean Squared Error | 0,22533464135 | 0,20505432740 | 0,34553663512 | 0,08359316364 |
| Root Mean squared Error | 0,47469426092 | 0,45282924751 | 0,58782364287 | 0,28912482364 |
| Mean Signed Difference | -0,36048516108 | 0,10741389508 | 0,17509442656 | 0,07285675271 |
Prediction with Augmented Data-AD
A further prediction is then made through the use of augmented data. The augmented data are obtained by adding the prediction to the original data. Therefore, as indicated in the previous paragraph, the prediction made with the best predictor algorithm or the "Gradient Boosted Trees Regression" is added to the time series. The same analytical process of the previous paragraph is then repeated. The algorithms are trained using 70% of the available data. The remaining 30% is used for prediction. The algorithms are classified according to their performance in terms of reduction of statistical errors or Mean absolute error, Mean squared error and Root mean squared error and maximization of R-squared Table 5. The following ordering of the algorithms by predictive capacity is then determined, that is:
| Table 5 Statistical Measures With Augmented Data |
||||
|---|---|---|---|---|
| Statistical Measures | ANN | PNN | Gradient Boosted Trees Regression | Random Forest Regression |
| R^2 | 0,552648493 | 0,561875098 | 0,708496054 | 0,729234303 |
| Mean Absolute Error | 0,164151345 | 0,167248722 | 0,129691555 | 0,142714919 |
| Mean Squared Error | 0,056107783 | 0,049782381 | 0,029177825 | 0,024286633 |
| Root Mean squared Error | 0,236870816 | 0,223119655 | 0,170815177 | 0,155841692 |
| Statistical Measures | Linear Regression | Polynomial Regression | Simple Regression Tree | Tree Ensemble Regression |
| R^2 | -1,646763808 | 0,494676113 | -1,203317934 | 0,779869189 |
| Mean Absolute Error | 0,487988170 | 0,178786642 | 0,312916686 | 0,121102813 |
| Mean Squared Error | 0,382738774 | 0,060220915 | 0,169199245 | 0,023482421 |
| Root Mean squared Error | 0,618658851 | 0,245399502 | 0,411338359 | 0,153239750 |
1. Tree Ensemble Regression with a payoff value of 4;
2. Random Forest Regression with a payoff value of 8;
3. Gradient Boosted Trees Regression with a payoff value of 12;
4. PNN with a payoff value of 16;
5. ANN with a payoff value of 20;
6. Polynomial Regression with a payoff value of 24;
7. Simple Regression Tree with a payoff value of 28;
8. Linear Regression with a payoff value of 32.
Therefore, by applying the best predictor algorithm or the Tree Ensemble Regression it is possible to make the following predictions:
1. Austria with a variation from an amount of 60.71 units up to a value of 81.81 or an amount equal to 21.10 units equivalent to a value of 34.75%;
2. Bulgaria with a variation from an amount of 8.62 units up to a value of 98.86 units or equal to a variation of 90.06 units equal to an amount of 1045.08%;
3. Croatia with a variation from an amount of 99.32 units up to a value of 126.55 units or equal to a value of 27.23 units equal to an amount of 27.42%;
4. Czech Republic with a variation from an amount of 81.66 units up to a value of 100.54 units or equal to a value of 18.88 units equal to an amount of 23.12%;
5. Germany with a variation from an amount of 119.27 units up to a value of 134.66 units or equal to a value of 15.39 units or equal to a variation of 12.91%;
6. Hungary with a variation from an amount of 124.24 units up to a value of 97.39 units or equal to a value of -26.85 units or equal to a value of -21.61%;
7. Ireland with a variation from an amount of 64.91 units up to a value of 74.83 units or equal to a value of 9.91 units equal to an amount of 15.27%;
8. Lithuania with a variation from an amount of 133.39 units up to a value of 141.23 units or equal to a value of 7.83 units equal to a value of 5.87%;
9. Luxembourg with a variation from an amount of 10.02 units up to a value of 15.77 units or equal to a value of 5.75 units equal to a value of 57.36%;
10. Portugal with a variation from an amount of 110.93 units up to a value of 100.57 units or equal to a value of 10.36 units equal to an amount of -9.34%;
11. Slovenia with a variation from an amount of 72.69 units up to a value of 97.74 units or equal to a value of 25.05 units equal to a value of 34.46%;
On average, for the countries considered, an increase in the value of the variable “Non R&D Innovative Expenditures” is expected equal to a value of 16.73 units or 20.77% Table 6.
| Table 6 Prediction With The Tree Ensemble Regression |
||||
|---|---|---|---|---|
| Gradient Boosted Trees Regression | Tree Ensemble Regression | Absolute Variation | Percentage Variation | |
| Austria | 60,71 | 81,81 | 21,10 | 34,75 |
| Bulgaria | 8,62 | 98,68 | 90,06 | 1045,08 |
| Croatia | 99,32 | 126,55 | 27,23 | 27,42 |
| Czechia | 81,66 | 100,54 | 18,88 | 23,12 |
| Germany | 119,27 | 134,66 | 15,39 | 12,91 |
| Hungary | 124,24 | 97,39 | -26,85 | -21,61 |
| Ireland | 64,91 | 74,83 | 9,91 | 15,27 |
| Lithuania | 133,39 | 141,23 | 7,83 | 5,87 |
| Luxembourg | 10,02 | 15,77 | 5,75 | 57,36 |
| Portugal | 110,93 | 100,57 | -10,36 | -9,34 |
| Slovenia | 72,69 | 97,74 | 25,05 | 34,46 |
| Average Value | 80,53 | 97,25 | 16,73 | 20,77 |
In a statistical comparison between the prediction made using the Original Data-AD and the Augmented Data-AD, it appears that:
1. The R-Squared value increases by 0.7 units in an absolute sense corresponding to a value of 2041%;
2. The value of the Mean Absolute Error decreases from 0.1762311 to 0.1211028 with an absolute change equal to an amount of -0.0551283 and equivalent percentage from 31.3%;
3. The Mean Squared Error value goes from 0.0665028 to 0.0234824 or an absolute variation of -0.0430204 equal to a percentage variation of -64.6895961%;
4. The Root Mean Squared Error goes from an amount of 0.2578814 up to a value of 0.1532398 or equal to a variation of -0.1046417 equal to an amount of -40.6%;
5. On average, the value of statistical errors is reduced by about 40.5%.
It therefore follows that the prediction with the Augmented Data-AD is much more efficient than the prediction with the Original Data-OD from the point of view of maximizing the R-squared and minimizing statistical errors Table 7.
| Table 7 Confrontation Between Original Data-Od And Augmented Data-Ad In Terms Of Statistical Efficiency |
||||
|---|---|---|---|---|
| Statistical Measures | Original Data-OD | Augmented Data-AD | Statistical Efficiency=AD-OD | |
| Gradient Boosted Trees Regression | Tree Ensemble Regression | Absolute Variation | Percentage Variation | |
| R^2 | 0,0364088 | 0,7798692 | 0,7434604 | 2041,9828272 |
| Mean Absolute Error | 0,1762311 | 0,1211028 | -0,0551283 | -31,2818093 |
| Mean Squared Error | 0,0665028 | 0,0234824 | -0,0430204 | -64,6895961 |
| Root Mean squared Error | 0,2578814 | 0,1532398 | -0,1046417 | -40,5774421 |
| Average of Statistical Errors | 0,1668718 | 0,0992750 | -0,0675968 | -40,5082218 |
Conclusions
In this article we have estimated the value of “Non-R&D Innovation Expenditures” in Europe. To facilitate the analytical treatment of the topic, we have introduced a distinction between strong technological innovation based on R&D and weak technological innovation based on non-R & D expenditures. Strong technological innovation is typically typical of large industrial and manufacturing companies that invest in R&D. Weak technological innovation is typical of small and medium-sized enterprises operating through non-R&D expenditures. Both are relevant and closely connected especially in countries with low and medium endowments of human capital and technology.
We have used data from the European Innovation Scoreboard-EIS of the European Commission from the period 2010-2019. We test data with the following econometric models i.e.: Pooled OLS, Dynamic Panel, Panel Data with Fixed Effects, Panel Data with Random Effects, WLS. We have found that “Non-R&D Innovation Expenditures” is positively associated among others to “Innovation Index” and “Firm Investments” and negatively associated among others to “Human Resources” and “Government Procurement of Advanced Technology Products”. In the light of the analysis of the literature, it appears that the value of non-R & D Expenditures is essential to allow small and medium-sized enterprises to connect to the digital transformation and to participate, albeit marginally, in technological innovation systems at national level. Obviously, small and medium-sized enterprises do not have the possibility of setting up research and development departments as is the case in large industrial enterprises and therefore must try to optimize the positive externalities that derive from participating in innovation-oriented economic systems. In this sense, the phenomena of open innovation and cooperation between organizations and companies are very important to promote a culture of innovation also among small and medium-sized enterprises.
Furthermore, we have used the k-Means algorithm with either the Silhouette Coefficient and the Elbow Method in a confrontation with the network analysis optimized with the Distance of Manhattan and we have found that the optimal number of clusters is four. From the clustering analysis it is evident that non-R&D Expenditures are typical of countries that are at low or intermediate levels in research and development and technological innovation.
Furthermore, we propose a confrontation among eight machine learning algorithms to predict the level of “Non-R&D Innovation Expenditures” either with Original Data-OD either with Augmented Data-AD. We found that Gradient Boost Trees Regression is the best predictor for OD while Tree Ensemble Regression is the best Predictor for AD. Finally, we verify that the prediction with AD is more efficient of that with OD with a reduction in the average value of statistical errors equal to 40, 50%. Overall, the predictive analysis carried out with Augmented Data-AD predicts an increase in the value of non-R&D expenditures in the countries considered. In summary, from the point of view of economic policies it is necessary to consider that the promotion of non-R&D innovation expenditures must take place locally and, if possible, regionally, having knowledge for those who are the drivers of innovation. In fact, not all European countries and regions could benefit from investing in non-R&D activities especially if they already have an R&D orientation with excellent human capital.
Declarations
1. Data Availability Statement: The data presented in this study are available on request from the corresponding author.
2. Funding: The authors received no financial support for the research, authorship, and/or publication of this article.
3. Declaration of Competing Interest: The authors declare that there is no conflict of interests regarding the publication of this manuscript. In addition, the ethical issues, including plagiarism, informed consent, misconduct, data fabrication and/or falsification, double publication.
4. Software: The authors have used the following software: Gretl for the econometric models, Orange for clusterization and network analysis, and KNIME for machine learning and predictions. They are all free version without licenses.
5. Acknowledgements: We are grateful to the teaching staff of the LUM University and to the management of the LUM Enterprise s.r.l. for the constant inspiration to continue our scientific research work undeterred.
1 Countries are: Austria, Belgium, Bulgaria, Croatia, Cyprus, Czechia, Denmark, Estonia, Finland, France, Germany, Greece, Hungary, Iceland, Ireland, Israel, Italy, Latvia, Lithuania, Luxembourg, Malta, Montenegro, Netherlands, Norway, Poland, Portugal, Romania, Serbia, Slovakia, Slovenia, Spain, Sweden, Switzerland, Turkey, Ukraine, UK.
References
Angelo, L., Costantiello, A., & Lucio, L. (2022). The Export of Medium and High-Tech Products Manufactured in Europe.Journal of Applied Economic Sciences,17(3), 181-200.
Indexed at, Google Scholar, Cross Ref
Corrado, C., Haskel, J., Iommi, M., & Jona-Lasinio, C. (2020). Intangible capital, innovation, and productivity à la Jorgenson evidence from Europe and the United States. InMeasuring Economic Growth and Productivity(pp. 363-385). Academic Press.
Indexed at, Google Scholar, Cross Ref
Costantiello, A., Laureti, L., & Leogrande, A. (2021). The Determinants of Firm Investments in Research and Development. InInternational Virtual Academic Conference Education and Social Sciences Business and Economics.
Costantiello, A., Laureti, L., & Leogrande, A. (2021). The Intellectual Assets in Europe.Available at SSRN 3956755.
Indexed at, Google Scholar, Cross Ref
Costantiello, A., Laureti, L., & Leogrande, A. (2022). The Determinants of Lifelong Learning in Europe.Available at SSRN.
Indexed at, Google Scholar, Cross Ref
Ganescu, M.C., & Serbanica, C.M. (2021). Regional innovation performance and structural conditions in Central and Eastern Europe: embracing the broad-based innovation concept, Economics and Law, 20(1), 107-119.
Indexed at, Google Scholar, Cross Ref
Guo, Y., Zheng, G., & Liu, F. (2017). Non-R&D-based innovation activities and performance in Chinese SMEs: the role of absorptive capacity. Asian Journal of Technology Innovation, 25(1), 110-128.
Indexed at, Google Scholar, Cross Ref
Hervás-Oliver, J.L., Parrilli, M.D., Rodríguez-Pose, A., & Sempere-Ripoll, F. (2021). The drivers of SME innovation in the regions of the EU.Research Policy,50(9), 104316.
Indexed at, Google Scholar, Cross Ref
Hou, J., Chen, J., Song, H., & Wang, G. (2018). Are non-R&D innovation activities actually effective for innovation sustainability? Empirical study from Chinese high-tech industry.Sustainability,11(1), 174.
Indexed at, Google Scholar, Cross Ref
Kale, S. (2022). The influence of non-R&D channels on innovation in a developing economy: an empirical analysis in the context of India.International Review of Applied Economics,36(2), 205-221.
Indexed at, Google Scholar, Cross Ref
Lacová, ?., & Hu?ady, J. (2018). The Consequences of Tax Base Rules on Enterprise Innovation in the European Union. InModeling Innovation Sustainability and Technologies(pp. 19-31). Springer, Cham.
Indexed at, Google Scholar, Cross Ref
Laureti, L., Costantiello, A., & Leogrande, A. (2020). The Finance-Innovation Nexus in Europe.IJISET-International Journal of Innovative Science, Engineering & Technology,7(12).
Laureti, L., Costantiello, A., Matarrese, M., & Leogrande, A. (2022). Enterprises Providing ICT Training in Europe.Available at SSRN.
Indexed at, Google Scholar, Cross Ref
Leogrande, A., & Costantiello, A. (2021). Human Resources in Europe. Estimation, Clusterization, Machine Learning and Prediction.Machine Learning and Prediction (September 29, 2021). American Journal of Humanities and Social Sciences Research (AJHSSR), e-ISSN.
Leogrande, A., Costantiello, A., & Laureti, L. (2022). The Impact of New Doctorate Graduates on Innovation Systems in Europe.Available at SSRN 4209643.
Indexed at, Google Scholar, Cross Ref
Leogrande, A., Costantiello, A., Laureti, L., & Matarrese, M. (2022). International Scientific Co-Publications in Europe.Available at SSRN 4117970.
Indexed at, Google Scholar, Cross Ref
Leogrande, A., Laureti, L., & Costantiello, A. (2022). The Innovation Index in Europe.Available at SSRN 4091597.
Leogrande, A., Massaro, A., & Galiano, A. M. (2020). The impact of R&D investments on corporate performance in European Countries.American Journal of Humanities and Social Sciences Research (AJHSSR),4(7), 186-201.
Lewandowska, A., & Švihlíková, I. (2020). Regional innovation system in the Podkarpackie against selected Polish and EU regions.Journal of International Studies,13(2).
Indexed at, Google Scholar, Cross Ref
Lopez-Rodriguez, J., & Martinez-Lopez, D. (2017). Looking beyond the R&D effects on innovation: The contribution of non-R&D activities to total factor productivity growth in the EU.Structural Change and Economic Dynamics,40, 37-45.
Indexed at, Google Scholar, Cross Ref
Ma, X., Jia, F., Jiang, H., & Xu, X. (2021). The Impact of Non-R&D Intangible Capital on TFP Growth: Evidence from Multi-country Industry Level Data.Journal of the Knowledge Economy, 1-21.
Indexed at, Google Scholar, Cross Ref
Spithoven, A., & Merlevede, B. (2022). The productivity impact of R&D and FDI spillovers: characterising regional path development.The Journal of Technology Transfer, 1-31.
Indexed at, Google Scholar, Cross Ref
Thomä, J., & Zimmermann, V. (2019). Non-R&D, interactive learning and economic performance: Revisiting innovation in small and medium enterprises.
Indexed at, Google Scholar, Cross Ref
Thomä, J., & Zimmermann, V. (2020). Interactive learning—The key to innovation in non-R&D-intensive SMEs? A cluster analysis approach.Journal of Small Business Management,58(4), 747-776.
Indexed at, Google Scholar, Cross Ref
Tsuji, M., Ueki, Y., Shigeno, H., Idota, H., & Bunno, T. (2018). R&D and non-R&D in the innovation process among firms in ASEAN countries: Based on firm-level survey data.European Journal of Management and Business Economics.
Wu, Z., Wang, C., He, B., & Yang, S. (2022). State?owned industrial enterprises' non?R&D innovation and regional total factor productivity: An analysis based on the panel co?integration method.Managerial and Decision Economics.
Indexed at, Google Scholar, Cross Ref
Xu, J., Wang, X., & Liu, F. (2021). Government subsidies, R&D investment and innovation performance: analysis from pharmaceutical sector in China.Technology Analysis & Strategic Management,33(5), 535-553.
Indexed at, Google Scholar, Cross Ref
Zhang, H. (2022). Non-R&D innovation in SMEs: is there complementarity or substitutability between internal and external innovation sourcing strategies?.Technology Analysis & Strategic Management, 1-15.
Indexed at, Google Scholar, Cross Ref
Appendix
Econometric Results
Modello 44: Panel dinamico a un passo, usando 288 osservazioni
Incluse 36 unità cross section
Matrice H conforme ad Ox/DPD
Variabile dipendente: A38
| Coefficiente | Errore Std, | z | p-value | ||
|---|---|---|---|---|---|
| A38(-1) | 0,156311 | 0,0445162 | 3,511 | 0,0004 | *** |
| const | −1,12443 | 1,35560 | −0,8295 | 0,4068 | |
| A4 | 0,903877 | 0,182297 | 4,958 | <0,0001 | *** |
| A15 | −0,536752 | 0,0685869 | −7,826 | <0,0001 | *** |
| A17 | −0,256517 | 0,0953443 | −2,690 | 0,0071 | *** |
| A18 | 1,86341 | 0,272131 | 6,847 | <0,0001 | *** |
| A20 | 1,08596 | 0,431686 | 2,516 | 0,0119 | ** |
| A22 | −2,53951 | 0,655027 | −3,877 | 0,0001 | *** |
| A23 | −2,72528 | 0,789698 | −3,451 | 0,0006 | *** |
| A24 | 1,54231 | 0,394180 | 3,913 | <0,0001 | *** |
| A29 | −0,614929 | 0,237087 | −2,594 | 0,0095 | *** |
| A30 | −0,336305 | 0,0648342 | −5,187 | <0,0001 | *** |
| A32 | 0,697766 | 0,216349 | 3,225 | 0,0013 | *** |
| A35 | −0,391542 | 0,132718 | −2,950 | 0,0032 | *** |
| A36 | −0,313006 | 0,112075 | −2,793 | 0,0052 | *** |
| A37 | 0,949071 | 0,254774 | 3,725 | 0,0002 | *** |
| A46 | −0,436950 | 0,180430 | −2,422 | 0,0154 | ** |
| A53 | 1,05754 | 0,232610 | 4,546 | <0,0001 | *** |
| A56 | 0,388438 | 0,149160 | 2,604 | 0,0092 | *** |
Somma quadr, residui = 121739,4
E,S, della regressione = 21,27353
Numero di strumenti = 31
Test per errori AR(1): z = -2,62423 [0,0087]
Test per errori AR(2): z = -1,00914 [0,3129]
Test di sovra-identificazione di Sargan: Chi-quadro(12) = 16,028 [0,1900]
Test (congiunto) di Wald: Chi-quadro(18) = 6511,9 [0,0000] 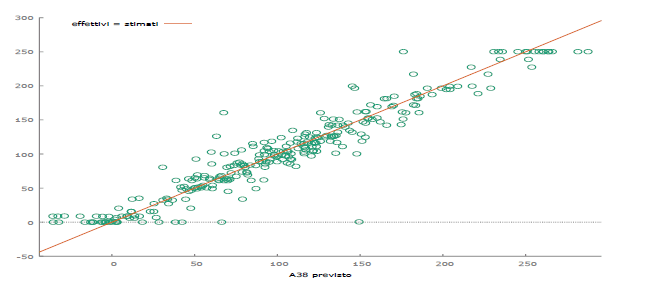
Modello 45: Effetti fissi, usando 360 osservazioni
Incluse 36 unità cross section
Lunghezza serie storiche = 10
Variabile dipendente: A38
| Coefficiente | Errore Std, | rapporto t | p-value | ||
|---|---|---|---|---|---|
| const | 1,91901 | 2,49526 | 0,7691 | 0,4424 | |
| A4 | 0,525612 | 0,101592 | 5,174 | <0,0001 | *** |
| A15 | −0,427440 | 0,0446322 | −9,577 | <0,0001 | *** |
| A17 | −0,271598 | 0,0876254 | −3,100 | 0,0021 | *** |
| A18 | 1,75944 | 0,0925546 | 19,01 | <0,0001 | *** |
| A20 | 1,45954 | 0,156524 | 9,325 | <0,0001 | *** |
| A22 | −2,88994 | 0,382113 | −7,563 | <0,0001 | *** |
| A23 | −2,37229 | 0,209102 | −11,35 | <0,0001 | *** |
| A24 | 1,77497 | 0,261976 | 6,775 | <0,0001 | *** |
| A29 | −0,737203 | 0,121843 | −6,050 | <0,0001 | *** |
| A30 | −0,312958 | 0,0498388 | −6,279 | <0,0001 | *** |
| A32 | 0,697915 | 0,0703918 | 9,915 | <0,0001 | *** |
| A35 | −0,407419 | 0,0844853 | −4,822 | <0,0001 | *** |
| A36 | −0,518309 | 0,116901 | −4,434 | <0,0001 | *** |
| A37 | 0,818977 | 0,0867209 | 9,444 | <0,0001 | *** |
| A46 | −0,491888 | 0,0809195 | −6,079 | <0,0001 | *** |
| A53 | 0,851778 | 0,0751425 | 11,34 | <0,0001 | *** |
| A56 | 0,478376 | 0,0721792 | 6,628 | <0,0001 | *** |
| Media var, dipendente | 81,64019 | SQM var, dipendente | 72,73709 |
| Somma quadr, residui | 144802,5 | E,S, della regressione | 21,71795 |
| R-quadro LSDV | 0,923762 | R-quadro intra-gruppi | 0,862689 |
| LSDV F(52, 307) | 71,53615 | P-value(F) | 7,8e-143 |
| Log-verosimiglianza | −1590,282 | Criterio di Akaike | 3286,564 |
| Criterio di Schwarz | 3492,527 | Hannan-Quinn | 3368,459 |
| rho | 0,486934 | Durbin-Watson | 0,812197 |
Test congiunto sui regressori
Statistica test: F(17, 307) = 113,459
con p-value = P(F(17, 307) > 113,459) = 3,14307e-121
Test per la differenza delle intercette di gruppo
Ipotesi nulla: i gruppi hanno un'intercetta comune
Statistica test: F(35, 307) = 11,7193
con p-value = P(F(35, 307) > 11,7193) = 1,00377e-038
Modello 46: Effetti casuali (GLS), usando 360 osservazioni
Incluse 36 unità cross section
Lunghezza serie storiche = 10
Variabile dipendente: A38
| Coefficiente | Errore Std, | z | p-value | ||
|---|---|---|---|---|---|
| const | 2,32010 | 4,64032 | 0,5000 | 0,6171 | |
| A4 | 0,549468 | 0,0917524 | 5,989 | <0,0001 | *** |
| A15 | −0,420899 | 0,0412338 | −10,21 | <0,0001 | *** |
| A17 | −0,269333 | 0,0858085 | −3,139 | 0,0017 | *** |
| A18 | 1,68930 | 0,0873966 | 19,33 | <0,0001 | *** |
| A20 | 1,55443 | 0,148664 | 10,46 | <0,0001 | *** |
| A22 | −3,18074 | 0,374124 | −8,502 | <0,0001 | *** |
| A23 | −2,41871 | 0,193812 | −12,48 | <0,0001 | *** |
| A24 | 1,94867 | 0,257103 | 7,579 | <0,0001 | *** |
| A29 | −0,844256 | 0,116656 | −7,237 | <0,0001 | *** |
| A30 | −0,343819 | 0,0481842 | −7,136 | <0,0001 | *** |
| A32 | 0,718805 | 0,0649921 | 11,06 | <0,0001 | *** |
| A35 | −0,438671 | 0,0787980 | −5,567 | <0,0001 | *** |
| A36 | −0,523271 | 0,111534 | −4,692 | <0,0001 | *** |
| A37 | 0,843214 | 0,0798347 | 10,56 | <0,0001 | *** |
| A46 | −0,459379 | 0,0769632 | −5,969 | <0,0001 | *** |
| A53 | 0,841807 | 0,0693519 | 12,14 | <0,0001 | *** |
| A56 | 0,530131 | 0,0683635 | 7,755 | <0,0001 | *** |
| Media var, dipendente | 81,64019 | SQM var, dipendente | 72,73709 |
| Somma quadr, residui | 396549,5 | E,S, della regressione | 34,00178 |
| Log-verosimiglianza | −1771,619 | Criterio di Akaike | 3579,239 |
| Criterio di Schwarz | 3649,188 | Hannan-Quinn | 3607,052 |
| rho | 0,486934 | Durbin-Watson | 0,812197 |
Varianza 'between' = 529,327
Varianza 'within' = 471,669
Theta usato per la trasformazione = 0,713963
Test congiunto sui regressori:
Statistica test asintotica: Chi-quadro(17) = 1967,05
Con p-value = 0
Test Breusch-Pagan:
Ipotesi nulla: varianza dell'errore specifico all'unità = 0
Statistica test asintotica: Chi-quadro(1) = 254,84
Con p-value = 2,28783e-057
Test di Hausman:
Ipotesi nulla: le stime GLS sono consistenti
Statistica test asintotica: Chi-quadro(17) = 30,8546
Con p-value = 0,0208008
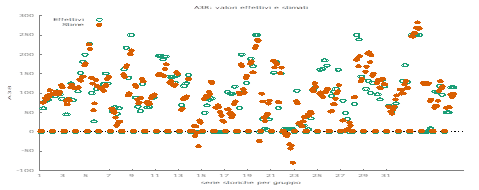
Modello 47: Pooled OLS, usando 360 osservazioni
Incluse 36 unità cross section
Lunghezza serie storiche = 10
Variabile dipendente: A38
| Coefficiente | Errore Std, | rapporto t | p-value | ||
|---|---|---|---|---|---|
| const | 6,12244 | 3,45004 | 1,775 | 0,0769 | * |
| A4 | 0,611928 | 0,0727814 | 8,408 | <0,0001 | *** |
| A15 | −0,448233 | 0,0354370 | −12,65 | <0,0001 | *** |
| A17 | −0,282843 | 0,0963248 | −2,936 | 0,0035 | *** |
| A18 | 1,47278 | 0,0830489 | 17,73 | <0,0001 | *** |
| A20 | 1,99071 | 0,144375 | 13,79 | <0,0001 | *** |
| A22 | −4,89484 | 0,415684 | −11,78 | <0,0001 | *** |
| A23 | −2,80744 | 0,171977 | −16,32 | <0,0001 | *** |
| A24 | 2,95510 | 0,293110 | 10,08 | <0,0001 | *** |
| A29 | −1,44713 | 0,116723 | −12,40 | <0,0001 | *** |
| A30 | −0,506388 | 0,0508098 | −9,966 | <0,0001 | *** |
| A32 | 0,857123 | 0,0590365 | 14,52 | <0,0001 | *** |
| A35 | −0,656141 | 0,0708951 | −9,255 | <0,0001 | *** |
| A36 | −0,528550 | 0,112567 | −4,695 | <0,0001 | *** |
| A37 | 0,985318 | 0,0679444 | 14,50 | <0,0001 | *** |
| A46 | −0,305750 | 0,0729794 | −4,190 | <0,0001 | *** |
| A53 | 0,799947 | 0,0594828 | 13,45 | <0,0001 | *** |
| A56 | 0,819691 | 0,0659156 | 12,44 | <0,0001 | *** |
| Media var, dipendente | 81,64019 | SQM var, dipendente | 72,73709 |
| Somma quadr, residui | 338270,0 | E,S, della regressione | 31,44986 |
| R-quadro | 0,821903 | R-quadro corretto | 0,813050 |
| F(17, 342) | 92,84112 | P-value(F) | 8,1e-117 |
| Log-verosimiglianza | −1743,007 | Criterio di Akaike | 3522,014 |
| Criterio di Schwarz | 3591,964 | Hannan-Quinn | 3549,828 |
| rho | 0,795060 | Durbin-Watson | 0,462061 |
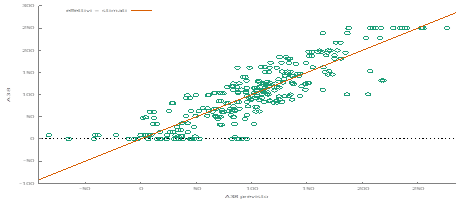
Modello 48: WLS, usando 360 osservazioni
Incluse 36 unità cross section
Variabile dipendente: A38
Pesi basati sulle varianze degli errori per unità
| Coefficiente | Errore Std, | rapporto t | p-value | ||
|---|---|---|---|---|---|
| const | 3,05082 | 2,10547 | 1,449 | 0,1483 | |
| A4 | 0,667981 | 0,0557574 | 11,98 | <0,0001 | *** |
| A15 | −0,470421 | 0,0181170 | −25,97 | <0,0001 | *** |
| A17 | −0,241636 | 0,0604274 | −3,999 | <0,0001 | *** |
| A18 | 1,76878 | 0,0627358 | 28,19 | <0,0001 | *** |
| A20 | 1,80249 | 0,137869 | 13,07 | <0,0001 | *** |
| A22 | −3,75665 | 0,287010 | −13,09 | <0,0001 | *** |
| A23 | −3,03151 | 0,122856 | −24,68 | <0,0001 | *** |
| A24 | 2,47139 | 0,192595 | 12,83 | <0,0001 | *** |
| A29 | −0,923581 | 0,114827 | −8,043 | <0,0001 | *** |
| A30 | −0,413288 | 0,0324918 | −12,72 | <0,0001 | *** |
| A32 | 0,874040 | 0,0429067 | 20,37 | <0,0001 | *** |
| A35 | −0,454560 | 0,0478338 | −9,503 | <0,0001 | *** |
| A36 | −0,467545 | 0,0743144 | −6,291 | <0,0001 | *** |
| A37 | 1,02294 | 0,0509103 | 20,09 | <0,0001 | *** |
| A46 | −0,608494 | 0,0519037 | −11,72 | <0,0001 | *** |
| A53 | 0,904887 | 0,0460513 | 19,65 | <0,0001 | *** |
| A56 | 0,502295 | 0,0624399 | 8,044 | <0,0001 | *** |
Statistiche basate sui dati ponderati
| Somma quadr, residui | 296,1601 | E,S, della regressione | 0,930572 |
| R-quadro | 0,927930 | R-quadro corretto | 0,924348 |
| F(17, 342) | 259,0241 | P-value(F) | 1,3e-183 |
| Log-verosimiglianza | −475,6812 | Criterio di Akaike | 987,3623 |
| Criterio di Schwarz | 1057,312 | Hannan-Quinn | 1015,176 |
Statistiche basate sui dati originali
| Media var, dipendente | 81,64019 | SQM var, dipendente | 72,73709 |
| Somma quadr, residui | 420388,7 | E,S, della regressione | 35,06004 |
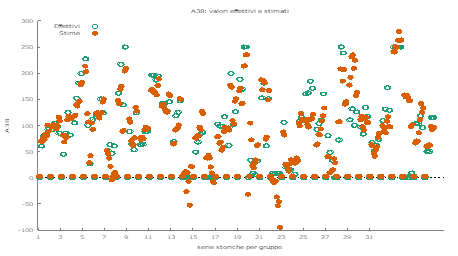
Clusterization
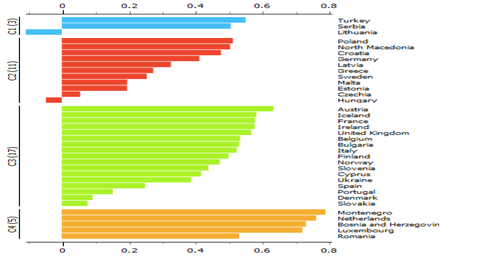
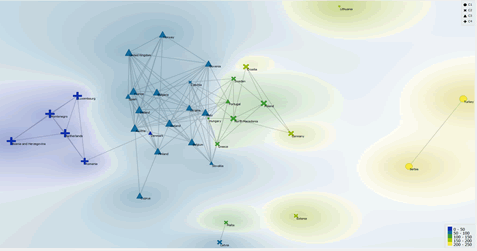
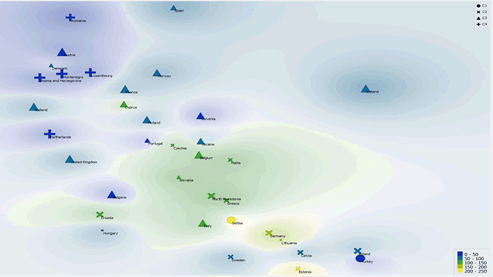
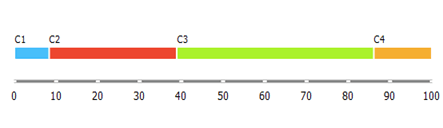
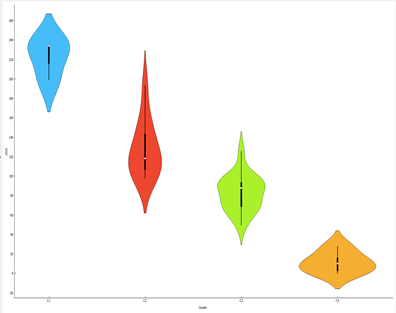
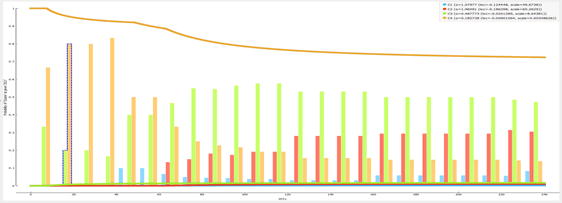
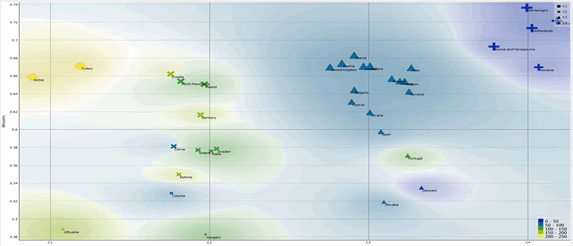
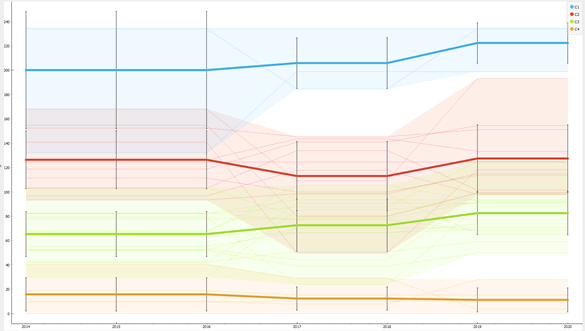
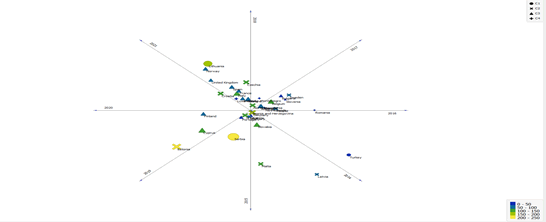
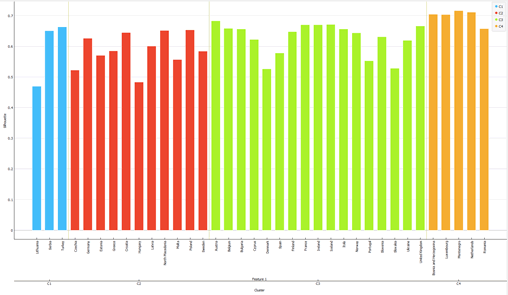
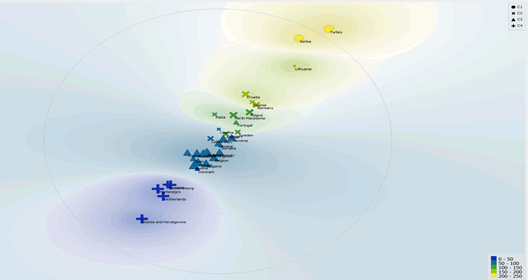
Predictions with Original Data and Augmented Data
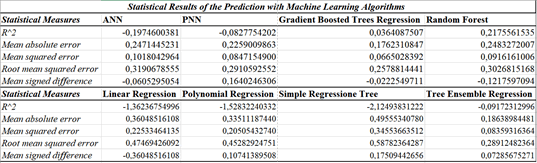
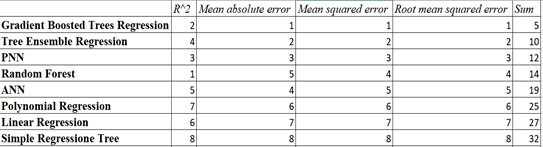
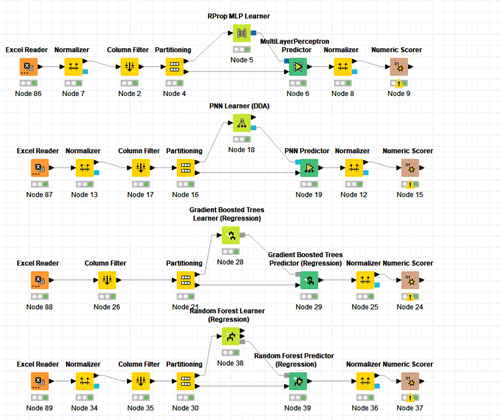
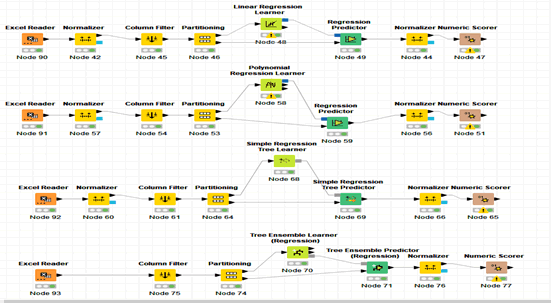
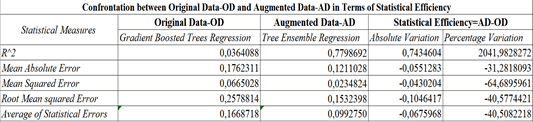
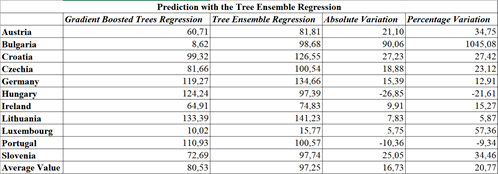
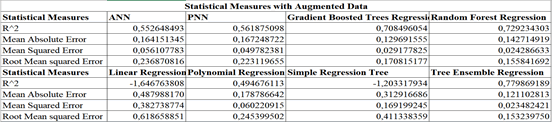
Received: 27-Oct-2022, Manuscript No. AAFSJ-22-12743; Editor assigned: 28-Oct-2022, PreQC No. AAFSJ-22-12743(PQ); Reviewed: 14-Nov-2022, QC No. AAFSJ-22-12743; Revised: 12-Jan-2023, Manuscript No. AAFSJ-22-12743(R); Published: 20-Jan-2023