Research Article: 2024 Vol: 28 Issue: 1S
The Role of Unemployment in the ESG Model at World Level
Alberto Costantiello, LUM University Giuseppe Degennaro
Angelo Leogrande, LUM University Giuseppe Degennaro
Domenico Leogrande, Università degli Studi di Bari Aldo Moro
Citation Information: Costantiello, A., Leogrande, A., & Leogrande, D., (2024). The role of unemployment in the esg model at world level. Academy of Accounting and Financial Studies Journal, 28(S1), 1-15.
Abstract
In this article, we investigate the role of Unemployment-U in the context of Environmental, Social and Governance-ESG model at World Level. We use data from 193 countries in the period 2011-2021. We apply Panel Data with Random Effects, Panel Data with Fixed Effects, Pooled Ordinary Least Squares-OLS, and Weighted Least Squares-WLS. We found that among other the level of U is positively associated, among others, to “GHG Net Emissions” and “Government Effectiveness”, and negatively associated among others, to“Maximum 5 Day Rainfall” and “Political Stability and Absence of Violence/Terrorism”. Furthermore, we confront eight different machine-learning algorithms to predict the future value of U. We found that the best predictive algorithm in terms of maximization of R-squared and minimization of MAE, MSE, and RMSE is the Linear Regression. The value of U is expected to growth of 1.51% on average for the analysed countries.
Keywords
Analysis of Collective Decision-Making, General, Political Processes, Rent-Seeking, Lobbying, Elections, Legislatures and Voting Behaviour, Bureaucracy, Administrative Processes in Public Organizations, Corruption, Positive Analysis of Policy Formulation, Implementation.
Introduction
In the following article we consider the role of unemployment in the context of ESG models. We analysed the World Bank's Environmental, Social and Governance-ESG dataset for 193 countries between 2011 and 2021. Unemployment is a variable that tends to have very negative effects in terms of GDP reduction and worsening of the living conditions of the population. Furthermore, unemployment has high environmental costs as well as creating the conditions for low-level governance. Therefore, in our research question we asked whether indeed the countries with high unemployment are also the least likely to apply ESG models effectively. Our research question has profound political-economic implications. In fact, if we accept the idea that unemployment can be an obstacle to the application of ESG models, then the need arises to direct the policy maker to apply economic policies aimed at employment growth, support for the working poor, the investment in the re-skilling of unemployed workers. The issue of unemployment also becomes much more serious when considering the role of artificial intelligence and machine learning in changing the dynamics of production. Indeed, artificial intelligence threatens to create a large swath of the population unemployed in countries with high per capita incomes. And for the first time, even highly skilled workers could experience forms of technological unemployment. Hence the need to invest more in the creation of new policies to support workers, either in low per capita income countries either in high per capita income countries, to increase the probability of application of ESG models. The article continues as follows: the second section considers a brief analysis of the literature, the third section presents the econometric model, the fourth section shows the results of the predictive analysis with the application of machine learning algorithms, the fifth section concludes.
Literature Review
A brief analysis of the literature is presented below. The analysis does not want to be exhaustive and pursues the purpose of introducing the topic.
Unemployment and Green Economy
Unemployment has an ambiguous impact in promoting the ecological transition. While on the one hand for low per capita income countries, there is a negative relationship between unemployment and ecological transition, on the other hand there is a positive relationship between unemployment and ecological transition in upper middle-income countries. This ambiguity is because countries with low per capita income need to use large quantities of energy in order to access economic growth. Conversely, in countries with upper-middle income per capita, high unemployment can be induced by a financial crisis. Furthermore, in countries with high per capita income, the government has the opportunity to use public incentives to create new jobs in sectors of interest, as in the case of ecological transition. Countries that suffer for high levels of unemployment because of the manifestation of economic crisis can have greater probabilities to promote the ecological transition i.e. the government can invest in creating new green jobs of unemployed workers. For these motivations, there is a positive relationship between unemployment and green transition (Puttachai et al., 2022). Countries with greater unemployment also have more ESG greenwashing (Duygu & Cankaya, 2023).
Unemployment and ESG model
There is generally a negative relationship between unemployment and the application of ESG models. This negative relationship is because countries that have high unemployment are also less sensitive to the issues posed by ESG models. In fact, countries suffering from unemployment also tend to pollute more, have a critical social dimension with a large part of the population in conditions of poverty, and tend to have unsatisfactory public governance models. However, if unemployment is produced by a financial crisis affecting a country with a medium-high per capita income, then it is possible to detect a positive relationship between unemployment and the ESG model. In fact, in this case, economies have the opportunity to use their resources, both public and private, to invest in the creation of green jobs. There is a negative relationship between unemployment and ESG model in Romania (Nitescu & Cristea, 2020). Unemployment impedes the application of the ESG model in South Africa, especially in the reduction of the S component (Matemane et al., 2022). Unemployment negatively affects GDP growth in the context of the ESG model at world level (Leogrande & Costantiello, 2023). Unemployment is negatively associated to the value of political stability within the context of ESG model at world level (Costantiello & Leogrande, 2023). Unemployment Rate is positively associated to ESG disclosure practices at country level in a set of 14.174 firms in the period 2005-2012 (Baldini et al., 2018). Unemployment is positively associated to ESG disclosure in Central American countries (Buallay et al., 2022). There is a negative relationship between ESG and unemployment rates in a set of countries either developed either under-developed (Zhou et al., 2020). The increase of unemployment in USA during the Covid-19 pandemic has increased the attention on the social dimension of ESG models (Lepetit et al., 2021). ESG models can prevent unemployment improving the living conditions of workers (Lazareva et al., 2022). The fight against unemployment is one of the main determinants for the application of the ESG model in South Africa (Leogrande et al., 2023).
Unemployment, ESG and Entrepreneurs
Firms that apply ESG models are interested in avoid negative news i.e. unemployment risks (Newton et al., 2022). There is a negative relationship between unemployment and the ESG disclosure (Buallay et al., 2022).
Miscellaneous
There is a negative relationship between labour force participation rate and unemployment in a set of 193 countries in the period 2011-2021(Leogrande & Costantiello, 2023). The combination of ESG models in the banking sector and unemployment can promote the diffusion of financial crisis at national level (Lin & Jin, 2023). Unemployment is positively associated to the government expenditure on education at world level within the ESG framework (Leogrande et al., 2023).
The Econometric Model for the Estimation of the Value of Unemployment
Below we present a model for estimating unemployment in 193 countries for the period 2011-2021. We used the World Bank's Environmental, Social and Governance-ESG database. The data were analysed through the following econometric models: Panel Data with Fixed Effects, Panel Data with Random Effects, Pooled OLS, and Weighted Least Squares-WLS. The choice of the panel model is due to the structure of the dataset. The dataset is composed of longitudinal data in the form N x T where N=193 and T = 10. We have estimated the following formula:
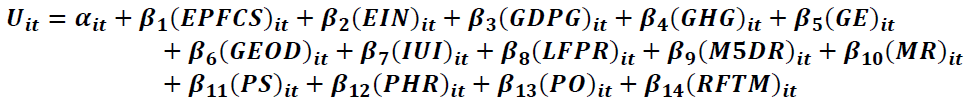
Where i = 193 and t = [2011;2021]
Specifically we found that U is positively associated to:
GHG: Net GHG emissions/removals refer to changes in atmospheric levels of all greenhouse gases attributable to forestry and land use change activities. There is a positive relationship between the growth of unemployment and the growth of GHG emissions. The countries that emit the most GHGs are also countries with high unemployment. Obviously, there are exceptions of countries that have both low unemployment and high GHG production. However generally the countries that pollute the most in the sense of GHG emissions, also tend to be the countries with a low per capita income and which tend to have a higher unemployment rate (Bank, 2023).
GE: Captures perceptions of the quality of public services, the quality of the civil service and the degree of its independence from political pressures, the quality of policy formulation and implementation, and the credibility of government commitment to such policies. The estimate gives the country's score on the aggregate indicator, in units of a standard normal distribution, ie ranging from approximately -2.5 to 2.5. There is a negative relationship between the value of GE and the value of U. Such a relationship may indeed appear counterfactual, as most countries that have a high level of GE also have a low value of U. However, one possible explanation for such a counterfactual relationship can be found in the growth rates of the value of GE in the period between 2013 and 2021. In fact it is possible to note that the low per capita income countries that generally have low levels of GE and high levels of U also have achieved GE's high growth rates in percentage terms. Specifically, Jordan between 2013 and 2021 developed a growth rate of the value of GE equal to 218,806.63%, Rwanda with a value of 1,520.84%, Saudi Arabia with 601.85%, Samoa with 569, 08%, Jamaica with 434.47%, India with 276.04%, Indonesia with 255.17%, Maldives with 227.06%, Vietnam with 208.74%, Tonga with 173.47%. It therefore follows that in a dynamic sense, the countries that have high unemployment are also the same countries that experienced significant growth in the value of GE between 2013 and 2021 (Bank, 2023).
RFTM: It is the percentage of the population aged 15 and over who are economically active: all people who provide work for the production of goods and services during a given period. The ratio of female to male labour force participation rates is calculated by dividing the female labour force participation rate by the male labour force participation rate and multiplying by 100. There is a positive relationship between the RFTM value and the U. The countries that have the highest level of RFTM are also the countries that have the highest U value. In fact, considering the top ten countries by RFTM value, we can note the presence of a group of countries that have a high level of unemployment such as, for example, Angola with 95.59, Moldova with 94.49, Azerbaijan with 91.58, Bhutan with 89.32, Uganda with 88.47. However, it should be noted that the value of RFTM tends to be high even in some countries with low unemployment, even if the prevailing orientation of the historical series is the positive relationship between RFTM and U (Bank, 2023).
EPFCS: Electricity sources refer to the inputs used to generate electricity. Coal is all coal and lignite, both primary fuels (including hard coal and lignite-lignite) and derived fuels (including proprietary fuels, coke oven coke, gas coke, coke oven gas and blast furnace gas). Peat is also included in this category. There is a positive relationship between the EPFCS value and the U value. In fact, countries that have high levels of EPFCS are also often countries that have high U levels. In the top ten countries for EPFCS, there are also countries that have a high level of U as Kosovo with 97.47, Botswana 96.36, Mongolia with 92.74, South Africa with 92.71, India with 75.31, Serbia with 72.34, Kazakhstan with 71.57, and China with 70.31. The positive relationship between EPFCS and U is because many poor countries produce energy through the exploitation of coal. This production is also due to the lack of a set of standards and legislative references oriented towards sustainability as happens, for example, in Europe and in the Anglo-Saxon world. Furthermore, in countries with a high U level, there is also a lack of political awareness to promote movements that are against the exploitation of coal for energy purposes. The paradox is that countries with high unemployment are also the most polluted due to the lack of adequate regulations and investments in clean energy (Bank, 2023).
PHR: is the percentage of the population living below the national poverty line(s). National estimates are based on population-weighted subgroup estimates from household surveys. There is a positive relationship between the PHR value and the U value. Countries that have high unemployment tend to have an increasing percentage of the population in poverty. In fact, the lack of work, the reduction of incomes, and the reduction of productivity are phenomena connected with the growth of poverty at the country level. The triggering of economic growth requires the development of human capital and the fight against poverty, i.e. results that can be obtained by reducing the U value. Specifically, the reduction of the U value requires the activation of a set of economic policies, centred on entrepreneurship, on the formation of human capital, and on the creation of new community relationships that can lead to a reduction in the value of PHR. Labour economic policies tend to have an impact both in terms of U reduction and PHR compression (Bank, 2023).
PO: It is the percentage of adults aged 18 years and older whose body mass index (BMI) is greater than 25 kg/m2. Body mass index (BMI) is a simple index of weight times height, i.e. weight in kilograms divided by height in meters squared. There is a positive relationship between the value of PO and the value of U. Countries with higher unemployment are countries with higher levels of overweight. The reason for the relationship between PO and U could be traced back to the fact that countries that have a high level of U also have low per capita incomes and the presence of large segments of the population in conditions of poverty. In fact, considering the top ten countries by U value, it is possible to note the following countries: Nauru with 88.5%, Palau with 85.1%, Marshall Islands with 83.5%, Tuvalu with 81.9%, Kiribati with 78.7%, Tonga with 78.5%, Samoa with 77.6%, Micronesia Fed. Sts. with 75.9%, Kuwait with 73.4%, Qatar with 71.7% (Bank, 2023).
EIN: They are estimated as energy consumption minus production, both measured in oil equivalents. A negative value indicates that the country is a net exporter. Energy consumption refers to the use of primary energy before transformation into other end-use fuels, equal to domestic production plus imports and inventory changes, minus exports and fuels supplied to ships and aircraft engaged in international shipping. There is a positive relationship between the value of EIN and the value of U in Figure 1. In the top ten countries that have a high level of EIN there are some that also have a medium-high level of U, namely: Morocco, Moldova and Belarus (Bank, 2023).

Figure 1 Average Value of Regressors to Estimate the Value of U
MR: is the probability per 1,000 that a new-born baby will die before reaching age five, if subject to age-specific mortality rates of the specified year. There is a positive relationship between the MR value and the U value. The growth of MR is positively connected with the growth of the U value. In countries that have very high U levels, per capita income also tends to be reduced. Low per capita incomes are associated with a structural worsening of the living conditions of the population which can also manifest itself with a reduced operational capacity of the health system and poor nutrition. Furthermore, the countries that have high unemployment, also having low per capita incomes have not yet had access to the demographic transition, i.e. the reduction in the birth rate associated with the growth in per capita income. High unemployment can reduce per capita incomes, lack of adequate health care, lack of adequate nutrition, increased infant mortality and failure to trigger the demographic transition (Bank, 2023).
We also found that the level of U is negatively associated to:
IUI: They are individuals who have used the Internet (from anywhere) in the last 3 months. The Internet can be used through a computer, mobile phone, personal digital assistant, gaming machine, digital TV, etc. There is a negative relationship between the value of the IUI and the value of U. This relationship allows us to verify, at a metric level, for a sample of 193 countries over a ten-year period, the positive role that the use of the internet has in the fight against unemployment. The use of the internet can be considered as a necessary tool to access digitisation. Digitization makes it possible to increase productivity and thus fight unemployment. It is important to note how much the use of the Internet is also necessary to promote new types of work that can be done remotely or through agile methods. In fact, the Internet has also allowed areas without infrastructure and services for industry and business to increase the supply and demand for work by creating new online jobs. In addition, the internet also makes it possible to overcome the problems of training and re-skilling of workers by offering the opportunity to acquire new skills to be used in the labour market to increase employability. Finally, the internet is also a tool to make job searches more efficient and therefore allow the unemployed to find a job (Bank, 2023).
GEOD: is expressed as a percentage of total government expenditure in all sectors (including health, education, social services, etc.). Includes expenditure financed by transfers from international sources to the government. General government usually refers to local, regional and central governments. There is a negative relationship between the GEOD value and the U value. The countries that invest more in education are also the countries that have a lower level of unemployment. This negative relationship can be understood considering that in the current economic scenario the value of knowledge is necessary to access the world of work. In fact, most of the GDP is produced by the service sector, in which a significant component is made up of the scientific-intellectual professions. It follows that the countries that invest more in the formation of human capital are also those that have the possibility of structurally reducing unemployment (Bank, 2023).
LFPR: is the percentage of the population aged 15-64 who are economically active: all people who provide work for the production of goods and services during a given period. There is a negative relationship between the LFPR value and the U value. The growth of people who are economically active in the labour market tends to have a positive effect in reducing unemployment. Obviously participation in the workforce also depends on a set of sociological-institutional factors, such as, for example, adequate training, the presence of investments in the industrial sector, the development of a certain know-how at the sector level which may workers the opportunity to profitably participate in the production activity in the various sectors of the economy. However, there may also be cultural and value factors that support a high level of LFPR. In fact, some peoples and some cultures seem to be more oriented towards the development of activism in the labour market while others are less active and less oriented towards productive commitment. However, there is no doubt that stimulating the growth of workers' participation in the labour market actively contributes to the fight against unemployment (Bank, 2023).
GDPG: is the annual percentage growth rate of GDP at market prices based on constant local currency. Aggregates are based on constant 2015 prices, expressed in US dollars. GDP is the sum of the gross value added of all resident producers in the economy plus any taxes on products and minus any subsidies not included in the value of products. It is calculated without making any deductions for depreciation of manufactured assets or depletion and degradation of natural resources. There is a negative relationship between the value of the GDPG and the value of the U. It follows that the countries that grow in terms of GDP also have the possibility of reducing unemployment. However, this relationship, which appears trivial, could be modified in the future due to the introduction of technologies that could reduce the employability of that part of the workforce, which also has a high per capita income rate. In fact, the applications of artificial intelligence, to robotics, to the service sector, to the manufacturing sector and to the primary sector, could lead to a simultaneous growth in GDP in the presence of a reduction in the value of unemployment. Therefore, the negative relationship between GDPG and U could become positive in the future due to unemployment induced by new information technologies applied to production systems (Bank, 2023).
M5DR: is the maximum amount of precipitation that can occur in a 5-day period. There is a negative relationship between the M5DR value and the U value. Countries where the M5DR value tends to be high are also countries where the U value tends to be low. However, this relationship could be subject to changes in the future due to climate change that could structurally change the distribution of adverse climatic events at a geographical level.
PS: measures perceptions of likelihood of political instability and/or politically motivated violence, including terrorism. The estimate gives the country's score on the aggregate indicator, in units of a standard normal distribution, i.e. ranging from approximately -2.5 to 2.5. There is a negative relationship between the PS value and the U value. Specifically, countries that have a high PS level tend to have a low U value: economic operators, investors, entrepreneurs need to invest verify the presence of conditions of legality. Legality considered as the absence of political violence and terrorism is an essential determinant in the strategic decision of an entrepreneur or a financier to invest within a certain country. The countries that offer greater political stability and which guarantee the absence of terrorism can obtain greater foreign investments and therefore can reduce unemployment. Conversely, countries that chronically suffer from widespread political violence and terrorism are excluded from investment and lose opportunities for economic growth due to lack of PS (Bank, 2023).
Below we consider the impact of U within the individual components of the ESG model. Specifically, we have grouped the results obtained considering belonging respectively to the E, to the S and to the G in the ESG framework. The formulas indicated below have been applied to calculate of the impact of U on individual components of the ESG model:
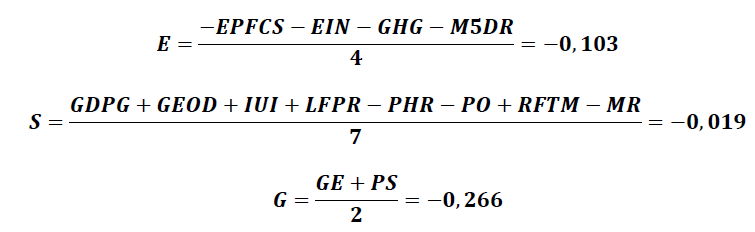
qIt appears that the impact of U is negative with respect to the three dimensions considered. Unemployment negatively affects the E-environment, the S-social dimension and the G-governance at the country level
The Impact of U on E
The negative relationship between unemployment and the environment can be understood considering that the countries that pollute more often are countries with high unemployment rates. Countries with high unemployment rates are also the countries that have a low per capita income value. These countries lack the adequate political culture to impose on their companies the use of production systems that are green-oriented. The negative relationship between U and E can be explained with the idea of the Environmental Kuznets Curve-EKC or with the idea that the transition to a green economy is possible only after having increased the value of per capita income. Conversely, where per capita income is low, the pollution associated with economic growth tends to be very high. Even if the EKC cannot be generalized and must be considered as an empirical law, it is still possible to consider it as a principle to apply in the context of international economic policies environmental issues. In this sense, sanctioning a country for not being sufficiently evolved in the sense of developing a green economy could condemn that same country to a condition of underdevelopment and structural unemployment. There is therefore a negative trade-off between low per capita income and green oriented development. Only rich economies can afford green conversion. For other low-income economies, growing economically means polluting, consuming greater quantities of energy. Sanctioning poor countries due to pollution could relegate the same countries to a green trap, in which, if we take technology as a constant, it is not possible to trigger economic growth due to the presence of restrictions on pollution in Figure 2.

Figure 2 Impact of U on ESG Components
The impact of U on S
However, the analysis shows the presence of a negative relationship between the value of U and the value of the S components within the ESG model. This negative relationship can be understood considering that unemployment prevents people from producing that per capita income which is necessary for both private welfare and the wealth of nations. In fact, in the presence of low per capita incomes, it will be very difficult for the citizens of a state to save money or invest in education, in some cases it could even be difficult to have a healthy and balanced diet. Indeed, the poor are often unemployed. Rising unemployment increases the number of poor people. Being poor also means having little access to health care, education, having fewer opportunities to develop a full life. Unemployment is certainly a determinant capable of destroying society and creates the conditions for poverty, indigence, lack of adequate health care. It follows that policies to combat unemployment can be considered as economic policies capable of acting on the wider social dimension, improving the conditions of the population also from the point of view of health, education and life expectancy.
The impact of U on G
Furthermore, there is also a negative relationship between U and the value of G. In fact, countries that have high unemployment also tend to have poor performance in terms of governance. Unemployment can have an impact in creating the conditions for political instability. In fact, the unemployed population could organize violent and even terrorist political movements to claim their right to work and remuneration. Furthermore, it must be considered that in general, states can finance themselves through the imposition of taxes on personal income. It follows that the growth in the number of working people also leads to an increase in the value of the state's tax revenues. In addition, a state that has higher tax revenues can also have more resources to better develop its governance and produce a more democratic system of laws.
Machine Learning and Predictions for the Estimation of the Future Value of U
A machine learning analysis for predicting the future value of U is presented below. Specifically, eight machine-learning algorithms are analysed based on their ability to maximize the R-squared and minimize statistical errors MAE-Mean Average Error, MSE-Mean Squared Error, RMSE-Root Mean Squared Error. 80% of the data was used for algorithm training while the remaining 20% has been applied for actual prediction. The construction of the ranking takes place by creating rankings for each indicator. The ranking of the algorithm within each ranking is added together. Thus, an overall ranking is obtained. The lower the ranking, the greater the ability of the algorithm to predict the future value of U. From the application of the proposed model, it is possible to identify the following ordering of the algorithms, namely:
1. Linear Regression with a payoff value of 5;
2. Polynomial Regression with a payoff value of 7;
3. ANN-Artificial Neural Network with a payoff value of 12;
4. Gradient Boosted Tree with a payoff value of 16;
5. Random Forest with a payoff value of 21;
6. Tree Ensemble with a payoff value of 25;
7. Simple Regression Tree and PNN-Probabilistic Neural Network with a payoff value of 29.
The algorithm that has the lower values is preferred to the algorithm that has the higher values.
The analysis conducted underlines that the best performing algorithm in predictive terms is Linear Regression in Figure 3. This indication therefore highlights the fact that the reference variable appears to be linear, i.e. there are no particular variations from one year to the next in the survey of the unemployment trend at country level. By applying the Linear Regression algorithm, it is therefore possible to predict the future trend of the value of U. It is possible to divide the countries into losing countries, i.e. countries for which an increase in the value of unemployment is expected, and winning countries, i.e. countries for which a reduction in the value of unemployment is expected (Figure 4).

Figure 3 Ranking of the Algorithms in Terms of Statistical Errors and R-Squared

Figure 4 Statistical Results of Machine Learning Algorithm Applied for the Prediction
Losing countries
Among the countries that are losers in terms of U, i.e. countries for which the value of U is predicted to grow, there are: Mali with a percentage change of U equal to 17.64%, Ecuador with 13.4%, Belarus with 10.9%, New Zealand with 9.69%, Tonga with 8.62%, Argentina with 6.89%, Thailand with 5.82%, Azerbaijan with 5.3%, Ethiopia with a value of 4.7 %, North Macedonia with 4.22%, Egypt with 3.46%, Cuba with 3.26%, Lebanon 3.13%, Portugal 2.92%, The Bahamas with 2.92%, Japan with 1.89% , Guinea with 1.8%, Australia with 1.33%, Congo Dem. Rep. with 1.08%, Lesotho with 1.06%, Guinea-Bissau with 0.56%, Burkina Faso with 0.23%, Rwanda with 0.02%. From a geographical point of view, we can see that the countries that will have a significant growth in unemployment are Belarus, Mali, Ecuador and New Zealand. However, there are also countries for which unemployment should grow more moderately, such as Australia, Japan and Argentina. However, the predictions for Australia and Japan are probably wrong. In fact, the Australian economy is very dynamic and tends to actually reduce unemployment, and Japan too has an orientation towards reducing unemployment and increasing productivity (Figure 5).

Figure 5 Countries for which the Best Algorithm in Terms of Prediction has Indicated an Increase in Terms of U
These countries are considered as losing countries, since their economic conditions are expected to be worsened by the predicted reduction of the value of U.
Winning Countries
Among the countries that are winners in terms of U, i.e. countries for which the value of U is predicted to decrease are the following countries, namely: Hungary with -0.13%, Yemen with -0.51%, Iran with - 0.62, Brunei Darussalam with -1.87%, Canada with -2.97%, Italy with -3.78%, Philippines with -4.12%, Ivory Coast with -4.29%, Guyana with -5.13%, Switzerland with -8.59%, United Kingdom with -12.25%, Ireland with -13.57%. From a geographical point of view, we can see that the countries that are predictively more likely to experience a reduction in unemployment are the UK and Ireland. However, the values for both the UK and Ireland are probably overly positive, as a reduction of -12.25% and -13.57% respectively is too much in a small period. On the other hand, the reduction of unemployment in Switzerland seems very likely thanks to the dynamism of the Swiss economy. The other predicted values for the other countries instead seem to be truer, as for example in the case of Italy, Canada, Hungary and the Philippines in Figure 6.

Figure 6 Losing Countries
They are those countries for which the algorithm predicts a reduction in the future value of unemployment. These countries are considered winners as the reduction of the unemployment rate could result in an overall improvement of their economic system.
The value of U is expected to grow by 1.51% on average for the analysed countries. If we look at the countries where the value of unemployment is very high worldwide, considering the data for 2021, we can see that these countries coincide with the countries of Southern Africa, the Horn of Africa, Algeria and Sudan. However, even within the African continent there are countries that has a low level of unemployment such as for example Niger and Chad. However, it must be considered that the fact that the unemployment rate is low does not automatically guarantee economic success. In fact, we can see that many African countries, China and many countries of Central-West Asia have quite low levels of unemployment without having significant advantages in terms of economic growth. This consideration is also very relevant for many European countries. Indeed, the mere reduction of unemployment is no longer a value in itself. The reduction in unemployment becomes a positive fact only if it is associated with productivity growth. In case of divergence between unemployment reduction and productivity growth then also the result in terms of GDP and economic growth could be missing at the country level. Furthermore, it must be considered that the change in production models, which increasingly envisage the massive use of artificial intelligence, could lead to economies characterized by a growing unemployment rate and growing productivity. The divergence between the unemployment rate trend and the productivity trend could be even more pronounced in the case of the application of artificial intelligence tools to the production of added value.
Conclusions
In this article we have analyzed the role of unemployment in the context of Environmental, Social and Governance-ESG models. We analyzed data from 193 countries over the period 2011 to 2021. The econometric results show that unemployment is negatively associated with each of the three components of the ESG model. Countries with higher unemployment tend to be countries with higher levels of pollution, worse social conditions, and low-level public governance. Furthermore, the predictive analysis shows that unemployment is expected to increase by an average of 1.51% for the analyzed countries. The analysis of the role of unemployment in the context of the ESG model highlights the criticality of the labor factor. Unemployment can prevent the application of ESG models. It is therefore necessary to intervene through economic policies aimed at fighting unemployment, supporting working poors, and introducing forms of re-skilling and reintegration into the labor market of unemployed.
Declarations
Data Availability Statement
The data presented in this study are available on request from the corresponding author.
Funding
The authors received no financial support for the research, authorship, and/or publication of this article.
Declaration of Competing Interest
The authors declare that there is no conflict of interests regarding the publication of this manuscript. In addition, the ethical issues, including plagiarism, informed consent, misconduct, data fabrication and/or falsification, double publication.
Software
The authors have used the following software: Gretl for the econometric models, Orange for clusterization and network analysis, and KNIME for machine learning and predictions. They are all free version without licenses.
Acknowledgements
We are grateful to the teaching staff of the LUM University “Giuseppe Degennaro” and to the management of the LUM Enterprise s.r.l. for the constant inspiration to continue our scientific research work undeterred.
References
Baldini, M., Maso, L. D., Liberatore, G., Mazzi, F., & Terzani, S. (2018). Role of country-and firm-level determinants in environmental, social, and governance disclosure. Journal of Business Ethics, 150, 79-98.
Indexed at, Google Scholar, Cross Ref
Bank, W. (2023). Political Stability and Absence of Violence/Terrorism: Estimate.
Bank, W. (2023). Electricity production from coal sources (% of total) .
Bank, W. (2023). Energy imports, net (% of energy use).
Bank, W. (2023). GDP growth (annual).
Indexed at, Google Scholar, Cross Ref
Bank, W. (2023). GHG net emissions/removals by LUCF (Mt of CO2 equivalent).
Bank, W. (2023). Government expenditure on education, total (% of government expenditure).
Bank, W. (2023). Individuals using the Internet (% of population).
Bank, W. (2023). Mortality rate, under-5 (per 1,000 live births).
Bank, W. (2023). Poverty headcount ratio at national poverty lines (% of population) .
Bank, W. (2023). Prevalence of overweight (% of adults).
Bank, W. (2023). Ratio of female to male labor force participation rate (%) (national estimate).
Bank, W. (2023). Worldwide governance indicators.
Indexed at, Google Scholar, Cross Ref
Buallay, A., Hamdan, R., Barone, E., & Hamdan, A. (2022). Increasing female participation on boards: Effects on sustainability reporting. International Journal of Finance & Economics, 27(1), 111-124.
Indexed at, Google Scholar, Cross Ref
Costantiello, A., & Leogrande, A. (2023). The Role of Political Stability in the Context of ESG Models at World Level. Available at SSRN 4406997.
Indexed at, Google Scholar, Cross Ref
Duygu, E. R. O. L., & Cankaya, S. (2023). The impacts of firm-level and country-level variables on Environmental, social and corporate governance greenwashing (Doctoral dissertation, Istanbul Ticaret University).
Indexed at, Google Scholar, Cross Ref
Lazareva, E. I., Gavrilova, Y. V., Gevorgyan, A. A., Boeva, K. Y., & Temirkanova, A. V. (2022). Human capital priority: ESG–oriented strategy for managing economy: 028. In Dela Press Conference Series: Economics, Business and Management (No. 003, pp. 6-6).
Indexed at, Google Scholar, Cross Ref
Leogrande, A., & Costantiello, A. (2023). The Labor Force Participation Rate in the Context of ESG Models at World Level. Available at SSRN 4466452.
Indexed at, Google Scholar, Cross Ref
Leogrande, A., & Costantiello, A. (2023). The Role of GDP Growth in the ESG Approach at World Level. Available at SSRN 4434206.
Indexed at, Google Scholar, Cross Ref
Leogrande, A., Leogrande, D., & Costantiello, A. (2023). The Role of Unemployment in the ESG Model at World Level. Available at SSRN 4502940.
Indexed at, Google Scholar, Cross Ref
Lepetit, F., Le Guenedal, T., Ben Slimane, M., Cherief, A., Mortier, V., Sekine, T., & Stagnol, L. (2021). The Recent Performance of ESG Investing, the Covid-19 Catalyst and the Biden Effect. Available at SSRN 3946483.
Indexed at, Google Scholar, Cross Ref
Lin, S. L., & Jin, X. (2023). Does ESG Predict Systemic Banking Crises? A Computational Economics Model of Early Warning Systems with Interpretable Multi-Variable LSTM based on Mixture Attention. Mathematics, 11(2), 410.
Indexed at, Google Scholar, Cross Ref
Matemane, R., Moloi, T., & Adelowotan, M. (2022). Appraising executive Compensation ESG-based indicators using analytical hierarchical process and delphi techniques. Journal of Risk and Financial Management, 15(10), 469.
Indexed at, Google Scholar, Cross Ref
Newton, D., Ongena, S., Xie, R., & Zhao, B. (2022). Banks vs. markets: Are banks more effective in facilitating sustainability?.
Indexed at, Google Scholar, Cross Ref
Nitescu, D. C., & Cristea, M. A. (2020). Environmental, Social and Governance Risks–New Challenges for the Banking Business Sustainability. Amfiteatru Economic, 22(55), 692-706.
Indexed at, Google Scholar, Cross Ref
Puttachai, W., Phadkantha, R., & Yamaka, W. (2022). The threshold effects of ESG performance on the energy transitions: A country-level data. Energy Reports, 8, 234-241.
Indexed at, Google Scholar, Cross Ref
Zhou, X., Caldecott, B., Harnett, E., & Schumacher, K. (2020). The effect of firm-level ESG practices on macroeconomic performance. Oxford Sustainable Finance Programme, Smith School of Enterprise and the Environment, University of Oxford. Working Paper, (20-03), 50.
Indexed at, Google Scholar, Cross Ref
Received: 04-Nov-2023 Manuscript No. AAFSJ-23-14153; Editor assigned: 06-Nov-2023, PreQC No. AAFSJ-23-14153(PQ); Reviewed: 16-Nov-2023, QC No. AAFSJ-23-14153; Revised: 20-Nov-2023, Manuscript No. AAFSJ-23-14153 (R); Published: 27-Nov-2023