Research Article: 2018 Vol: 22 Issue: 6
The Short-and-long Run Performance of Mergers and Acquisitions: Evidence From Tadawul
Nadisah Zakaria, Prince Sultan University
Kamilah Kamaludin, Prince Sultan University
Abstract
This study examines the short-and-long run share performance of acquirer companies listed on the Saudi Arabia Stock Exchange (Tadawul) from 1 January 2000 to 31 August 2017. Market-adjusted initial returns and buy-and-hold abnormal return methods are employed to measure the abnormal returns of acquirer companies over the short and long-run. The present study finds that: (1) investors could earn positive market adjusted abnormal returns during the few days surrounding the announcement date; (2) investors could earn positive and significant market-adjusted Buy and Hold Abnormal Return (BHAR) for shares that are held up to 36 months following the completion months of M&A events. The presence of abnormal return opportunities that may be exploited by investors during the period following the M&A announcement date and in the three-year holding period following the completion of M&A events might provide valuable insight to individual and institutional investors.
Keywords
Mergers, Acquisitions, Short-and-Long Run Performance, Saudi Arabia, Buy-and- Hold Abnormal return, Market Adjusted Return.
Introduction
It has been widely claimed that Merger and Acquisitions (M&A) activities enhance shareholders’ wealth of the acquiring companies. The superior performance could be established through multiple synergies derived from organisational efficiency, economies of scale, as well as knowledge and technology sharing, to name a few. While this is highly professed in the management literature, similar arguments have not been well supported in the finance literature. The existing evidence indicates that wealth creation following mergers and acquisition, if any, is only temporary. Abnormal share performance following an M&A announcement reverses almost instantaneously shortly after. Over a longer period, finance researchers found that M&A activities destroy shareholders’ wealth as the event creates negative abnormal performance to the acquirer firms (Yaghoubi et al., 2016a). However, in the nineties, evidence showed that longterm post-acquisition performance yielded results that were not statistically different from zero (Mager and Meyer-Fackler, 2017; Zaremba and Plotnicki, 2016; Mitchell and Stafford, 2000; Dutta and Jog, 2009). Nonetheless, the issues pertaining to the short-and-long term effects of M&A activities on share price performance has been regarded as one of many puzzles in corporate finance (Agrawal et al., 1992).
While the studies on short- and long-term share price performance of M&A activities have been extensive in developed (US, UK and Canada) and developing countries (Greece, Malaysia and Singapore), it is still an understudied area in emerging markets (Lebedev et al., 2015), notably the Middle Eastern countries like Saudi Arabia. Motivated to add evidence to the M&A literature for emerging markets like Saudi Arabia, the present study examines the shortand long-term share performance of 72 acquirer companies traded on the Saudi Stock Exchange (Tadawul) from January 1, 1998, to 31 August 2017. To date, no evidence pertaining to these issues has been investigated. The lack of attention given to the emerging markets like Saudi Arabia could be due to the following reasons:
1. The Saudi Arabia market is younger and less matured compared to advanced markets.
2. These countries have somewhat closed policies to foreign investment. Notably, Saudi Arabia’s Stock Exchange experienced a major change in recent years.
On 1 June 2015, the Capital Market Authority (CMA) allowed qualified foreign financial institutions to buy and sell shares in companies listed on Tadawul as an effort to extend its market participants (Zakaria and Hashim, 2017). Previously, international investors had limited access to Saudi Stock Exchange through instruments such as swaps and they only owned 7.74% of the Saudi Arabian share market’s value. As part of the country’s Transformation Plan 2030, the foreign institutional investors no longer have to meet the requirements set by the CMA; however, they must fulfil the percentage of foreign ownership in the shares market. This effort allows the government to establish Tadawul as one of the top ten leading financial markets globally. Hence, this study sought to fill this gap in the M&A literature.
The findings of the study:
1. Support the presence of significantly positive market-adjusted returns (CAARs) during the few days surrounding the announcement date.
2. Provide evidence that investors could earn positive and significant market-adjusted Buy-and-Hold Abnormal Returns (BHAR) for shares that are held up to 12, 18, 24, 30 and 36 months following the completion months of M&A events.
3. Despite the results of t-test demonstrating insignificant values for the periods of six-month through to the 66th-month after the completion of M&A events, investors could gain returns above the equal-weighted and value-weighted benchmarks.
The rest of the paper is organised as follows. Section 2 discusses the literature review, and Section 3 describes the data and methodology. Section 4 presents the results while Section 5 concludes the paper.
Literature Review
Short-Term Performance of the Acquiring Firms
While the literature almost unanimously suggests that M&A creates value for the target firms, mixed and inconclusive findings are reported about the performance of the acquiring firms following an M&A announcement. Evidence indicates that post-M&A announcements could generate either positive, negative or zero abnormal returns for the acquisition companies (Yaghoubi et al., 2016a). Positive returns are expected for the target firms as the acquirers offer premiums to induce target firms to sell their shares, which increase the market value of the target firms (Yaghoubi et al., 2016a, Lebedev et al., 2015). However, for acquirers, assuming that the market is semi-strong efficient, acquisitions, on average, reflect a zero net present value projects for acquirers. Thus, acquirers’ average returns shall be indistinguishable from zero. Nevertheless, Yaghoubi et al. (2016a) argue that behaviouralists reject this notion as market reaction to postannouncement does not necessarily reflect the value of the acquisitions. As such, acquirers may still gain positive abnormal returns if markets are receptive of the recent mergers’ activities or if the overall stock market is doing well (Rosen, 2006).
Bradley (1980) and Bradley and Jarrell (1980) report positive and significant abnormal return of 4.36% post-announcement in their study of 166 M&As between the period of 1962 to 1977 in the United States (US) market. A similar observation is documented for the United Kingdom (UK) market by Franks and Harris (1989) in their study of 1693 firms for the period between 1955 and 1985. Franks and Harris (1989) also report a positive and significant abnormal return of 1.2%, 20 days following the M&A announcement. Other studies that report positive abnormal returns following an M&A announcement include Asquith et al. (1983), Fuller et al. (2002), Moeller et al. (2004), Draper and Paudyal (2006) and Ismail (2008).
By contrast, studies that document negative abnormal returns are also quite plentiful. Firth (1980) examining 434 M&A in the UK markets between 1969 to 1975 indicates significantly abnormal negative returns of 6.30%. Franks et al. (1991) also find significantly negative abnormal returns of 1.02% for the 399 M&As in the US market between 1975 to 1984. From their sample, 128 share-financed acquisitions have further negative abnormal returns of 3.15% as compared to the cash-financed acquisitions that yield positive abnormal returns of 0.83%. Franks et al. (1991) findings are consistent with the argument that the method of payment influences the short-term abnormal return following the announcement period. Other studies that report negative abnormal returns following an M&A announcement include Amihud et al. (1990), Healy et al. (1992), Moeller et al. (2004), Andrade et al. (2001), Walker (2000) and Jaffe et al. (2015).
Mixed findings (having neither positive nor negative significant abnormal returns) have also been documented in the developing markets. Koh and Lee (1998) and Cheung and Shum (1993) find that the post-announcement returns in Singapore and Hong Kong are not significant from zero. On the contrary, studies in Malaysia argue that post-announcement returns generate significantly positive abnormal returns as documented by Isa and Lim (1993), Mat-Nor (1993) and Isa (1994) and Isa and Lee (2011). In another context, Zaremba and Plotnicki (2016) who examined the post-announcement performance of the Central and Eastern Europe (CEE) markets find positive abnormal returns in both the target and acquiring firms. Their study is based on 109 deals in 2001 and 2014 in the CEE region. Zaremba and Plotnicki (2016) did not find long-run negative abnormal returns for the acquiring companies, concluding that the mergers and acquisitions do not destroy the value of the acquirers in the long-term contrary to the stylised fact in earlier M&A studies. However, in the context of the Chinese market, Song et al. (2008), despite finding a positive average abnormal return in one month following M&A activity, argue that firms suffer significant wealth loss in one to two years after acquisitions.
Long-Term Post-Acquisition Performance
The long -term performance of the acquiring firms has also been subject to intense debate by finance scholars for quite some time. A similar trend of mixed and inconclusive findings is documented in the extant studies. Prior to the 1990s, researchers are almost unanimous in suggesting that the long-term post-acquisition performance generates negative abnormal returns. These studies are conducted in developed countries like the US and UK (Langetieg, 1978; Asquith, 1983; Malatesta, 1983; Bradley and Jarrell, 1988; Frank and Harris, 1989).
Between the 1990s and 2000s, evidence has been mixed. During this period, multiple metrics and benchmarks are used to measure the performance of acquiring companies in the US and UK. Nevertheless, the weight of evidence still indicates long-term post-acquisition underperformance for the acquiring companies. For example, Frank et al. (1991) examine 399 M&As in the US market between 1975 to 1984 by employing the event time and calendar time methods. Their findings have been mixed. Their results indicate that the equal-weighted benchmark produces significant negative abnormal returns; however, the value-weighted benchmark generates significant positive abnormal returns. Agrawal et al. (1992) despite replicating similar method used by Frank et al. concluded different findings. Agrawal et al. (1992) enhance the sample size to incorporate 937 mergers and 227 tender offers that take place throughout 1955 to 1987 in the US market. Agrawal et al. measure abnormal returns by adjusting the company’s return to size and beta; and Return Across Time and Securities (RATS) methodology. They find a significant negative average abnormal return of around 10% after 5 years’ post-acquisition for both approaches. The study by Loughran and Vijh (1997) requires special mention here as they pioneered the Buy-and-Hold Abnormal Return (BHAR) method as a measure of long-term performance (Agrawal and Jaffe, 2000). Nonetheless, Loughran and Vijh (1997) also find significant post-acquisition abnormal negative returns that are consistent with earlier studies.
Loughran and Vijh’s (1997) study marks a new trend in studying share price performance. Academic researchers began experimenting with the Cumulative Abnormal Returns (CAR) and Buy-and-Hold Abnormal Returns (BHAR) methods as measures for longterm performance instead of the traditional metrics like Capital Asset Pricing Model (CAPM) and market model. Interestingly, the change of methodologies spurred a new trend in the results. The findings are slowly moving away from the negative long-term post-acquisition abnormal performance. Mitchell and Strafford (2000) examine 2767 acquisitions from 1961 to 1993 using three different performance measures.
1. The BHAR method which indicates a negative value-weighted and insignificant equal-weighted abnormal return.
2. The calendar time abnormal return method that indicates negative equal-weighted and insignificant valueweighted abnormal returns.
3. The calendar time portfolio regression method which indicates negative equal -weighted and insignificant value-weighted abnormal returns. After accounting for methodological differences and cross-sectional dependence, Mitchell and Strafford argue that no significant abnormal returns should be observed by using different methodologies.
Consistent with Mitchell and Strafford (2000), Dutta and Jog’s (2009) study on the postacquisition of 1300 firms in Canada between 1993 to 2002, also did not find support for significant negative abnormal performance. Dutta and Jog (2009) contradicted an earlier finding by Andre, Kooli and L’Her (2004) who conclude a significant negative post-acquisition performance for 267 firms in the Canadian market between 1980 and 2000. Dutta and Jog (2009) argue that the small sample size in Andre et al. (2004) study may have potentially caused the discrepancies. Mitchell and Strafford (2000) and Dutta and Jog (2009) further argue that their findings that lean towards an insignificant abnormal return of post-acquisition performance support the efficient market arguments.
The reviewed studies are clustered in the developed countries in the US, UK and Canada. Studies in other regions are still limited. Studies conducted for developing countries like Malaysia and Greece also found negative long-term post-acquisition performance. Lee and Isa (2012) observe an 8.66% negative abnormal return in year 2 and -15.13% in year 3 for the acquirers in the Malaysian market. This result is obtained using the CAR method. However, using the BHAR approach, Lee and Isa (2012) obtain significant negative performance only in year 3. Kyriazis (2010) also find negative abnormal performance post three years of acquisition in the Greek market. In a more expansive sample from 23 frontier countries, Zaremba et al. (2018) examine long-run returns for 800 M&A deals. Zaremba et al. (2018) argue that extant M&A studies are concentrated on the developed countries and ignore other market players. To fill this gap, their study examined 23 countries from South America, Asia, Africa and Eastern Europe that are classified as frontier markets by MSCI for the period between March 1997 to 2016. Interestingly, contrary to the findings of underperformance from the developed countries and other developing countries (for example, Malaysia and Greek), Zaremba et al. (2018) do not find supporting evidence indicating an abnormal underperformance of acquirers.
Similarly, Mager and Mayer-Fackler (2017) also do not find significant negative abnormal long-term performance in their studies of the German acquiring firms for M&A transactions that took place between 1981 and 2010. Mager and Mayer-Fackler (2017) divide their sample into three different stages reflecting the evolution of the M&A of German economies from an insider-controlled, bank-based system to a more capital market system. Mager and Mayer-Fackler (2017) did not find any significant negative abnormal BHAR for their full sample after adjusting for cross-correlation and skewness. However, in the early stages where M&A activities were scarce (1980-1990), Mager and Mayer-Fackler (2017) found positive abnormal long-term returns when comparing against the German industry peers. The literature has documented several reasons that might affect acquirers’ abnormal return including payment type, acquisition type, ownership structure, management characteristics, previous performance, firm size, industry type, prior acquisition experience, environmental waves (Lebedev et al., 2015; Yaghoubi et al., 2016b, Yaghoubi et al., 2014).
Data And Research Methodology
Sample Selection
The initial identities of 72 completed M&A events in the Kingdom of Saudi Arabia were obtained from the Bloomberg Professional Services (Bloomberg) as one of the primary and authoritative financial information providers. The final sample selection of acquirer companies satisfies the following criteria:
1. Acquirers’ country of origin is Saudi Arabia.
2. Listed on Tadawul.
3. Completed M&A.
4. Deals are mergers and acquisitions of majority interest only.
5. The exclusion of withdrawn or pending M&A.
6. The exclusion of companies from Financial Services and Real Estate Investment Trust (REIT) Fund sectors.
7. Companies with several M&A during the period are included.
8. The availability of monthly returns data on Bloomberg for up to three years following the listing date.
The number of acquirer companies included in the final sample varies in accordance with the type of analysis undertaken and the time windows under consideration. For example, this study:
a. Incorporates 43 acquirer companies in the final sample to investigate the short- and long-run share performance of acquirer companies.
b. Includes 27 acquirer companies in the final sample to examine the long-run share performance of cross-border M&A.
To analyse the one-to-three-years post-M&A performance, this research required 36 monthly returns data for the acquiring companies from January 2000 to December 2014; implying that the period used in the present study is from 2000 through to 2017.
The daily price data including dividends of acquirer companies (adjusted for changes in the share split, rights issues and share repurchases) were collected from Bloomberg. The daily returns of acquirer companies were then subtracted from the daily market returns to obtain the market-adjusted returns during the few days following the announcement of M&A events. Following Brown and Warner (1985), this study defines t=0 as the announcement date of M&A event, t=-20 days to t=+20 days as the event period.
The monthly closing prices of acquirer companies were gathered from Bloomberg to compute the 36-monthly buy-and-hold returns for the sample companies. The monthly buy-andhold returns for each acquirer company were then compared with the monthly buy-and-hold market returns to derive the market-adjusted abnormal returns following the completion month of the M&A event.
Ritter (1991) advocates that in minimising the problem related to measuring portfolios, benchmarking those portfolios is vital. Therefore, we apply two market indices: Equal-Weight Index (EWI) and Value-Weight Index (VWI). Both benchmarks include all companies on the Tadawul. The equal-weight index gives the same weight or importance to each share listed on the Tadawul. Using this approach, the smallest companies are also given equal weight to that of the largest companies.
On the other hand, the value-weight index refers to each share listed on the Tadawul that is weighted according to the total market value of their outstanding shares. In other words, the weights of individual shares are proportionate to their market capitalisation. According to Xiao and Arnold (2008), both EWI and VWI allow researchers to analyse the sensitivity of the results to the choice of the market. As at 31 August 2017, there are 187 companies listed on the Tadawul. To develop EWI and VWI indices, the share price data both daily and monthly for each company traded in the Saudi Arabia Stock Exchange (Tadawul) was collected from the Bloomberg database.
Methods
This study employs the standard event study methodology, namely the event time approach to evaluate the short-and-long run share performance of companies. The short-run performance returns are defined as the returns gained by investors during the period surrounding the announcement date of M&A events. The long-run post-performance returns are defined as the returns earned by investors if the shares are purchased at the closing market price on the completion month of M&A events and held for 36 months. In the present study, the announcement date is defined to be day 0, and the aftermarket period includes the subsequent 36 event months; for example, one month period following the completion months of M&A events. To perform the analysis, the study employs the STATA Module.
Short-Run Return: Market-Adjusted Return Model
Following Brown and Warner (1985), the study employs the market-adjusted return model by subtracting the daily returns of market indices from the daily returns of individual shares of the acquirer companies. The choice of market-adjusted return model with daily or monthly returns is appropriate as its methodology is found to be as powerful as the market-riskadjusted model (Brown and Warner, 1985; Dyckman et al., 1984; and Chandra et al., 1990).
Based on the market-adjusted return model, the performance of an individual share is adjusted to the performance of a market index. Therefore, the daily abnormal returns of any share j are given as the difference between actual daily return and the corresponding daily return on the market index during period t, and are computed as follows:
The abnormal return for each share j is observed for each day in the event period and averaged across N companies or shares using the following equation:
Where, AARt is the daily average abnormal return in event period t, and N denotes the number of shares in the sample. The condition measures the market-adjusted average abnormal returns earned by investors for each day in the event period across N sample shares following the announcement date.
Finally, the CAAR(t1 ,t2) is computed by summing the daily average abnormal returns, AARt over days from period t1 to period t2 as follows:
This measure the market-adjusted Cumulative Average Abnormal Returns earned by investors from period t1 to period t2, for instances from day -1 to day +1 following the announcement of M&A events.
The statistical significance of the Cumulative Average Abnormal Return CAAR(t1 ,t2) is calculated following Brown and Warner (1985) and the parametric Test-Statistics for the daily Cumulative Average Abnormal Return, (t1 ,t2 ) CAAR from period t1 to period t2 as follows:
Where, CAAR(t1 ,t2) is the daily Cumulative Average Abnormal Return from period t1 to period t2,( AARt) is the standard deviation of daily average abnormal return and T denotes the total number of days in event period t.
Long-Run Return: Buy-and-Hold Abnormal Returns
An extensive literature supports the use of the BHAR method as this approach addressed the effect of compounding more than does Cumulative Abnormal Return (CAR) (Ritter, 1991; Barber and Lyon, 1997). Fama (1998) affirmed that compounding short-term returns to obtain long-term BHAR better captures long-term investor experience. Notably, using solely the average abnormal returns used in the CAR approach does not precisely measure returns to investors over the long-run period. Further, the CAR method tends to misrepresent performance when returns are highly volatile (Gompers and Lerner, 2003). In modern event studies, the most comprehensive accepted methodology is the BHAR approach. This research adopts this method to evaluate the share return performance of acquirer companies over the long-run.
The three-year holding return period is evaluated by computing the compounded monthly buy-and-hold return for acquirer companies, for time t as follows:
Where, rjt is the actual monthly return on the share of j in event period of t. T is designated as the number of months in event period t. The condition measures the total return from a buy-and-hold strategy where a share is purchased at the closing market price and held until 6, 12, 18, 24, 30 and 36 months following the listing date for the full sample of acquirer companies.
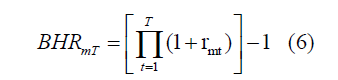
rmt is the corresponding monthly index level of SAS-EWI and SAS-VWI in event period t.
Note that SAS-EWI denotes the Saudi Arabia All-Shares Equal-Weight Index, and SAS-VWI represents the Saudi Arabia All-Shares Value-Weight Index. The market -adjusted buy-and-hold abnormal returns for each security or company in the sample in event period t are computed as:
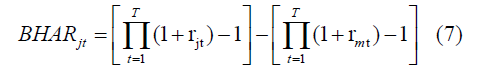
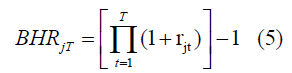
Where, BHARjt is the buy-and-hold abnormal return of security of j in event period of t. This allows us to measure the market-adjusted buy -and-hold abnormal returns earned by investors over the 6, 12, 18, 24, 30 and 36 months following the completion month of M&A events. The test statistic for the market-adjusted monthly buy-and-hold abnormal returns, BHARt1, t2 during the clustering period from t1 to period t2, is calculated as:
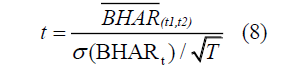
from period t1 to period t2; and  is the standard deviation of market-adjusted monthly buy-and-hold abnormal return in event period of t; and T is the total number of acquirer companies in the sample.
Results
This section discusses the findings from the data analysis. Figure 1, and Tables 1 and 2 present descriptive statistics of the M&A events that occurred in the Kingdom of Saudi Arabia from 1998-2017.
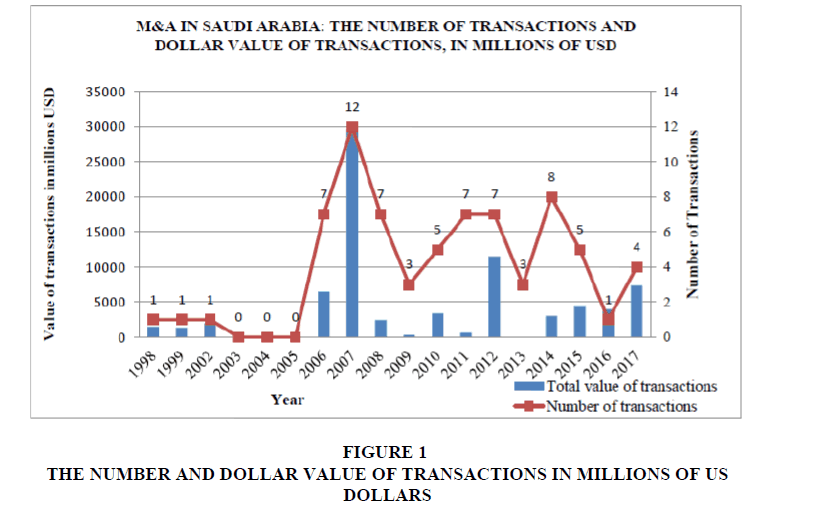
Figure 1: The Number And Dollar Value Of Transactions In Millions Of Us Dollars
Figure 1 plots the number of transactions and the dollar value of transactions in millions of US Dollars by year. The M&A events by Saudi Arabian listed companies began in the late 1990s. Out of 72 cases, 36.11% of the M&A announcements occurred between 2006-2008 in tandem with the development of the Saudi Arabia capital market. These events reached their peak in the year 2007, with twelve (12) completed transactions of M&A, but declined slightly after 2007 during the onset of the global financial crisis.
Table 1 reports the annual numbers, aggregate values and means values of completed M&A during the 1998-2017 period. Notably, our initial sample comprises 72 completed M&A with a market value of USD 78,264.80 million.
| Table 1 Descriptive Statistic For Acquirers Distributed By Year Consisting Of 72 Completed M&As In Saudi Arabia Between 1998-2017 |
|||
| Year | Number of Transaction | Total Value (million USD) | Average Value (million USD) |
| 1998 | 1 | 1,500.00 | 1,500.00 |
| 1999 | 1 | 1,349.00 | 1,349.00 |
| 2002 | 1 | 1,980.90 | 1,980.90 |
| 2003 | 0 | 0 | 0 |
| 2004 | 0 | 0 | 0 |
| Year | Number of Transaction | Total Value (million USD) | Average Value (million USD) |
| 2005 | 0 | 0 | 0 |
| 2006 | 7 | 6,486.46 | 926.64 |
| 2007 | 12 | 29,731.85 | 2,477.65 |
| 2008 | 7 | 2,460.09 | 351.44 |
| 2009 | 3 | 321.44 | 107.15 |
| 2010 | 5 | 3,408.56 | 681.71 |
| 2011 | 7 | 635.46 | 90.78 |
| 2012 | 7 | 11,546.66 | 1,649.52 |
| 2013 | 3 | 4.00 | 1.33 |
| 2014 | 8 | 3,036.79 | 379.59 |
| 2015 | 5 | 4,420.60 | 884.12 |
| 2016 | 1 | 4,000.00 | 4,000 |
| 2017 | 4 | 7,382.99 | 1,845.75 |
| Total | 72 | 78,264.80 | 18,225.58 |
Table 2 shows the top 10 transactions of completed M&A from 1998-2017. Notably, the highest value of transactions occurred in 2007 with the total amount of USD 11,600 million by Saudi Basic Industries Corporation (SABIC). To date, as at 31 August 2017, SABIC has the largest market capitalisation of Saudi Riyal 295,590,002,688.00 on the Tadawul. Out of top 10 transactions, 40% of the completed M&A is conducted by SABIC.
| Table 2 Descriptive Statistic For Acquirers Based On Top 10 Transactions |
||||
| Date announced |
Date completed | Acquirer Name | Target Name | Value of Trans (million USD) |
| 21-05-2007 | 31-08-2007 | Saudi Basic Industries | GE Plastic | 11,600.00 |
| 26-06-2007 | 26-06-2007 | Saudi Telecom | Axis Telekom Indonesia | 3,050.00 |
| 03-04-2002 | 30-06-2002 | Saudi Basic Industries | DSM Petrochemical Business | 1,980.90 |
| 27-06-2012 | 27-06-2012 | National Shipping | Fleets and Operations | 1,300.00 |
| 26-02-2007 | 15-05-2007 | National Industrialisation | Inorganic Chemicals Operations | 1,200.00 |
| 22-01-2017 | 16-08-2017 | Saudi Basic Industries | Saudi Petrochemical | 820.00 |
| 28-09-2006 | 29-12-2006 | Saudi Basic Industries | European Base Chemicals and Polymers Business | 810.00 |
| 19-11-2015 | 31-01-2016 | Saudi Telecom | Viva Kuwait Telecom | 507.38 |
| 19-09-2007 | 20-09-2007 | Etihad Etishalat | Bayanat Al-Oula for Network | 400.14 |
Source: Bloomberg, 2017.
Table 3 presents the results of market-adjusted Cumulative Average Abnormal Returns (CAARs) on Tadawul in several event windows from days -20 through to days +20. It can be seen that there is a potential leakage of information concerning M&A in the Saudi Arabia capital market. Evidence indicates that investors earned significant positive abnormal returns during the few days prior to the announcement date. The results show that the Cumulative Average Abnormal Returns (CAARs) for SAS-EWI benchmark are 1.5% (t=2.49, p<0.05), from day -3 through day +0. The highest market-adjusted CAARs was recorded at 7.97% (t=4.28, p<0.01) from day -1 through day 0; supporting the notion of potential leakage of news concerning M&A events in the market. It is worth noting that the majority of companies in the sample are government and family-owned businesses, which could explain the remarkable abnormal return from day -1 through day 0. Like other informational event announcements (example Initial Public Offering), the present study can plausibly argue that the government and family-owned acquirers initiate massive positive publicity about the decision to merge and/or acquire target companies in an attempt to safeguard their reputations to the existing and potential shareholders.
| Table 3 Share Returns Performance Of The Acquirer Companies Over A Short-Run Adjusted For Saudi Arabia All-Shares Equal-Weight Index (Sas-Ewi) And Saudi Arabia All-Shares Value-Weight Index (SAS-VWI) |
||||
| SAS-EWI | SAS-VWI | |||
| Interval day | CAARs (%) | T-Stat | CAARs (%) | T-Stat |
| -20 to +20 | 1.99 | 0.62 | -0.63 | -0.22 |
| -15 to +15 | -0.18 | -0.07 | 1.09 | 0.48 |
| -3 to +3 | 3.34 | 3.44a | 2.03 | 1.81 |
| -3 to 0 | 1.50 | 2.49b | 1.04 | 0.88 |
| -1 to 0 | 7.97 | 4.28a | -3.35 | -1.05 |
| -1 to +1 | 1.50 | 4.32a | -3.36 | -0.006 |
| 0 to +1 | 1.2 | 5.56a | 0.32 | 0.95 |
| 0 to +2 | 1.5 | 4.23a | 0.82 | 1.84 |
| 0 to +3 | 1.44 | 0.004 | 0.75 | 1.14 |
| 0 to +5 | 1.84 | 1.91c | 1.07 | 1.45 |
| 0 to +7 | 1.54 | 1.38 | 0.43 | 0.4 |
| 0 to +10 | 1.99 | 1.79c | 1.72 | 1.39 |
| 0 to +15 | 1.87 | 1.36 | 1.05 | 0.74 |
| 0 to +20 | 3.78 | 1.95c | 1.08 | 0.63 |
| +1 to +3 | 1.39 | 3.75a | 1.1 | 5.39a |
| +1 to +20 | 3.29 | 1.72c | 1.09 | 0.63 |
Note: The zero value denotes the announcement date of the mergers and acquisitions; a, b and c indicates statistical significance at the 1%, 5% and 10% levels respectively using a two-tailed test; Cumulative Average Abnormal Returns (CARs) are calculated against SAS-EWI, SAS-VWI with associated t-statistics during the period surrounding the announcement.
The presence of significantly positive market-adjusted (CAARs) during the few days following the announcement date is of interest indicating that the market anticipates the announcement of M&A events as positive news. The results show that the market-adjusted (CAARs) are +1.20% (t=5.56, p<0.01) from day 0 through day +1, 1.5% (t=4.23, p<0.01), from day 0 through day +2, +1.84% (t=1.91, p<0.10) from day 0 through day +5, +1.99% (t=1.79, p<0.10) from day 0 through day +10. Notably, there is a significant jump in market-adjusted CAARs of +3.78% from day 0 through day +20, significant at the 10% level. The results also confirmed the presence of M&A effect during the few days surrounding the announcement date. The market-adjusted CAARs in the three-day event window (day -1 through day +1) and in fourday event window (day +1 through day +3) are reported at +1.50% (t=4.32, p<0.01) and +1.39% (t=3.75, p<0.01), respectively. The out-performance of acquirer companies persists in the twenty-one-event window (day +1 through day +20). The analysis shows that there is a jump in return, indicating post-announcement drift, even though the result is significant only at the 10% level. Evidence shows that acquirer companies produce a positive and significant marketadjusted CAAR of +3.29%.
In contrast to SAS-EWI, the market-adjusted CAARs posit insignificant results when the present study switched to SAS-VWI. This indicates the results are more pronounced when the cumulative mean abnormal returns are measured against the SAS-EWI benchmark relative to SAS-VWI benchmark. At this point, the short-run abnormal return reflects the expected synergy between the acquirer companies and target companies, consistent with the notion of value creation in the event of M&A.
At this point, our findings conform to the overreaction hypothesis, which has been empirically established explaining the developing market. Studies in the developing markets asserted the existence of significant short-run positive gains to the acquirers (Lee and Isa, 2012). Our findings sit alongside evidence put forth by Isa and Lim (1993), Isa (1994), Mat-Nor (1993) and Isa and Lee (2011) in the Malaysian market, and Koh and Lee (1998) in the Singapore market. Thus, the present study contributes to the evidence that the Saudi Arabia share market provides a pocket of inefficiency that can be exploited by investors over the short-run period.
Table 4 provides evidence that investors could earn positive and significant marketadjusted BHAR for shares that are held up to 12, 18, 24, 30 and 36 months following the completion months of M&A events. Using the SAS-EWI, the highest market-adjusted BHAR of+35.24% occurred in the 36-month period (t=2.45, p<0.05) while the lowest market-adjusted BHAR of +8.61% is recorded in the six-month period (t=2.88, p<0.01). The results revealed similar patterns when we switched to value-weighting index. The market-adjusted BHAR of +32.42% reached the peak in the 36-month period (t=2.38, p<0.05), while the market-adjusted BHAR of 6.00% dived to the bottom in the six-month period (t=2.19, p<0.05). Our analysis shows that the longer the investors hold the portfolios, the higher the abnormal return that they could earn from investing in the acquirer companies. Our findings are aligned with the theoretical understanding that M&A creates value to shareholders, particularly in an emerging market like Saudi Arabia even though the companies are younger and operating in a market that is rapidly developing and less mature. For that reason, this study can plausibly argue that the Saudi Arabia market is generally inefficient.
| Table 4 Average Market-Adjusted Buy-And-Hold Returns For Acquirer Companies Listed On The Tadawul Market Sas-Ewi Sas-Vwi Indices |
||||||||||||
| Months After the Completion of Mergers and Acquisitions | ||||||||||||
| Periods | 6 | 12 | 18 | 24 | 30 | 36 | 6 | 12 | 18 | 24 | 30 | 36 |
| BHARs (%) | 8.61 | 10.62 | 10.34 | 15.96 | 27.88 | 35.24 | 6.00 | 7.42 | 7.57 | 12.10 | 24.21 | 32.42 |
| T-Stat | 2.88a | 2.26b | 1.67 | 2.12b | 2.85a | 2.45b | 2.19b | 1.71c | 1.30 | 1.64 | 2.57b | 2.38b |
Note: Average market -adjusted buy-and-hold abnormal returns for shares within a portfolio are calculated for periods of 6, 12, 18, 24, 30 and 36 months following the completion months of mergers and acquisitions for companies listed on Saudi Arabia Stock Exchange (Tadawul) against the SAS-EWI and SAS-VWI benchmarks; SAS-EWI denotes the Saudi Arabia All-Shares-Equal-weight Index; SAS-VWI denotes the Saudi Arabia All-Shares Value-Weight Index; a, b and c indicate statistical significance at the 1%, 5% and 10% levels respectively using a two-tailed test.
Conclusions
The present study finds that the reasonably consistent delay in the positive reaction by investors of a few days after the M&A announcement, which may be exploitable, is contradictory to what we might expect under market efficiency. Our findings thus inform the real-world debate on corporate M&A with particular reference to short- and long-run market inefficiency. The reasonably consistent delay in the positive reactions by investors, however, is likely to persist in the long-run. Evidence of markets anticipating increased value for acquirer companies might not indicate short-run overreaction because in the long-run, over the subsequent 36 months, the acquirer companies’ shares continue to outperform the market benchmarks. As there is no national evidence on share performances of acquirer companies over the short- and long-run, the present findings add to a growing body of international evidence. The findings also constitute evidence that might provide valuable insight for practitioners, especially fund managers and other investors. There are abnormal return opportunities that could be exploited by investors in the three-year holding period following the completion of M&A events, hence producing evidence that the Saudi Arabia share market is inefficient. Fund managers can create equity-based mutual fund portfolios, while hedge fund managers can use this approach as one of their tools for risk management. This study is limited to Tadawul only; thus, it cannot be generalised to other share markets in the region. Future studies should analyse the short- and long-run performance of M&A companies across the GCC and MENA regions to further support our findings on the emerging markets.
References
- Agrawal, A., & Jaffe, J.F. (2000). The post-merger performance puzzle. In Advances in Mergers and Acquisitions, Emerald Group Publishing Limited.
- Agrawal, A., Jaffe, J.F., & Mandelker, G.N. (1992). The post-merger performance of acquiring firms: A re-examination of an anomaly. The Journal of Finance, 47(4), 1605-1621.
- Amihud, Y., Lev, B., & Travlos, N.G. (1990). Corporate control and the choice of investment financing: The case of corporate acquisitions. The Journal of Finance, 45(2), 603-616.
- Andrade, G., Mitchell, M., & Stafford, E. (2001). New evidence and perspectives on mergers. Journal of Economic Perspectives, 15(2), 103-120.
- Andre, P., Kooli, M., & L’Her, J.H. (2004). The long-run performance of mergers and acquisitions: Evidence from the Canadian stock market. Financial Management, 33(4), 27-43.
- Asquith, P., Bruner, M., & Mullins Jr., D. (1983). The gains to bidding firms from merger. Journal of Financial Economics, 11(1), 121-139.
- Asquith, P. (1983). Merger bids, uncertainty and stockholder returns. Journal of Financial Economics, 11(1-4), 51-83.
- Barber, B., & Lyon, J. (1997). Detecting long-run abnormal stock returns: The empirical power and specification of test statistics. Journal of Financial Economics, 43(3), 341-372.
- Bradley, M. (1980). Inter-firm tender offers and the market for corporate control. Journal of Business, 53(4), 345-376.
- Bradley, M., & Jarrell, G.A. (1980). The economic effects of federal and state regulations of cash tender offers. Journal of Law and Economics, 23(2), 371-407.
- Bradley, M., & Jarrell, G.A. (1988). Comment on are acquiring-firm shareholders better off after an acquisition? In J.C. Coffee, Jr., L. Lowenstein, and S. Rose-Ackerman (Eds.), Knights, raiders and targets: The impact of the hostile takeover. New York: Oxford University Press.
- Brown, S.J., & Warner, J.B. (1985). Using daily stock returns: The case of event studies. Journal of Financial Economics, 14(1), 3-31.
- Chandra, R., Moriarity, S., & Willinger, G. (1990). A re-examination of the power alternative return-generating models and the effect of accounting for cross-sectional dependencies in event studies. Journal of Accounting Research, 28(2), 398-408.
- Cheung, Y.L., & Shum, C.K. (1993). Corporate takeover and shareholders’ wealth in Hong Kong. British Accounting Review, 25(3), 213-226.
- Draper, P., & Paudyal, K. (2006). Acquisitions: Private versus public. European Financial Management, 12(1), 57-80.
- Dutta, S., & Jog, V. (2009). The long-term performance of acquiring firms: A re-examination of an anomaly. Journal of Banking and Finance, 33(8), 1400-1412.
- Dyckman, T., Philbrick, D., & Stephan, J. (1984). A comparison of event study methodologies using daily stock returns: A simulation approach. Journal of Accounting Research, 22, 1-33.
- Fama, E.F. (1998). Market efficiency, long term returns, and behavioural finance. Journal of Financial Economics, 49(3), 283-306.
- Firth, M. (1980). Takeovers, shareholder return and the theory of the firm. Quarterly Journal of Economics, 94(2), 234-260.
- Franks, J.R., & Harris, R.S. (1989). Shareholder wealth effects of corporate takeovers: The U.K. experience 1955-1985. Journal of Financial Economics, 23(2), 225-249.
- Franks, J., Harris, R., & Titman, S. (1991). The post-merger share-price performance of acquiring firms. Journal of Financial Economics, 29(1), 81-96.
- Fuller, K., Netter, J., & Stegemoller, M. (2002). What do returns to acquiring firms tell us? Evidence from firms that make many acquisitions. The Journal of Finance, 57(4), 1763-1793.
- Gompers, P., & Lerner, J. (2003). The really long-run performance of initial public offerings: The pre-nasdaq evidence. The Journal of Finance, 58(4), 1355-1392.
- Healy, P.M., Palepu, K.G., & Ruback, R.S. (1992). Does corporate performance improve after mergers? Journal of Financial Economics, 31(2), 135-175.
- Isa, M. (1994). The effect of acquisition announcement and method of payment on shareholder returns in the Malaysian stock market. Security Industry Review, 20(1), 20-31.
- Isa, M., & Lim, L.L. (1993). Share price behaviour around acquisition announcement in Malaysia. Capital Market Review, 1(1), 1-23.
- Isa, M., & Lee, S.P. (2011). Method of payment and target status: Announcement returns to acquiring firms in the malaysian market. International Journal of Economics and Finance, 3(3), 177-189.
- Ismail, A. (2008). Which acquirers gain more, single or multiple? Recent evidence from the USA market. Global Finance Journal, 19(1), 72-84.
- Jaffe, J., Jindra, J., Pedersen, D., & Voetmann, T. (2015). Returns to acquirers of public and subsidiary targets. Journal of Corporate Finance, 31(1), 246-270.
- Koh, F., & Lee, S.H. (1998). Risks and returns of acquiring and acquired firms in Singapore: An empirical analysis. Asia Pacific Journal of Management, 5(3), 157-183.
- Kyriazis, D. (2010). The long-term post acquisition performance of Greek acquiring firms. International Research Journal of Finance and Economics, 43(1), 69-79.
- Langetieg, T. (1978). An application of a three-factor performance index to measure stockholders gains from merger. Journal of Financial Economics, 6(4), 365-384.
- Lebedev, S., Peng, M.W., Xie, E., & Stevens, C.E. (2015). Mergers and acquisitions in and out of emerging economies. Journal of World Business, 50(4), 651-662.
- Lee S. P., & Isa, M. (2012). Long term share performance of Malaysian acquiring firms. Managerial Finance, 38 (10), 958-976.
- Loughran, T., & Vijh, A.M. (1997). Do long-term shareholders benefit from corporate acquisitions? The Journal of Finance, 52(5), 1765-90.
- Mager, F., & Meyer-Fackler, M. (2017). Mergers and acquisitions in Germany: 1981-2010. Global Finance Journal, 34, 32-42.
- Malatesta, P.H. (1983). The wealth effect of merger activity and the objective functions of merging firms. Journal of Financial Economics, 11(1-4), 155-181.
- Mat-Nor, F. (1993). Acquisition announcement and stock price behaviour: The Malaysian experience. Journal Pengurusan, 12(1), 85-109.
- Mitchell, M.L., & Stafford, E. (2000). Managerial decisions and long-term stock price performance. Journal of Business, 73(3), 287-329.
- Moeller, S.B., Schlingemann, F.P., & Stulz, R.M. (2004). Firm size and the gains from acquisitions. Journal of Financial Economics, 73(2), 201-228.
- Ritter, J.R. (1991). The long-run performance of initial public offerings. The Journal of Finance, 46(1), 3-28.
- Rosen, R.J. (2006). Merger momentum and investor sentiment: The stock market reaction to merger announcements.
- Journal of Business, 79(2), 987-1017.
- Song, X.L., Zhang, Q.S., Chu, Y.H., & Song, E.Z. (2008). Empirical study on the stock-for-stock M&A performance of Chinese listed companies. In Service Operations and Logistics, and Informatics, 2008. IEEE/SOLI 2008. IEEE International Conference.
- Walker, M.M. (2000). Corporate takeovers, strategic objectives, and acquiring-firm shareholder wealth. Financial Management, 29(1), 53.
- Yaghoubi, R., Locke, S., & Gibb, J. (2014). Acquisition returns: does industry matter? Studies in Economics and Finance, 31(3), 309-324.
- Yaghoubi, R., Yaghoubi, M. Locke, S., & Gibb, J. (2016a). Mergers and acquisitions: A review (Part 1). Studies in Economics and Finance, 33(1), 147-188.
- Yaghoubi, R., Yaghoubi, M. Locke, S., & Gibb, J. (2016b). Mergers and acquisitions: A review (Part 2). Studies in Economics and Finance, 33(1), 437-464.
- Zakaria, N., & Hashim, F. (2017). Emerging Markets: Evaluating Graham's stock selection criteria on portfolio return in Saudi Arabia Stock market. International Journal of Economics and Financial Issues, 7(2), 453-459.
- Zaremba, A., & P?otnicki, M. (2016). Mergers and acquisitions: Evidence on post-announcement performance from CEE stock markets. Journal of Business Economics and Management, 17(2), 251-266.
- Zaremba, A., Szyszka, A., Plotnicki, M., & Grobelny, P. (2018). Post-merger returns in frontier markets, or how we learned to stop worrying and love the acquirers. Journal of Business Economics and Management, 17(1), 96-109.