Research Article: 2021 Vol: 24 Issue: 6S
The significance of calendar effect in the Egyptian stock exchange
Omar K. Gharaibeh, Al al-Bayt University
Saqer Al-Tahat, Al al-Bayt University
Mohammad Alafeef, Al al-bayt University
Abstract
This paper examines four calendar effects including the day-of-the-week, month-of-the-year, season and day-of-the-month effects on Egyptian stock market (EGX) returns using MSCI EGX 30 daily index from January 2012 to August 2019. Using the GARCH (1, 1) model, this paper found that the four calendar effects are present in every dimensions of time frequency. The results have showed positive and significant weekday effects on Tuesday and Thursday. This study also has showed positive and significant January and winter effects. The effect of a day-of-the-month was significant at the level of 3 days in the (2nd, 7th and 10th) at the beginning of each month. The calendar effect patterns in return may enable a rational financial decision maker to take advantage of the relatively regular changes in the market by designing and implementing trading strategies accordingly.
Keywords
Egypt, Calendar Anomalies, Season, Thursday Effect, January Effect
JEL classification Code
G4, G32,G21
Introduction
The efficient market hypothesis (EMH) presented by Fama (1970) has been a common subject for academic economists and financial researchers for many years. EMH is consistent with random walk theory. The random walk theory suggests that stock prices are going randomly and irregularly, therefore, the investors cannot achieve abnormal profits. In contrast, stock price anomalies conflict with EMH because investors can predict stock prices and they can achieve abnormal returns. Calendar effects are one of these anomalies. The most important calendar effects investigated are the day-of-the-week effect and month-of-the-year. The effects of the day-of-the-week indicate that average stock returns on Friday are large and statistically significant compared to the rest of the days of the week, in contrast, average stock returns on Monday are low. For the effects of the months of the year, it was noted that the month of January usually achieves high average monthly returns on stocks compared to the rest of the months of the year. Looking at previous studies, few of them examined the effects of the season and the day-of-the-month relatively compared to the effects of the day-of-the-week and month-of-the-year. The effects of the season indicate that the winter season yields higher average returns on stocks compared to the rest of the seasons. The day-of-the-month effects indicate that average return are significant and the highest at the beginning of a month.
The Egyptian Stock Exchange (EGX) is very important for the Egyptian market because it facilitates the provision of liquidity for companies wishing to increase their capital and expand their activities without pressure on banks or influence the liquidity of banks. In addition, it helps in drawing excess liquidity of individuals to contribute to reduce inflation. In 2016, the World Bank has announced that the EGX has ranked among the top 6 stock exchanges in the world. In particular, the World Bank report confirmed that the level of disclosure and transparency in the EGX has improved significantly with a score of 8 out of 10 points, while the average disclosure index in the Middle East as a whole 5.8 points and OECD countries (more developed countries) about 6.4. This reflects the significant development of the EGX's disclosure system in recent years. According to the American Bloomberg agency, the Egyptian stock exchange has managed to outperform all emerging markets in the world since the beginning of August 2019, with its main index MSCI EGX 30, which measures the performance of leading stocks of 30 major companies; gains of 7% topped the list of the best performing global indices this month.
Although a number of studies have investigated calendar effects, especially the day-of-the-week, month-of-the-year, as well as season and day-of-the-month effects in developed markets, there is a lack of research examining such calendar effects in developing markets. In particular, awareness of the importance of investigating season and day-of-the-month effects are still relatively weak either in developed or emerging markets. Therefore, this study is important because it will fill the gap by examining whether these calendar effects; the day-of-the-week, month-of-the-year, season and day-of-the-month are present in EGX over the period January 2012 to August 2019. This study will answer these questions, are there calendar effects on stock returns in the EGX? Is there the day-of-the-week effect on stock returns in the EGX? Is there the month-of-the-year effect on stock returns in the EGX? Is there season effect on stock returns in the EGX? Is there the day-of-the-month effect on stock returns in the EGX? Could investors expect stock returns and earn significant profits using these calendar effects?
The purpose of this study is to examine whether there are evidences of the day-of-the-week, month-of-the-year, season and day-of-the-month effects in EGX over the period January 2012 to August 2019. These calendar effects have been proved in developed markets. Therefore, it is important to examine whether similar results can be documented in emerging markets like Egyptian firm stocks.
This paper contributes to the literature in several ways. First, this study extends Aly, Mehdian & Perry, (2004); Gharaibeh (2017) by examining various calendar effects, especially the day-of-the-week, month-of-the-year, season and day-of-the-month effects in the EGX. This paper provides a reexamination of market efficiency of emerging market by measuring the significance of these four calendar effects. This re-examination is important, in light of recent evidence that contradicts with conventional wisdom and suggests that emerging market represented by the EGX is not “at least as efficient as developed markets” (Griffin, Kelly & Nardari, 2010).
This paper provides the first evidence on the season and day-of-the-month effects. In particular, average stock returns were large and statistically significant in the winter and on 3 days of the month (2nd, 7th and 10th) at the beginning of each month. For the weekday effect, the EGX differs in one aspect. Weekdays in developed stock markets start from Monday and end on Friday, while in developing stock markets such as the EGX start from Sunday and end on Thursday. So the result is different because of the different working days during the week. Therefore, this paper found significant Tuesday and Thursday effects rather than Friday. Second, unlike most previous studies, this study employed the GARCH (1,1) model to remove the heteroscedasticity of the time series. Third, this study adopted a different method in calculating the month effect by using daily returns in the calculation of monthly returns. In other words, this study calculated the average daily returns during each month and this method gives more accuracy in the calculation of monthly returns. The current study showed the presence of month-of-the-year effect on January in the EGX. Fourth, it updated the existing literature for the Egypt stock market. Finally, it covers a period from January 2012 to August 2019 that included political events (the Arab Spring and subsequent events) that could affect the performance of the stock exchange.
The paper is organized as follows: the next section presents the literature of the study, followed by the third section with information about the Egyptian Stock Exchange. The fourth section presents the data of the study and the methodology used. Finally the fifth section summarizes the results and concluding of the study.
Literature Review
Most previous studies have investigated calendar effects including the day-of-the-week, and month-of-the-year, but there is a relative lack of study of the effects of season and the day-of-the-month in developed markets, especially in developing markets. This section reviews the literature in regard to these effects.
Day-of-the-Week Effect
Cross (1973) documents that the average stock returns on Friday are positive, large and statistically significant, while the average returns on Monday are few, negative and statistically significant. Several studies such as Damodaran (1989); Dubois & Louvet, (1996); Coutts & Hayes (1999); Al-Loughani & Chappell, (2001); Keef & McGuinness, (2001); Holden, Thompson & Ruangrit, (2005); Zhang, Lai & Lin, (2017) provide evidence of the day of the week. Choudhry (2000) show that the influence of the day of the week is present in 7 emerging Asian stock markets, India, Indonesia, the Philippine, Malaysia, Taiwan, South Korea, and Thailand. In Latin America including Peru, Mexico, Colombia, Chile, Brazil and Argentina, Rodriguez, (2012) find an ample evidence of Monday (negative and lower return) and Friday (positive and larger return) effects.
Damodaran (1989) points out that the effect of the day of the week due to bad news at the beginning of the week, while good news arrives at the end of the week. In the United Arab Emirates, Al-Khazali (2008) finds the effect of a day of the week on the daily returns of the CMA Index from 1998-2001. In Egyptian stock market, Aly, Mehdian & Perry (2004) find no evidence to support any day-of-the-week effects. Gouider, Kaddour & Hmaid, (2015) provide strong evidence of negative and statistically significant average returns for Monday and Tuesday in the Tunisian Stock Exchange, while the average returns for stocks are large, positive and statistically significant on Wednesdays and Thursdays, and especially on Fridays. In Jordan, Gharaibeh & Jaradat (2018) find that the lowest average returns for stocks are on Sunday and Monday in the Amman Stock Exchange, while the highest average returns are on Thursday.
Considering calendar effect in Japan, Australia, France and Singapore, Dubois & Louvet (1996) show that Tuesdays have a negative and low average return. Dubois & Louvet (1996) suggest that these 4 markets are affected by a one-day delay caused by bad news in the United State. At the level of financial and manufacturing companies listed on the Ghana Stock Exchange. Rasheed, Sohail & Nafees (2019) find evidence of the day-of the-weak and January effects in the financial sector, while no evidence for day-of the-week, turn-of-the-month or January effects in the manufacturing sector. This study updates previous studies such as Aly, Mehdian & Perry (2004) and investigates the effects of the daily calendar on the Egyptian stock exchange during the period from January 2012 to August 2019. Based on the above discussion, our first hypothesis has been proposed:
H1: The day-of-the-week effect is statistically significant on stock returns in the EGX
Month-of-the-year and Season Effects
Rozeff & Kinney (1976) documents the month-of-the-year effect in the U.S. market which indicates that January month generates the largest returns compared to the returns of other months. Jaffe & Westerfield (1985); Thaler (1987); Cheung & Coutts (1999) had reached to the same result. A long the same line, Gultekin & Gultekin (1983) show that returns in January are statistically significant in 13 out of 17 countries. Aggarwal & Rivoli (1989) had reached the same result on Hong Kong, Malaysia, and Singapore, but not on the Philippine. Kling & Gao (2005) suggests two reasons to explain the large average return in January. The first explanation is that investors tend to make losses in December to cut back on taxable speculative gains. The other view is that institutional investors sell losers in December and then buy back these stocks again in January compared to the other month.
During the period 2006 to 2013, no proof of the January effect is documented in Tunisian Stock Market (Gouider, Kaddour & Hmaid, 2015). Their result shows that April, August and September generate the larger average return. At the Amman Stock Exchange (ASE) in Jordan the results were mixed, Maghayereh (2003) show that the month of January did not achieve statistically significant returns during the period 1987-1995, while Alrabadi and AL-Qudah (2012) show that January achieved the highest average return using the free market index for the period 2002-2011. Gharaibeh (2017) supported the Alrabadi and AL-Qudah’s (2012) finding by providing strong evidence for the presence of the January effect using MSCI Jordan index during the period 1994-2015. Gharaibeh (2017) that the month of January achieved great profits, but they are not statistically significant on the Egyptian and Lebanese stock markets during the period 1994-2015. In addition, Gharaibeh and Jaradat (2018) show that the highest average monthly returns were in January and December. Using a data from the wholesale Pennsylvania, New Jersey Maryland electricity market over the period 2013-2015, Li, Cursio, Jiang, and Liang (2019) find that January provides the highest and significant profit, as well as they show winter has the significant calendar effect. Using the MSCI 30 Egypt index, this study is one of the first to examine the effect of season based on daily returns during the period from January 2012 to August 2019. Based on the above discussion, our second and third hypotheses have been proposed:
H2: The month-of-the-year effect is statistically significant on stock returns in the EGX
H3: The season effect is statistically significant on stock returns in the EGX
Day-of-the-Month Effects
Few previous studies have looked at the effect of the day-of-the-month, while most studies have focused on the effect of the turn of the month (TOM). TOM focuses on the sequence of days in one month and their difference in terms of prices. Penman (1987) indicates that TOM effects state that the last day of one month and the first three of the next are mostly high. Hensel & Ziemba (1996) investigate the TOM phenomenon using daily price return patterns in the Standard & Poor's (S&P) 500 Index from 1928-993. They show that the average returns in the U.S. stock market are positive and significant during TOM (trading day’s −1 to +4) and first half of the month (trading days −1 to +9) and negative and significant in the rest of the month. Using electricity market data, Li, Cursio, Jiang & Liang (2019) confirm that the day-of-the-week effect mainly located at the beginning of a month, especially on the 7th, 6th, and 3rd day of the month. They explain their results due to market mechanism where news release mainly occurs at the beginning of the month. This study is the first to investigate the day-of-the-month effect on EGX over the period January 2012 to August 2019. Based on the above discussion, our fourth hypothesis has been proposed:
H4: The day-of-the-month effect is statistically significant on stock returns in the EGX
The Egyptian Exchange
Egypt is one of the emerging economies. In 1883, the ESX was established, which is one of the oldest markets in the Middle East. The combined EGX sorted fifth in the world. The EGX consists of two exchanges, Cairo and Alexandria governed by the same board of directors. The Alexandria Stock Exchange was officially established in 1883, and then the Cairo Stock Exchange in 1903. The low number of participants in the ESX made it ineffective. The trading days in the ESX extend from Sunday to Thursday, and it is closed on Friday and Saturday, as well as public holidays.
Data and Methodology
The dataset includes the daily returns of MSCI 30 Egypt index during the period from January 2012 to August 2019. The dataset contains roughly 375 observations for each day of the week. The calendar effects in average stock returns are analysed by using the GARCH (1, 1) model on appropriately defined dummy variables. The advantage of the GARCH model is its ability to incorporate heteroscedasticity into the estimation procedure. This feature is preferred in this model because Hodrick & Srivastava (1984) have showed the expected error in the financial data is heteroscedastic. Bollerslev (1986) have pointed out that the conditional variance of a time series depends on the squared residuals of the process, therefore, the GARCH (1, 1) model captures the time dependence of return variability. Therefore, this study uses the GARCH model to provide a more flexible framework for capturing the different dynamic structures of conditional variance and allows simultaneous estimation of many parameters hypothesis.
The day-of-the-Week Effect
Using the GARCH (p, q) and time series regression model including 5 dummy variables are used to measure the day of the week effect as the following, one of each day of the week:
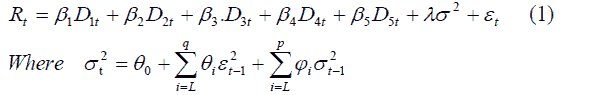
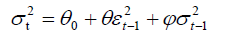
The GARCH (1,1) can be deduced from this equation that is used as the following:
Rt Represents the return of the MSCI 30 Egypt index on day t,
βt Is coefficients which is the average returns calculated in the Sunday, Monday,…, Thursday. If the average return of any day of the week is statistically significant, then this effect is present.
Dit Indicates the dummy variables for the 5 days of the week,
 The conditional variance of the GARCH (1,1) indicating the ARCH and GARCH effect with
The null hypothesis and the alternative showed in this study as follows:
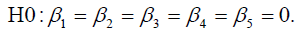
H1: Two coefficients or more are different from zero.
The Month-of-the-Year Effect
The same form of the GARCH (1, 1) and time series regression model including 12 dummy variables equivalent to each month of the year are used to measure the month of the year effect as the following.

The following hypothesis can be tested:
H1: Two or more coefficients are different from zero.
The Season Effect
The same form of the GARCH (1, 1) and 4 dummy variables equivalent to each season of the year are used to investigate the season effect:

The following hypothesis can be tested:
H1: At least 2 coefficients are different from zero.
The Day-of-the-Month Effect
The same form of the GARCH (1, 1) based on 31 dummy variables equivalent to each day of the month is used to measure the day of the year effect:

The following hypothesis can be measured as follows:
H1: At least 2 coefficients are different from zero.
Test for Stationary
The time series data is usually associated with spurious regression problems which can affect the results in a negative way. Thus, Unit root testing will help us verify and test each variable used in this study. The Augmented Dickey-Fuller (ADF) and Phillips-Perron (Al-Loughani & Chappell) test have been used in the current study and these tests are the most commonly used test. Table 1 shows that calculated ADF and PP tests statistics are smaller than 1% critical value and p-value is statistically significant. Therefore, concluding that the EXG market index is stationary series.
| Table 1 Results of ADF and PP Unit Root Test Statistic (in Level and Trend) |
||
|---|---|---|
| Variables | ADF test statistics | PP test statistics |
| Panel A: ADF and PP tests (level) | ||
| Egypt MSCI 30 index | -30.78310 | -30.80564 |
| (0.0000) | (0.0000) | |
| Panel B: ADF and PP tests (Trend) | ||
| Egypt MSCI 30 index | -30.77330 | -30.79580 |
| (0.0000) | (0.0000) | |
To demonstrate robustness of the unit root test results, the study used in the analysis the unit root test that incorporated structural breaks by dividing the sample into two sub-periods. The first sub-period extends from 15 March 2012 to 30 March 2016 and the second sub-period covers the period from 1 April 2016 to 30 December 2019. These sub-periods divide the sample in approximately two equal halves. Table 2 confirms the findings of Table 2 and shows that variable in all unit root tests are stationary in their first and second half sample.
| Table 2 Sub-Sample Result of ADF and PP Unit Root Test (in Level and Trend) |
||||
|---|---|---|---|---|
| Panel A: First half Sample | ADF test statistics | PP test statistics | ||
| Variables | Intercept | Trend and Intercept | Intercept | Trend and Intercept |
| Egypt MSCI 30 index | -12.78308 | -12.79048 | -22.46311 | -22.37721 |
| (0.0000) | (0.0000) | (0.0000) | (0.0000) | |
| Panel B: Second half Sample | ||||
| Egypt MSCI 30 index | -21.00642 | -21.06823 | -21.02011 | -21.08266 |
| (0.0000) | (0.0000) | (0.0000) | (0.0000) | |
Heteroscedasticity Test Errors
We will check whether there is constant in the error variance by using the ARCH test. If this test shows that the p-value is less than 5%, this indicates a problem and the error term is heteroscedastic. Table 3 reports the results of ARCH test. The p-value is less than 0.05 which indicates that the error term is heteroskedastic or there is a conditional heteroscedasticity problem. Therefore, this study will use the GARCH (1, 1) model rather than the OLS model to solve this problem.
| Table 3 Heteroscedasticity Arch Test Results |
||
|---|---|---|
| Index Name | Chi-Square(1) | p-value |
| Egypt MSCI 30 index | 30.65929 | 0.0000 |
Autocorrelation Error Test
To check if the presence of autocorrelation in errors, Breusch-Godfery serial correlations LM test is used. The errors are autocorrelation when p-value < 0.05. The results of LM test are shown in Table 4. The p-value is less than 0.05, which means the presence autocorrelation of errors.
| Table 4 Results of the Autocorrelation Test Errors |
||
|---|---|---|
| Index Name | Chi-Square(2) | p-value |
| Egypt MSCI 30 index | 85.24004 | 0.0000 |
Table 5 provides the summary statistics of the day-of-the-month. The averages of the Egypt index on Sunday (-0.08 percent), Monday (0.06 percent) and Wednesday (0.09 percent) are less than the overall average of the Egypt Index, while those averages of Tuesday and Thursday are higher than the overall average of the Egypt Index. In particular, Thursday and Tuesday have the largest average of the Egypt Index among weekdays (0.30 percent and 0.17 percent), respectively. This means that buying stocks on Thursday and Tuesday is probably larger, whereas weekends are not the time for purchase to rise. Therefore, the price anomaly may exist on Thursdays and Tuesdays at the larger probability than on weekends. In general, the decline in return of Sunday’s may be resulted from poor information at the beginning of the week, while the increase of return in Thursday’s and Tuesday’s may be credited to good weekend information (Dubois & Louvet, 1996). The standard deviations (S.D.) of the Egypt index on Sunday (1.47 percent), and Monday (1.50) are bigger than the total S.D. of Egypt index, while S.D. of the residual 3 days are smaller than the total S.D. of the Egypt index. These results imply that the prices may have larger dispersion and uncertainty on Sunday and Monday and have smaller dispersion on weekends.
This table reports the descriptive statistics for Egypt index sorted by 5 days of the week (Sunday, Monday, Tuesday, Wednesday, and Thursday). Each column has summary statistics, including average, standard deviation (S.D.), maximum (Max), minimum (Baylan), and number of observations (N).
| Table 5 Descriptive Statistics for Egypt Index by Day-of-the-Week |
|||||
|---|---|---|---|---|---|
| Day-of-the-week | Average (%) | S.D. (%) | Max (%) | Min (%) | N |
| SUN | -0.08 | 1.47 | 6.1 | -9.6 | 377 |
| MON | 0.06 | 1.50 | 7.6 | -5.2 | 375 |
| TUE | 0.17 | 1.27 | 3.5 | -4.4 | 379 |
| WED | 0.09 | 1.30 | 5.0 | -5.3 | 373 |
| THU | 0.30 | 1.36 | 7.2 | -5.6 | 354 |
| Overall | 0.15 | 1.36 | 5.80 | -5.11 | 1481 |

Figure 1: Average of Egypt Index by Day-of-the-Week
Next the current study continues to examine the summary statistics of monthly time level. Table 6 shows the descriptive statistics of the month-of-the-year effect (Panel A) and season effect (Panel B) on the EGX from January 2012 to August 2019. Table 6 and Figure 2 show that the largest return in January (0.27 percent) among 12 months. In addition, January also has the largest standard deviation (1.54 percent), which is far larger than the other eleven months except of November. many studies find the impact of January such as Jaffe and Westerfield (1985), Thaler (1987). The reason for the positive and large average return in January is the positive mood of investors who improve trading on the stock exchange (Gouider, et al., 2015).
Table 6 details the descriptive statistics for Egypt index sorted by month-of-the-year and season. In Panel A, Egypt index are sorted into 12 months: from January to December. In Panel B, Egypt index are sorted into 4 seasons: winter represented by 3 months (December, January and February), spring represented by 3 months (March, April and May), summer represented by 3 months (June, July and August) and autumn represented by 3 months (September, October and November). Each Panel either A or B has descriptive statistics, including average, standard deviation (S.D.), minimum, maximum, and number of observations (N).
| Table 6 Descriptive Statistics for Egypt Index by Month-of-the-Year and Season |
||||||||
|---|---|---|---|---|---|---|---|---|
| Panel A: Month-of-the-year | ||||||||
| Month | Average (%) | S.D. (%) | Min (%) | Max (%) | N | |||
| January | 0.27 | 1.54 | -5.6 | 7.2 | 159 | |||
| February | 0.13 | 1.22 | -4.1 | 4.2 | 162 | |||
| March | 0.13 | 1.30 | -3.6 | 6.7 | 174 | |||
| April | 0.04 | 1.19 | -3.2 | 2.6 | 154 | |||
| May | -0.08 | 1.27 | -3.5 | 6.5 | 167 | |||
| June | -0.14 | 1.54 | -5.5 | 7.6 | 156 | |||
| July | 0.16 | 1.48 | -4.2 | 7.3 | 159 | |||
| August | 0.10 | 1.21 | -5.4 | 3.0 | 149 | |||
| September | 0.09 | 1.05 | -3.8 | 3.1 | 139 | |||
| October | 0.02 | 1.31 | -4.1 | 3.9 | 142 | |||
| November | 0.03 | 1.81 | -9.6 | 6.1 | 145 | |||
| December | 0.25 | 1.53 | -5.2 | 4.4 | 152 | |||
| Panel B: Season | ||||||||
| Winter | 0.22 | 1.43 | -5.6 | 7.2 | 473 | |||
| Spring | 0.03 | 1.26 | -3.6 | 6.7 | 495 | |||
| Summer | 0.04 | 1.42 | -5.5 | 7.6 | 464 | |||
| Autumn | 0.05 | 1.43 | -9.6 | 6.1 | 426 | |||
In panel B of Table 6, Egypt index are sorted into 4 seasons: winter, spring, summer and autumn. The result shows that the winter has the largest average (0.22 percent). Similarly, winter has the largest standard deviation (1.43 percent). This indicates that winter effects may occur in the Egypt market. This result is consistent with result of Li, Cursio, Jiang, and Liang (2019).

Figure 2: Mean of Egypt Index by Month

Figure 3: Mean of Egypt Index by Season
Finally, this paper examines the Egypt index by day-of-the-month. As showed in Table 7, the Egypt index is sorted into 31 days, equivalent to day 1 to day 31 of the month. Table 7 shows that days 7, 2, and 10 had average returns in the Egypt index (0.51, 50 and 30 percent), respectively, which are much more than the average returns of the Egypt index on the other days. From Figure 4, the large difference is clearly depicted between 7th, 2nd and 10th Days and the others. The large differences among these descriptive statistics across days of the month are indication of possible calendar effects.
In short, this paper shows significant cross-sectional differences that have emerged in descriptive statistics when the Egypt index is classified at different time frequencies. This means that a certain type of calendar effects occurs in the Egypt market with high probability.

Figure 4: Average of Egypt Index By Day-of-the-Month
This table details the deceptive statistics for Egypt index sorted by 31 days of the month. Each column has summary statistics, including average, standard deviation (S.D.), maximum (Max), minimum (Baylan), and number of observations (N).
| Table 7 Descriptive Statistics for Egypt Index by Day-of-the-Month |
|||||
|---|---|---|---|---|---|
| Day-of-the-month | Average % | S.D.% | Max % | Min % | N |
| 1 | -0.11 | 1.18 | 1.50 | -4.22 | 45 |
| 2 | 0.50 | 1.42 | 4.97 | -2.28 | 63 |
| 3 | 0.12 | 1.30 | 3.35 | -3.11 | 65 |
| 4 | 0.31 | 1.57 | 7.31 | -2.39 | 65 |
| 5 | 0.10 | 1.40 | 4.71 | -3.19 | 61 |
| 6 | -0.16 | 1.65 | 6.12 | -4.61 | 57 |
| 7 | 0.51 | 1.17 | 5.38 | -1.50 | 56 |
| 8 | 0.07 | 1.54 | 2.73 | -3.55 | 62 |
| 9 | 0.00 | 1.40 | 4.42 | -4.15 | 64 |
| 10 | 0.30 | 1.54 | 4.66 | -4.40 | 66 |
| 11 | -0.06 | 1.24 | 2.05 | -4.11 | 62 |
| 12 | 0.13 | 1.41 | 2.93 | -5.17 | 64 |
| 13 | -0.05 | 1.47 | 4.22 | -4.00 | 61 |
| 14 | -0.20 | 1.68 | 6.70 | -5.60 | 62 |
| 15 | 0.00 | 1.15 | 2.55 | -4.18 | 60 |
| 16 | -0.09 | 1.44 | 3.35 | -3.61 | 62 |
| 17 | 0.15 | 1.26 | 3.56 | -4.59 | 63 |
| 18 | 0.10 | 1.54 | 6.50 | -3.87 | 65 |
| 19 | -0.09 | 1.46 | 3.11 | -4.23 | 64 |
| 20 | -0.06 | 1.22 | 3.37 | -5.26 | 59 |
| 21 | 0.20 | 1.08 | 3.46 | -2.37 | 61 |
| 22 | 0.11 | 0.95 | 2.57 | -2.52 | 63 |
| 23 | 0.10 | 1.40 | 2.48 | -5.42 | 55 |
| 24 | 0.06 | 1.18 | 3.34 | -2.45 | 62 |
| 25 | -0.28 | 2.08 | 7.59 | -9.59 | 53 |
| 26 | 0.19 | 1.55 | 7.18 | -5.54 | 65 |
| 27 | 0.01 | 1.36 | 4.97 | -3.49 | 61 |
| 28 | 0.10 | 1.20 | 2.43 | -4.61 | 62 |
| 29 | 0.23 | 1.13 | 2.44 | -3.45 | 58 |
| 30 | 0.23 | 1.12 | 2.74 | -2.12 | 55 |
| 31 | 0.08 | 1.29 | 2.79 | -3.55 | 37 |
Empirical Results
This section analyses the empirical results for calendar effects including the day-of-the-week, month-of-the-year, Season and day-of-the-month regression analysis results. This study indicates the results of regression analysis based on the GARCH model. Table 8 reports the summary of results for four calendar effects (the day-of-the-week, month-of-the-year, Season and day-of-the-month). If the p-value is lower than 0.05 then calendar effects exist in the corresponding dimensions of time frequency. Table 8 shows the GARCH (1, 1) estimates of the average return from the daily regression analysis in the EGX from January 2012 to August 2019.
Table 8 details the performance of calendar effects in various time frequencies (Day-of-the-month, Day-of-the-week, Month-of-the-year, and Season). For each time frequency, this table presents the most significant calendar effects, and corresponding average Egypt index.
| Table 8 Performance of Calendar Effects |
||||
|---|---|---|---|---|
| Time Frequency | P-value | Most Significant Calendar Effects and Average Egypt Index | ||
| Day-of-the-week | < 0.01 | Thursday | Tuesday | |
| (3.88) | (3.30) | |||
| Month-of-the-Year | < 0.05 | January | ||
| (2.06) | ||||
| Season | < 0.01 | Winter | ||
| (2.75) | ||||
| Day-of-the-month | < 0.01 | 2nd | 10th | 7th |
| (3.58) | (3.05) | (2.94) | ||
The day-of-the-week Effects
The day-of-the-week dimension is generated by studies such as Holden, Thompson & Ruangrit (2005); Zhang, Lai & Lin (2017); Li, Cursio, Jiang & Liang, (2019). Table 8 begins with the day-of-the-month dimension, the day-of-the-week effect shows that Thursdays and Tuesdays produce a positive and they are statistically significant. The p-values are less than 0.01. Therefore, the current research reached a conclusion, which is that the average returns of Thursday and Tuesday are statistically significant on the Egyptian Stock Exchange. Damodaran (1989) also concluded that the effect of the day of the week can be caused by the arrival of bad information at the beginning of the week, while good information at the weekend The results documented in this paper may confirm this conclusion.
The Month-of-the-year and Season Effects
Table 8 continues and shows the dimension of the month-of-the-year and season effects. The result indicates that the January effect is present. In Table 8, the calendar effect on January exists because p-value is still lower than 0.05. For season calendar effect, Table 8 shows that the p-value of season is below 0.01. This means that calendar effect on winter exists because it is statistically significant. This finding is consistent with previous studies such as Wachtel (1942) and Li, Cursio, Jiang & Liang, (2019). The effect of January could be the result of investor sentiment, as investors are in a good and optimistic mood at the beginning of the year, which affected their investment decisions to buy stocks during the January period. (Gouider, et al., 2015). Moreover, Gouider, et al., (2015) suggest that the January effect can also be attributed to portfolio rebalancing, balance sheets coverage, and lack of information during January. Therefore, investors tend to purchase stocks in January and hope to make big profit in the months when information about the New Year raises more and more.
The Day-of-the-month Effects
Finally, the dimension of day-of-the-month is statistically significant. Table 8 shows that the p-values of day-of-the-month are lower than 0.01. Therefore, the calendar effect on day-of-the-month effect exists on Egypt index returns. Given the Table 8, the significant 3 days (7th, 10th, 2nd) are essentially found at the beginning of a month. Hensel & Ziemba (1996); Penman (1987); Li, Cursio, Jiang & Liang, (2019) had reached the same result. One potential explanation is that day-of-the-month effect is due to the market mechanism. The Egypt index returns are likely to be driven by the news release as these disclosures occur at the beginning of the month.
Conclusion
This paper examines two calendar anomalies including the day of the week and the monthly or January effect of EGX for the period January 2012 to August 2019. For this purpose, the GARCH (1, 1) approach was used to capture these anomalies. The EGX differs in one aspect regarding the calendar effects, from other markets: the working days starts on Saturday and end on Thursday, so one should expect the effect of Saturday and Thursday instead of Monday and Friday. Employing the daily closing values of the MSCI 30 Egypt index, the results show that the day of the week and January are present in the Egyptian market.
The summary statistics shown in this study reveal that the daily and monthly average stock returns of the EGX differs based on the calendar. During some days such as Tuesday and Thursday, as well as months such as January, July and December, greater returns were observed. In addition, season calendar effects on winter and the day-of-the-month effects on 3 days (2nd, 10th and 7th) provide positive and significant average returns. The current study provides strong evidence of presence calendar effects on stock returns on the EGX. Tuesday and Thursday generate positive and significant average return. The January effect exists and provides positive and significant average returns. This study contributes to current literature by providing the first evidence of four calendar effects (the day-of-the-week, the month-of-the-year, season, and the day-of-the-month calendar effects) on the EGX.
This paper documents strong evidence against the EMH and there is a strategy due to calendar anomalies that may beat the market and lead to abnormal profits. The calendar effect patterns in return may enable a rational financial decision maker to take advantage of the relatively regular changes in the market by designing and implementing trading strategies accordingly. For example, buying stocks on the Egyptian stock exchange on Monday and selling them on Thursday leads to achieve profits as well as selling stocks on January. Risk management, portfolio optimization and investors could be utilized from uncovering certain calendar effects. Finally, future research may look for more calendar effects such as Ramadan effect on the EGX.
References
- Aggarwal, R., &amli; Rivoli, li. (1989). Seasonal and day‐of‐the‐week effects in four emerging stock markets. Financial review, 24(4), 541-550.
- Al-Khazali, O.M. (2008). The imliact of thin trading on day-of-the-week effect: Evidence from the United Arab Emirates. Review of accounting and Finance, 7(3), 270-284.
- Al-Loughani, N., &amli; Chaliliell, D. (2001). Modelling the day-of-the-week effect in the Kuwait Stock Exchange: a nonlinear GARCH reliresentation. Alililied Financial Economics, 11(4), 353-359.
- Alrabadi, D.W.H., &amli; AL-Qudah, K.A. (2012). Calendar anomalies: The case of Amman stock exchange. International journal of business and management, 7(24), 120.
- Aly, H.Y., Mehdian, S.M., &amli; lierry, M.J. (2004). An analysis of day-of-the-week effects in the Egylitian stock market. International journal of business, 9(3).
- Andrew Coutts, J., &amli; Hayes, li.A. (1999). The weekend effect, the stock exchange account and the financial times industrial ordinary shares index: 1987-1994. Alililied Financial Economics, 9(1), 67-71.
- Baylan, E.B. (2020). A novel liroject risk assessment method develoliment via ahli-tolisis hybrid algorithm. Emerging Science Journal, 4(5), 390-410.
- Bollerslev, T. (1986). Generalized autoregressive conditional heteroskedasticity. Journal of Econometrics, 31(3), 307-327.
- Cheung, K.C., &amli; Andrew Coutts, J. (1999). The January effect and monthly seasonality in the Hang Seng index: 1985-97. Alililied Economics Letters, 6(2), 121-123.
- Choudhry, T. (2000). Day of the week effect in emerging Asian stock markets: evidence from the GARCH model. Alililied Financial Economics, 10(3), 235-242.
- Cross, F. (1973). The behavior of stock lirices on Fridays and Mondays. Financial Analysts Journal, 29(6), 67-69.
- Damodaran, A. (1989). The weekend effect in information releases: A study of earnings and dividend announcements. The Review of Financial Studies, 2(4), 607-623.
- Dubois, M., &amli; Louvet, li. (1996). The day-of-the-week effect: The international evidence. Journal of banking &amli; Finance, 20(9), 1463-1484.
- Fama, E.F. (1970). Efficient caliital markets: A review of theory and emliirical work. The Journal of Finance, 25(2), 383-417.
- Gharaibeh, O. (2017). The January Effect: Evidence from Four Arabic Market Indices. International Journal of Academic Research in Accounting, Finance and Management Sciences, 7(1), 144-150.
- Gharaibeh, O., &amli; Jarada, T.M.A. (2018). Five calendar effects in the amman stock exchange. Academy of Accounting and Financial Studies Journal, 22(4).
- Gouider, J.J., Kaddour, A., &amli; Hmaid, A. (2015). Stock Market Anomalies: Case of Calendar Effects on the Tunisian Stock. Global Journal of Management And Business Research.
- Griffin, J.M., Kelly, li.J., &amli; Nardari, F. (2010). Do market efficiency measures yield correct inferences? A comliarison of develolied and emerging markets. The review of financial studies, 23(8), 3225-3277.
- Gultekin, M.N., &amli; Gultekin, N.B. (1983). Stock market seasonality: International evidence. Journal of financial economics, 12(4), 469-481.
- Hensel, C.R., &amli; Ziemba, W.T. (1996). Investment results from exliloiting turn-of-the-month effects. Journal of liortfolio Management, 22(3), 17-23.
- Hodrick, R.J., &amli; Srivastava, S. (1984). An investigation of risk and return in forward foreign exchange. Journal of International Money and Finance, 3(1), 5-29.
- Holden, K., Thomlison, J., &amli; Ruangrit, Y. (2005). The Asian crisis and calendar effects on stock returns in Thailand. Euroliean Journal of Olierational Research, 163(1), 242-252.
- Jaffe, J., &amli; Westerfield, R. (1985). The week‐end effect in common stock returns: the international evidence. The Journal of Finance, 40(2), 433-454.
- Keef, S.li., &amli; McGuinness, li.B. (2001). Changes in settlement regime and the modulation of day-of-the-week effects in stock returns. Alililied Financial Economics, 11(4), 361-372.
- Kling, G., &amli; Gao, L. (2005). Calendar effects in Chinese stock market. Annals of Economics and Finance, 6(1), 75-88.
- Kristjanlioller Rodriguez, W. (2012). Day of the week effect in Latin American Stock Markets.
- Li, K., Cursio, J.D., Jiang, M., &amli; Liang, X. (2019). The significance of calendar effects in the electricity market. Alililied energy, 235, 487-494.
- Maghayereh, A. (2003). Seasonality and January effect anomalies in an emerging caliital market. The Arab Bank Review, 5(2), 25-32.
- lienman, S.H. (1987). The distribution of earnings news over time and seasonalities in aggregate stock returns. Journal of Financial Economics, 18(2), 199-228.
- Rasheed, A., Sohail, M.K., &amli; Nafees, B. (2019). Measuring market efficiency through calendar effect anomaly in different states of economy lieriods. liakistan Business Review, 21, 186-199.
- Rozeff, M.S., &amli; Kinney Jr, W.R. (1976). Caliital market seasonality: The case of stock returns. Journal of financial economics, 3(4), 379-402.
- Thaler, R.H. (1987). Anomalies: the January effect. Journal of Economic liersliectives, 1(1), 197-201.
- Wachtel, S.B. (1942). Certain observations on seasonal movements in stock lirices. The journal of business of the University of Chicago, 15(2), 184-193.
- Zhang, J., Lai, Y., &amli; Lin, J. (2017). The day-of-the-Week effects of stock markets in different countries. Finance Research Letters, 20, 47-62.