Research Article: 2022 Vol: 26 Issue: 1
Value of Financial Flexibility and Investment Decisions of Non-Financial Firms in Pakistan
Zeeshan Ahmed, University of Lahore, Gujrat Campus, Pakistan
Mubashir Ali Khan, University of Lahore, Gujrat Campus, Pakistan
Qasim Saleem, GIFT University, Gujranwala, Pakistan
Saira Ihsan, University of Lahore, Gujrat Campus, Pakistan
Citation Information: Ahmed, Z., Khan, M.A., & Ihsan, S. (2022). Value of financial flexibility and investment decisions of nonfinancial firms in pakistan. Academy of Accounting and Financial Studies Journal, 26(1), 1-09.
Abstract
We probe the nexus between value of financial flexibility and investments of non-financial firms listed on Pakistan Stock Exchange over the period 2007-2019. For, this purpose, OLS and fixed effect models are applied to test the relationship while 2SLS and two step systems GMM utilizes for endogeneity concerns. The findings suggested value of financial flexibility based on cash holdings propensity increases the investments. However, market based measure of financial flexibility significantly decreases the level of investments. The results are conclusive across additional tests. It is helpful for finance mangers in the formulation of financial strategies in relation to the controlling and planning of financial decisions. The study attempts to contribute in prior literature by identifying the relationship of value of financial flexibility with investment decisions in a developing country like Pakistan.
Keywords
Value of Financial Flexibility, Fixed Capital Investment.
Introduction
In sophistocated global era fianancail flexiblity recevices a huge attention due to its greate imprtance in capital structure decision. In response to globalization, firms need to massive investment to overcome the global competition. Firms invest in modern technology to develop and promote products such investment may promote the efficiency of firms. In that situation, firms must be financially flexible to meet the funds requirement and capital expenditures (GOK, 2012). The financial flexibility is the capacity of institutions to take effective measures about unexpected changes in financial markets that affect the investment opportunities (Rahimi & Mosavi, 2016). Financial flexibility is the capacity of firms to deals with unexpected future events and helps the manager to make decisions about the future investment (Bouchani & Ghanbari, 2015). Firms with higher value of financial flexibility have lower dividend payout policy and prefer to repurchase the share in lieu of dividend and adopt the conservative dividend policy or cash holding (Rapp et al., 2014). Higher financial flexibility can decreases the cost of capital and increases the credit rating of firms as well as capital expenditure of firms. These firms holds high level of cash and have less chance of risk of refinancing (Chen et al., 2017). High value of financial flexibility can improve the efficiency and remove the problem of underinvestment and overinvestment. This may find a lot of changes among financial flexible and non- financial flexible firms (Agha & Faff, 2014). Chua, (2012) and Ferrando et al. (2014) explain that approximately 37% of firms can invest after acquiring financial flexibility. The style of investing strategies, the three most common style of investing strategies are value growth trading strategy, momentum trading strategy and accrual base trading strategy (Cao, 2011).
Financial flexibility is important consideration when making the investment in future by firms that leads towards growth opportunities. It describe the financial capacity of a firm to approach and revamp its financing at a low cost (Gamba & Triantis, 2008). In this way, financial flexibility embellish the value of firms through two strategies. First, financial flexibility can reduce underinvestment problems in case of compact approach to capital. Secondly, it can help to circumvent costs connected with financial distress. The financial flexibility of firms is affected by contacting problems and information asymmetric (Chua, 2012). Kalinin, (2012) describes the two main goals to establish the financial flexibility, first is to overcome any shortfall in earning and investments and second is enable the mobilization of financial resources of firms in case of positive and negative shocks in market. Financial flexible firms in prior financial crisis 1997 to 1998 relied on external borrowing rather than internal cash flows. However, Asian firms in financial crisis 2007 must rely on internal cash flows rather than external due to higher borrowing powers (Arslan-Ayaydin et al., 2014). The extreme financial crisis and negative shocks comes about the availability of external funds that badly hits the financial position of firm which are inflexible and firm are not able to adopt all the available opportunities which may helpful in valuing the growth for firms (Duchin et al., 2010). An effective investment in new technology can increase the productivity of firm that can leads toward competitiveness and growth in economy (Ahuja & Nabar, 2012).
This study examined the nexus between value of financial flexibility and investment decisions of firms in Pakistan. Pakistan is facing the instability problems in stock market, high interest rates, financing problems, rough investment climate and lower economic growth. Moreover, high cost of debt and investment opportunity are not available at good rate. A question arises about the firm’s financial flexibility under tough financing decisions is big obstacle in the way of investment. Many studies are conducted on financial flexibility and firm performance in Pakistan (Yasmin & Rashid, 2019) financial flexibility, financial distress and firm performance (Mahmood et al., 2018). They neglected the value of financial flexibility with investment in Pakistan. However, this study contributes on the effect of value of financial flexibility on investment of firms in Pakistan.
Literature Review
The interaction midway financial decision and investment is the main topic of research of Modigliani and Miller since 1958. The assumption of MM is not hold in reality because no one market is prefect while in imperfect market there is relationship between financial policies and investment decisions (Gdala, 2009). The financing policies of firms depend on degree of information provided to manger about the capital market. Financing is raised according to preferred hierarchy which suggests that investment from retained earnings is most preferred hierarchy (Myers & Majluf, 1984). Only those investment projects should be taken which increases the value of company. Q theory of investment predicts a strong relation between corporations’ market values and their investment rates (Andrei et al., 2019). The adverse selection issue in investment arises because of information asymmetric between investor and managers (Akerlof, 1970). Pervious literature shows that adverse selection is not harmful to elevate the capital investment (Masulis & Korwar, 1986). The second is moral hazard that arising between shareholders and mangers leads toward investment distortion (Jensen & Meckling, 1976).
Marchica & Mura, (2010) examine that financial flexibility could improve investment ability of UK listed companies. Financial flexibility is measured by free cash flows and investment ability measured by investment in fixed capital. The study concluded a significant positive relationship between financial flexibility and ability to invest. Some empirical studies shows that the financial flexibility affects the cash holding (Chen et al., 2011) capital structure (Byoun, 2011) and financial policies (Gamba & Triantis, 2008). Additionally, financial flexibility enhances the ability of firms to take the investment opportunity (Denis & Sibilkov, 2010).
Denis & McKeon, (2012) state that companies use flexibility to respond to positive shocks and adapt their investment policies accordingly. Chua, (2012) carried out study to investigate the effect of financial flexibility on investment ability of US companies. This study chose cash holding and debt capacity as indicators of financial flexibility. The results show that there is significant and positive relation between investment ability and debt capacity or cash holding. Jeremiah, (2015) carried out a study to analyze the relationship between financial flexibility and corporate investment. The study used three indicators of financial flexibility: cash holding, dividend decision and debt capacity. The study concluded that all the indicators of financial flexibility influence the level of corporate investment ability. Setianto & Kusumaputra, (2017) conducts study on the relationship between financial flexibility, investment activities and cash holdings. The result shows that financial flexibility enhances the investment ability of firms and also reduces the sensitivity to investment in cash flow. Financial flexible firms tend to hold the more cash as buffer to achieve the optimal financial flexibility.
Ghadiri, (2017) carried out a study on the relationship between financial flexibility and investment level in Tehran. The result shows a significant relationship between investment level and financial flexibility. Sang, (2018) investigate the relationship between value of financial flexibility (VOFF) and corporate investment ability. The study concluded that there is negative association between higher VOFF of investment level and lower flexible firms adopt the more conservative policies to reduce the credit risk. The results describes that financial flexibility has positive impact on investment and performance of firms which is statically significant.
Methodology
The study motives to find the relationship between value of financial flexibility and investment decisions of non-financial firms listed on Pakistan Stock Exchange. The quantitative research approach is used for empirical hypothesis testing. The target population was non-financial firms and data was collected from the financial statement of those firms. The sample was consisted upon 200 non-financial firms with time frame from 2007-2019. The financial is not the part of population because of capital reserve requirements required by the central bank. Moreover, ordinary least square (OLS) and fixed effect model are applied as regression tools. This shows that all the variables are exogenous in nature and to remove cross sectional heterogeneity we applied fixed effect technique.
Estimating Value of Financial Flexibility
Financial flexibility is not directly measured, it can be observed through alternatives, different measures available in literature about the level of financial flexibility (Sang, 2018). I would describe it through three generations. The first generation of measuring financial flexibility based on sensitivity measure, such as cash flow sensitivity (Almeida et al., 2004) and investment flow sensitivity (Fazzari et al., 1987). The second measure is based on KZ index (Kaplan & Zingales, 1997), SA index (Hadlock & Pierce, 2010) and WW index (Whited & Wu, 2006). This also includes the traditional strategies like cash holding, dividend policy and leverage policy. The third generation leads toward level of financial flexibility and value of financial flexibility. This study adopted the modified and newly develop measure value of financial flexibility.
To calculate the value of financial flexibility in two steps:
Step 1: Estimating the marginal value of cash holding.
This equation is used to access the market reaction regarding change in cash holding. Some prior studies like Faulkender & Wang, (2006), Rapp et al., (2014) and Sang, (2018) use return on twenty five Fama and French portfolio formed on book to market and size as a benchmark returns. By using this method each stock is grouped into one of twenty five based on book to market and size.
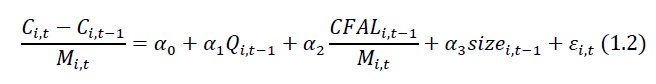
According to Almeida et al. (2004) suggest the equation (1.2) which represent the propensity of cash out flow. The expected and unexpected changes in cash are fitted with its residual in equation because the expected change is equal to zero and unexpected change is denoted by X. the unexpected change is the difference between cash reserve of year t and t-1 represented in financial statement.
Step 2: Compute the value of financial flexibility
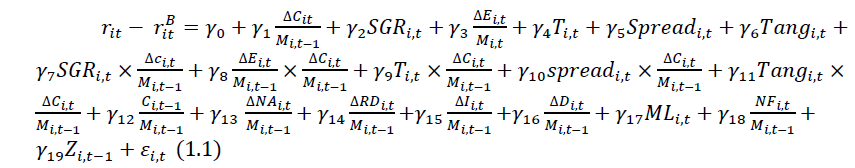
On the base of equation (1.1) the estimated regression coefficients and the interaction in change in cash calculate the value of financial flexibility by equation (1.3).

This is the market base measure of financial flexibility and forward looking in nature. It is the directly measure of value of financial flexibility rather than level of financial flexibility. More importantly, this equation is calculating the direct value of financial flexibility which is assigned by the shareholders for firm’s financial flexibility.
Econometric Model
Firm must invest in the projects having better net present value (Gomariz & ballwsta, 2014). The value of financial flexibility is a significant factor in the explanation of investment decisions of firms. The study develop the following econometric model in this regard.

Where Invit stand for fixed capital investment. It is measured as begin capital expenditure in noncurrent assets scaled to total assets (Jeremiah, 2015; Ameer, 2014, Chua, 2012). Firm size is measured as natural log of total assets (Bae et al., 2019; Jeremiah, 2015). Tangibility is calculated as the proportion of net value of plant and equipment and property divided by total assets (Sang, 2018). Sales growth rate is the growth options of firms (Ndubuisi et al., 2019). Debt maturity is termed as short term debt divided by lagged nominal total assets (Gomariz & Ballesta, 2014).
Results and Discussion
Descriptive Statistics
Descriptive statistic shows the distribution and identifies the outliers. It is also summarizes and presents data in such meaningful way that is easy to interpret and understand. Before statistics summary of all variables are calculated, variables are winsorized at 1% level both in tail distribution (Kale & Shahrur, 2007). The results related to descriptive statistic are reported in Table 1. Investment shows an average value of 0.5387 while it has standard deviation 0.1407. This shows that firms maintain 53.87% investment in fixed assets in relation to total assets. However, the average values of financial flexibility are 0.4334 and -0.0290 respectively.
| Table 1 Descriptive Statistics |
||||||||
|---|---|---|---|---|---|---|---|---|
| Variables | Obs. | Mean | Std. Dev | P25 | P50 | P75 | Skewness | Kurtosis |
| INVEST | 2,400 | 0.5387 | 0.1407 | 0.4403 | 0.5726 | 0.5890 | -0.3058 | 2.6515 |
| VOFF1 | 2,400 | 0.4334 | 0.1553 | 0.3306 | 0.4494 | 0.5374 | -0.2244 | 2.6284 |
| VOFF2 | 2,400 | -0.0290 | 0.0013 | -0.0296 | -0.0290 | -0.0281 | -0.3917 | 3.6336 |
| FS | 2,400 | 6.468 | 0.6985 | 5.9541 | 6.429 | 6.898 | 0.4573 | 3.0323 |
| TAN | 2,400 | 0.4162 | 0.1842 | 0.2737 | 0.4389 | 0.5724 | -0.3890 | 2.1499 |
| SGO | 2,400 | 0.1178 | 0.2264 | -0.0070 | 0.1166 | 0.2534 | -0.0161 | 3.2320 |
| SDM | 2,400 | 0.2569 | 0.1343 | 0.1502 | 0.2558 | 0.3644 | -0.0161 | 2.0116 |
Note: This table reports the descriptive statistics of the variables used in the model nonfinancial firms during 2006–2018. All the variables used in the model are winsorized at 1% level in both tails of the distribution before descriptive statistics are reported. Each column in the table reports observations, mean, standard deviation, 25th percentile, 50th percentile, 75th percentile, skewness and kurtosis. These values are reported about the variables fixed capital investment (INVEST), value of financial flexibility based on propensity of cash (VOFF1), value of financial flexibility based on market value (VOFF2), firm size, tangibility, short term debt maturity and sales growth option.
Correlation Matrix
Correlation matrix is used to test the multicollinearity among variables. Simply, the correlation analysis check the direction and strength of relationship among variables. The correlation results are shown in Table 2.The basic purpose of correlation analysis is explanatory variables which are partially correlated, therefore multicollinearity issue does not exist.
| Table 2 Correlation Analysis |
|||||||
|---|---|---|---|---|---|---|---|
| Variables | INVEST | VOFF1 | VOFF2 | FS | TAN | SGO | SDM |
| INVEST | 1.000 | ||||||
| VOFF1 | 0.229* | 1.000 | |||||
| VOFF2 | 0.033** | 0.032** | 1.000 | ||||
| FS | -0.090* | -0.101 | -0.124 | 1.000 | |||
| TAN | -0.007*** | 0.035** | 0.044** | 0.132 | 1.0000 | ||
| SGO | 0.013*** | 0.014*** | 0.001*** | -0.039** | -0.045** | 1.000 | |
| SDM | 0.026*** | 0.030 ** | -0.031** | 0.041** | 0.119 | -0.011*** | 1.000 |
Note: This table presents the correlation matrix among the variables. It shows the direction of relationships between variables. These values are reported about the variables fixed capital investment (INVEST, value of financial flexibility based on propensity of cash (VOFF1), value of financial flexibility based on market value (VOFF2), firm size, tangibility, short term debt maturity and sales growth option.
The Value of Financial Flexibility and Investment Decisions
This part of the study represent the results in connection to the relationship between value of financial flexibility and investment decisions of listed Pakistani firms. In this regard, the results are presented in Table 3. Two panels are built for the value of financial flexibility to clarify the difference between VOFF1 and VOFF2. Panel A shows the result of VOFF1 which is based on propensity of cash and panel B is based on market measure of VOFF2. It shows the results of OSL regression and fixed effect. The result in Panel A shows that value of financial flexibility based on propensity of cash is a significant factor that entail the firms to go for more investments. It corresponds to the situation towards better financial flexibility and cash holdings are the significant factor of investment decisions of firms. Firms owing the higher value of financial flexibility can better avail the investment opportunities. Financial flexibility enhances the investment ability of firms and also reduces the sensitivity to investment in cash flow (Setianto & Kusumaputra, 2017). Financial flexible firms tend to hold the more cash as buffer to achieve the optimal financial flexibility. Additionally, financial flexibility enhances the ability of firms to take the investment opportunity (Denis & Sibilkov, 2010). Ghadiri, (2017) study shows the positive association between investment and financial flexibility.
| Table 3 Estimation Results Between Value Of Financial Flexibility And Investment Decisions |
||||
|---|---|---|---|---|
| Fixed capital investment is dependent variable in all the columns | ||||
| Variables | OLS | Fixed Effect | ||
| Panel A | Panel B | Panel A | Panel B | |
| VOFF | 0.0679 *** (0.0125) | -0.0944* (0.1139) |
0.0301*** (0.0134 ) |
-0.1469*** (0.1185) |
| FS | -0.0010 (0.0032) |
-0.0147** (0.0075) |
0.0214*** (0.0868) |
0.0027 (0.0160) |
| TAN | -0.0255*** (0.0101) |
-0.00711 (0.0177) |
-0.0225* (0.0116) |
-0.0056 (0.0191) |
| SGO | -0.0082 (0.0074 ) |
-0.0180 (0.0122) |
-0.0107 (0.0076) |
-0.0298* (0.0126) |
| SDM | 0.0237* (0.0134) |
0.0406* (0.0231) |
0.0280* (0.0148) |
0.0439* (0.0245) |
| Time Dummy | Yes | Yes | Yes | Yes |
| R2 | 0.692 | 0.117 | 0.67 | 0.1100 |
| Obs | 2,000 | 2000 | 2000 | 2000 |
| No. of groups | 200 | 200 | 200 | 200 |
Contrary to this in Panel B, the market measure of value of financial flexibility notably decrease the investment decisions of firms. Sang, (2018) investigate the relationship between value of financial flexibility and corporate investment ability. The study concluded a negative association between value of financial flexibility and investments. Firms adopt the more conservative policies to reduce the credit risk and it all depends upon available investment opportunities (Cubbage, 2014). They issues equity when having financial surplus or pay downs the debt which in turn decreases the level of investment (Hess & Immenkotter, 2014).
Note: This table reported findings related to OSL & fixed effect dynamic panel model. Fixed capital investment is dependent variable measured by lagged total assets multiple by 100 and VOFF is independent variable panel A explains the results base on propensity of cash outflow and panel B explains results based on market base values measure. Tan is fixed assets over total assets, SGO is between sales growth rate, and SDM is short term debt divided by lagged nominal total assets. The sample includes 200 firms for period of 2007-2019. Statistical significance is at the 1%, 5% or 10% level as indicated by ***, **, or *, respectively and the associated t-statistics are presented in parentheses.
Additional Test: Endogeneity Concerns
The might be the potential endogeneity between the relationship of value of financial flexibility with investment decisions. To avoid the potential endogeneity, the study applied the two additional tests two stage least square (2SLS) and Generalized Method of Moments (GMM). The results these two additional tests are presented in Table 4. Here in this table, two measures of value of financial flexibility like financial flexibility in view of cash holdings and market measure of financial flexibility are used. Panel A represents the first value of financial flexibility while panel B represent the second measure of value of financial flexibility. Panel A shows that value of financial flexibility significantly increase the investment decisions. However, panel B shows that value of financial flexibility decrease the investment of firms. The results are robust and conclusive across these two additional measures.
| Table 4 Reverse Causality / Enodgeneity / Omitted Variable Bias / Simultaneity Bias |
||||||
|---|---|---|---|---|---|---|
| Fixed capital investment is dependent variable in all the columns | ||||||
| Variables | Panel A | Panel B | ||||
| 2SlS | GMM | 2SLS | GMM | |||
| 1st stage | 2nd stage | 1st stage | 2nd stage | |||
| Invest (t-1) | 0.7123*** | 0.4786** | ||||
| (0.2319) | (0.2361) | |||||
| VOFF | -0.874** (0.432) |
0.053*** (0.012) |
0.082*** (0.023) |
5.396*** (2.411) |
-0.108 (0.114) |
-0.611*** (0.097) |
| FS | -0.110*** (0.042) |
-0.026*** (0.004) |
-0.006 (0.009) |
-0.107*** (0.043) |
-0.018*** (0.008) |
0.009 (0.006) |
| TAN | -0.066 (0.159) |
-0.044*** (0.009) |
-0.017 (0.039) |
-0.085 (0.159) |
-0.006 (0.018) |
0.047 ** (0.017) |
| SGO | -2.386*** (0.127) |
-0.496*** (0.031) |
0.012 (0.030) |
-2.402*** (0.127) |
-0.018 (0.012) |
0.007 (0.015) |
| SDM | 0.298 (0.216) |
0.079*** (0.013) |
-0.071 (0.078) |
0.264 (0.216) |
0.043* (0.023) |
-0.114*** (0.028) |
| Time Dummy | Yes | Yes | Yes | Yes | Yes | Yes |
| AR (1) | 0.000 | 0.000 | ||||
| AR (2) | 0.182 | 0.440 | ||||
| Hansen Test | 0.291 | 0.537 | ||||
| Groups | 200 | 200 | 200 | 200 | 200 | 200 |
| Instruments | 55 | 133 | ||||
| R2 | 0.1391 | 0.7273 | 0.1398 | 0.1420 | ||
Note: This table reported the findings related to 2SLS and two step system GMM. Fixed capital investment is dependent variable measured by lagged total assets multiple by 100 and VOFF is independent variable. Panel A explains the results base on propensity of cash outflow and panel B explains results based on market base values measure. Tan is fixed assets over total assets, SGO is between sales growth rate and SDM is short term debt divided by lagged nominal total assets. The sample includes 200 firms for period of 2007-2019. Statistical significance is at the 1%, 5% or 10% level as indicated by ***, **, or *, respectively and the associated t-statistics are presented in parentheses. AR-1 indicates the existence the first order serial correlation null hypotheses of no first difference auto correlation among the error term is rejected. However AR-2 is showing insignificant i.e no second order serial correlation in regression level among error term. Hansen test shows the GMM correctly specified with no identification issues. The overall results AR-1 and AR-2 showed that generalized method of Movements correctly specified with no identification issues.
Conclusion
The study investigates the relationship between value of financial flexibility and investment decisions of firms in Pakistan. Two measures of value of financial flexibility like propensity of cash outflow and market based measures are used. The target population is the non-financial firms listed on Pakistan Stock Exchange over the period 2007-2019. Ordinary least square (OLS) and fixed effect model are applied to test the relationship while 2SLS and two step system GMM panel estimators are applied for endogeneity concerns. The study concluded that value of financial flexibility in respect of propensity of cash outflow increases the investment of firms. However, market based measure of value of financial flexibility decreases the level of investment. The results are conclusive across the additional tests like 2SLS and GMM. This study is helpful for stakeholders of corporate entities included creditors, mangers, shareholders and government. Furthermore, this study is helpful for finance mangers in the formulation of financial strategies in relation to the controlling and planning of financial decisions. For further research, it is better to add the efficiency of investment for higher or lower financial flexible firms.
References
Ahuja, M. A., & Nabar, M. M. (2012). Investment-led growth in China: Global spillovers. International Monetary Fund.
Andrei, D., Mann, W., & Moyen, N. (2019). Why did the q theory of investment start working? Journal of Financial Economics, 133(2), 251-272.
Byoun, S. (2011). Financial flexibility and capital structure decision. Available at SSRN 1108850.
CAO, Viet. (2011). Firms’ financial flexibility and the profitability of style investing (Doctoral dissertation, Durham University).
Chen, T., Harford, J., & Lin, C. (2017). Financial flexibility and corporate cash policy.
Cubbage, F., Mac Donagh, P., Balmelli, G., Olmos, V. M., Bussoni, A., Rubilar, R., & Carrero, O. (2014). Global timber investments and trends, 2005-2011. New Zealand Journal of Forestry Science, 44(1), 1-12.
Denis, D. J., & Sibilkov, V. (2010). Financial constraints, investment, and the value of cash holdings. The Review of Financial Studies, 23(1), 247-269.
Fazzari, S., Hubbard, R. G., & Petersen, B. C. (1987). Financing constraints and corporate investment (No. w2387). National Bureau of Economic Research.
Gdala, I. (2009). Financial flexibility and investment: Evidence from the Warsaw Stock Exchange.
Gomariz, M. F. C., & Ballesta, J. P. S. (2014). Financial reporting quality, debt maturity and investment efficiency. Journal of Banking & Finance, 40, 494-506.
Hess, D., & Immenkötter, P. (2014). How much is too much? Debt capacity and financial flexibility. Debt Capacity and Financial Flexibility.
Jeremiah, K. M. (2015). Financial Flexibility. Doctoral Dissertation, Kenyatta University.
Kalinin, A. V. (2012). Cash holdings of EU firms. Tilburg University.
Mahmood, Y., Rizwan, M. F., & Rashid, A. (2018). Exploring the relationship between financial distress, inancial flexibility, and firm performance: Empirical evidence from Pakistan Stock Exchange. NICE Research Journal, 1-16.
Myers, S. C., & Majluf, N. S. (1984). Corporate financing and investment decisions when firms have information that investors do not have (No. w1396). National Bureau of Economic Research.
Ndubuisi, K., Juliet, I., & Onyema, J. I. (2019). Effect of financial leverage on profit growth of quoted non-financial firms in Nigeria. J Fin Market, 3(1), 9-14.
Sang, L. Q. (2018). The value of financial flexibility, corporate investment policy and financial distress risk (Doctoral dissertation, University of Southampton).
Setianto, R. H., & Kusumaputra, A. (2017). Corporate financial flexibility, investment activities, and cash holding: Evidence from Indonesia. Indonesian Capital Market Review, 9(2).