Research Article: 2018 Vol: 22 Issue: 4
Value-At-Risk Models For KSA Insurance Markets: Conventional and Takaful
Habib Hasnaoui, Prince Sattam bin Abdulaziz University
Abstract
The purpose of this paper is to select the best VaR specification for the Insurance listed companies in an emerging economy, KSA. The author debated of the decoupling hypothesis of the Islamic insurance stocks (Takaful insurance companies) from the conventional insurance stocks (Mutual insurance companies). The author estimated the value at risk for the KSA insurance industry. The author also reconsidered the efficiency of a family of asymmetric ARCH models to assess the potential financial risk for daily stock returns. The researcher specifically accounted for the stylized facts of right-fat tails and skewed distribution of returns via the skewed Student distribution. The author also applied the Kupiec’s (1995) and Engle and Manganelli (2004) tests to check the performance of each model. The study found that the APARCH model with Skewed distribution records the best forecasting ability for both Takaful and Conventional insurance companies. The decoupling hypothesis of Takaful insurance companies from Mutual insurance companies has been rejected. The study provides some valuable insights on risk management for the Insurance industry in KSA. Policy makers have to take into consideration fat tails and asymmetric return distribution in assessing risk for both Takaful and Mutual insurance companies. The results have practical implications for the Insurance and Financial industry in KSA and in emerging stock markets.
Keywords
Risk Management, Value-at-Risk, Long Memory, APARCH Type-Models, Insurance industry.
JEL Classification
C53, G21, G28
Introduction
Due to the implementation of the Vision 2030 initiatives, a faster growth in the non-oil private sector is expected, which include promoting the role of the private sector in creating more jobs, increasing its contribution to GDP, supporting small and medium enterprises (SMEs). In authors view, the insurance industry can be a pillar in the fulfilment of this vision, since its contribution to the non-oil output is only 2.1% in 2016 compared to other sectors1. According to the Saudi Arabian Monetary Authority, the retention ratio of the Saudi insurance industry, which indicates the percentage of Gross Written Premium (GWP) retained by the insurance companies, reached 84%, in 2016. This indicates the low percentage of reinsurance contracts due to the tiny integration between the domestic and global insurance markets: The 2017 Financial Stability Report indicates that “most of the market risk is being assumed by the insurance companies”. Accordingly, since all insurance companies in KSA are publicly listed, they have to manage the market risk. This is in light with a number of financial crises such that the debt defaults of many Latin American countries in the early 1980s, the Asian in 1997-98, the 1998 Russian financial crisis and the latest subprime mortgage crisis in 2008 and 2009. Following these dramatic events in financial markets, Basle I, II and III agreements are the main references to regulate financial markets. The effective risk management in the particular KSA insurance industry is extremely crucial to quantify their risk levels.
Although its large criticism following the recent financial crisis, Rossignolo et al. (2012) and Degiannakis et al. (2013) show that VaR remains the most privileged measurement of risk. For emerging and frontier economies, McMillan and Speight (2007); Huang and Tseng (2009); Halbleib and Pohlmeier (2012); Allen et al. (2013); Hammoudeh et al. (2013) and others found that VaR models with heavy tail distributions provide the best performance in estimating risk. Hence, VaR computation has to account for the stylized facts of asymmetry and fait tails in stock market volatility. In the case of the GCC countries, this includes Maghyereh and Al-Zoubi (2006) and Aloui and Ben Hamida (2014).
Researcher’s interest in the insurance sector is due to two reasons. First, the insurance industry can increase the contribution of the non-oil GDP sector in accordance with the 2030 vision. Second, an attempt to offer a tool to manage risk for these companies. This is also in light of a recent literature on Islamic markets which debates the validity of the decoupling hypothesis of the Islamic financial products from the conventional assets. This hypothesis relies on the assumption that Islamic investments have their own characteristics and are different from the conventional ones, Masih et al. (2018). These characteristics are in terms of potential safety in times of financial crisis. While some studies support this hypothesis (Rizvi and Arshad, 2014; Kenourgios et al., 2016; Yilmaz et al., 2015), others are rejecting it (Hammoudeh et al., 2014; Ajmi et al., 2014; Naifar, 2016; Ben Nasr et al., 2016 ; Aloui et al., 2016; Shahzad et al., 2017).
Empirical Framework and Methodology
This paper examined the forecasting ability of four specifications belonging to the family of ARCH model in estimating VaR of insurance stocks in KSA. The study focused on the exante future distribution of the insurance industry in KSA. In order to examine the behaviour of VaR models to model the large negative returns for long trading positions. This research analysis doesn’t deal with short trading positions since it is forbidden in TADAWUL (Saudi Stock Exchange). For a portfolio of financial assets, VaR measures and quantifies the potential loss on with a given probability (99% or 95%) over a specific period. Alexander (2008) provides a deep explanation of Value-at-Risk.
The researchers’ computed daily stock returns 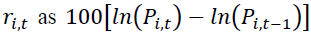 where pi,t is the price of stock i at day t. For the specification of VaR models, at first suppose that rt,,,i follow an AR (n) of the form
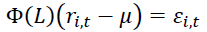 where φ(L) is an autoregressive lag polynomial of order n, since daily returns exhibit negative serial correlations. For the conditional variance specification, researchers considered three variants of the Ding et al. (1993) univariate Asymmetric Power ARCH (APARCH) model, namely APARCH with Normal distribution (APARCH-N), APARCH with Student distribution (APARCH-ST) and APARCH ith skewed Student distribution (APARCH-SKST). RiskMetrics (RM) specification was applied that relies on the Normal distribution. In line with Giot and Laurent (2003), McMillan and Speight (2007), McMillan and Kambouroudis (2009), Diamandis et al. (2011), Hasanov et al. (2018) and others, the in- sample performance of the four models were observed at 1% and 5% tails.
To this end, according to Kupiec (1995), examined the failure rate fi for the returns ri,t, ie the percentage of losses that exceeds the VaR estimate in a backtesting process.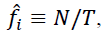 where T is the sample size and N is the number of violations. Then author observed if f is statistically equal to the VaR confidence level α. Under the null hypothesis,
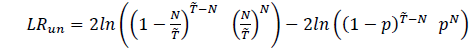
  the likelihood ratio test, also called the unconditional coverage test, has the following form:
 (1)
(1)
This test follows asymptotically a X2 (1) distribution.
According to Xekalaki and Degiannakis (2010); and Christoffersen (1998, 2012), the Kupiec (1995) test either overestimates or underestimates the percentage of violations. For this reason, the Dynamic Quantile test statistic (DQ) of Engle and Manganelli (2004) was applied that overcomes this limitation. In addition to examining if the rate of violations is equal to the specified level of VaR, it also tests the absence of serial correlation in these exceptions. The DQ test is based on the demeaned process of violations Hit. This sequence takes the following values:
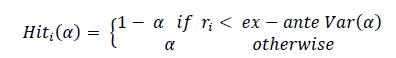 (2)
(2)
The conditional efficiency test of Engle and Manganelli (2004) checks the absence of correlation of Hit with its previous values and with the forecasted VaR and its past values. Specifically, they use the following regression model:
 (3)
(3)
And examined the hypothesis of joint nullity of all coefficients:
 (4)
(4)
If this hypothesis is verified, this corresponds to the conditional efficiency of the test.
Data
In 2017, the KSA insurance sector is comprised of 35 companies. All those companies are listed in the Saudi Stock Market and issue insurance policies in insurance activities including general insurance, vehicle insurance, health insurance and protection and savings insurance. Daily stock prices series from Data Stream was collected. The study excluded four companies with lack of data, a company that only operates in the reinsurance activity and a company that was suspended by SAMA. The final sample was comprised of 29 companies, 4 in the Takaful segment and the remainder 25 in the conventional insurance. The study was conducted on daily returns and used the data that extends from 2005 to the end of the first semester of 2017. The time-period covered any effects of the 2007-2009 subprime crises. In this study the estimation process based on the full sample.
Estimations and Results
Table 1 provides descriptive statistics for data. The common feature is that only 6 insurance companies (20.7%) are recording arithmetic positive returns, two of which are offering Islamic products. This was one of the reasons of restructuring the insurance industry by the SAMA authority. The estimated standard deviations show that the Takaful insurance companies are less risky than the conventional ones, which corresponds to the nature of Islamic products that prohibit risky activities. The author also notice that all the 29 stock returns series are skewed and leptokurtic. Research assumption is that the APARCH model will take into consideration these stylized facts.
| Table1 DESCRIPTIVE STATISTICS OF KSA INSURANCE LISTED COMPANIES |
||||||||
| 1st Observation | n | Mean | Std. Dev. | Skewness | Kurtosis | Jarque-Bera | P | |
| Takaful insurance companies | ||||||||
| Jazira Takaful | 19/07/2013 | 1030 | 0.092 | 2.91 | 0.21 | 6.81 | 630.90 | 0.000 |
| AlRajhi Takaful | 13/07/2009 | 2079 | 0.005 | 2.56 | -0.04 | 6.87 | 1300.41 | 0.000 |
| SABB Takaful | 18/06/2007 | 2619 | -0.004 | 3.42 | 0.00 | 5.53 | 699.22 | 0.000 |
| Solidarity | 08/06/2010 | 1843 | -0.030 | 2.75 | -0.26 | 6.89 | 1181.90 | 0.000 |
| Mutual insurance companies | ||||||||
| CHUBB | 29/07/2009 | 2067 | -0.026 | 2.98 | 0.04 | 6.17 | 864.64 | 0.000 |
| METLIFE AIG ANB | 11/03/2014 | 863 | -0.082 | 2.60 | -0.62 | 11.42 | 2602.26 | 0.000 |
| Al Alamiya | 08/12/2009 | 1973 | 0.010 | 3.23 | 0.01 | 5.68 | 589.27 | 0.000 |
| Sagr Insurance | 08/02/2008 | 2450 | -0.008 | 3.05 | -0.08 | 6.33 | 1134.74 | 0.000 |
| Al-Ahlia | 04/10/2007 | 2541 | -0.071 | 3.48 | 0.02 | 4.99 | 419.36 | 0.000 |
| Alinma Tokio M | 22/06/2012 | 1310 | -0.081 | 2.73 | 0.02 | 6.66 | 733.18 | 0.000 |
| Allianz SF | 23/07/2007 | 2594 | -0.021 | 3.50 | 0.00 | 5.20 | 522.05 | 0.000 |
| Amana Insurance | 11/06/2010 | 1840 | -0.040 | 3.85 | 0.06 | 5.07 | 328.98 | 0.000 |
| AICC | 04/02/2008 | 2454 | -0.074 | 3.14 | -0.01 | 5.67 | 728.60 | 0.000 |
| Arabian Shield | 26/06/2007 | 2613 | -0.011 | 3.21 | -0.13 | 5.73 | 818.51 | 0.000 |
| AXA Cooperative | 27/07/2009 | 2069 | 0.001 | 3.02 | 0.00 | 6.11 | 831.42 | 0.000 |
| Buruj | 15/02/2010 | 1924 | 0.014 | 3.25 | -0.05 | 6.11 | 773.91 | 0.000 |
| Gulf General | 08/02/2010 | 1929 | -0.030 | 3.01 | -0.08 | 6.30 | 878.00 | 0.000 |
| Gulf Union | 11/09/2007 | 2558 | -0.074 | 3.03 | -0.24 | 5.78 | 847.86 | 0.000 |
| Malath Insuranc | 07/05/2007 | 2649 | -0.060 | 3.16 | -0.22 | 6.07 | 1062.11 | 0.000 |
| SAICO | 03/09/2007 | 2564 | -0.043 | 3.34 | 0.02 | 5.19 | 513.42 | 0.000 |
| Salama | 18/06/2007 | 2619 | -0.029 | 3.38 | -0.11 | 5.11 | 492.40 | 0.000 |
| Saudi Rein | 22/05/2008 | 2376 | -0.048 | 2.37 | -0.20 | 8.12 | 2609.08 | 0.000 |
| Tawuniya | 03/10/2005 | 3064 | 0.023 | 2.68 | -0.17 | 7.55 | 2653.93 | 0.000 |
| MEDGULF | 08/05/2007 | 2648 | -0.013 | 2.99 | -0.22 | 6.33 | 1245.99 | 0.000 |
| Trade Union | 08/02/2008 | 2450 | -0.034 | 2.85 | -0.28 | 6.62 | 1372.16 | 0.000 |
| U C A | 19/06/2008 | 2356 | -0.006 | 2.89 | -0.09 | 6.46 | 1178.37 | 0.000 |
| WAFA Insurance | 23/08/2007 | 2571 | -0.068 | 3.86 | -0.04 | 4.37 | 201.53 | 0.000 |
| Walaa | 17/07/2007 | 2598 | -0.011 | 3.21 | -0.04 | 5.59 | 728.48 | 0.000 |
| Wataniya | 04/06/2010 | 1845 | 0.000 | 2.92 | 0.22 | 6.44 | 922.80 | 0.000 |
Note: The table provides the listed insurance companies in KSA, the starting date for each stock, descriptive statistics: number of observations n, arithmetic mean, standard deviation, skewness, kurtosis, Jarque-Bera normality test and the corresponding p-values. The last date for all stocks in the sample is 30/06/2017.
After computing the four competing VaR models, RM, APARCH-N, APARCH-ST and APARCH-SKST (The full results are available upon request), then moved to examine their performance. In order to perform a backtesting procedure researcher computed the one-dayahead VaR for the four models at the 1% and 5% significance levels. The calculation was based on the percentage of violations for the return series ri,t. For long positions, research analyze in the failure rate where stock returns are less than the one-day-ahead VaR.
Table 2 reports the p-values of the Kupiec (1995) unconditional test at the 1% and 5% significance levels. With  VaR models with Gaussian distribution: RM and APARCHN, generated biased estimates and had a poor performance in forecasting large negative returns. The APARCH-ST and APARCH-SKST provided better estimates but the APARCH-SKT had the best performance. In the less extreme case of
  the performance of the Normal VaR models has significantly improved. The RM specification recorded the best forecasting ability, with one exception for Tawuniya stock returns. The study observed that these conclusions are valid for both Takaful and Mutual insurance companies.
| Table 2 KUPIEC TEST RESULTS (IN-SAMPLE) FOR THE LONG TRADING POSITION |
||||||||
| α = 1% | α = 5% | |||||||
| RM | APARCH-N | APARCH-ST | APARCH-SKT | RM | APARCH-N | APARCH-ST | APARCH-SKT | |
| Takaful insurance companies | ||||||||
| Jazira Takaful | 0.00 | 0.05 | 0.40 | 0.40 | 0.53 | 0.72 | 0.29 | 0.24 |
| AlRajhi Takaful | 0.00 | 0.00 | 0.69 | 0.86 | 0.61 | 0.08 | 0.17 | 0.08 |
| SABB Takaful | 0.00 | 0.00 | 0.72 | 0.56 | 0.65 | 0.01 | 0.72 | 0.65 |
| Solidarity | 0.00 | 0.00 | 0.42 | 0.27 | 0.82 | 0.12 | 0.61 | 0.47 |
| Mutual insurance companies | ||||||||
| CHUBB | 0.00 | 0.00 | 0.28 | 0.55 | 0.89 | 0.17 | 0.29 | 0.18 |
| METLIFE AIG ANB | 0.00 | 0.00 | 0.44 | 0.90 | 0.46 | 0.73 | 0.14 | 0.14 |
| Al Alamiya | 0.00 | 0.00 | 0.69 | 0.95 | 0.97 | 0.15 | 0.78 | 0.86 |
| Sagr Insurance | 0.00 | 0.00 | 0.25 | 0.35 | 0.96 | 0.20 | 0.96 | 0.61 |
| Al-Ahlia | 0.00 | 0.00 | 0.78 | 0.91 | 0.93 | 0.93 | 1.00 | 0.59 |
| Alinma Tokio M | 0.00 | 0.02 | 0.61 | 0.61 | 0.29 | 0.75 | 0.85 | 0.95 |
| Allianz SF | 0.00 | 0.00 | 0.69 | 0.33 | 0.54 | 0.74 | 0.95 | 0.41 |
| Amana Insurance | 0.00 | 0.04 | 0.74 | 0.93 | 0.52 | 0.01 | 0.39 | 0.67 |
| AICC | 0.00 | 0.00 | 0.16 | 0.60 | 0.39 | 0.95 | 0.63 | 0.30 |
| Arabian Shield | 0.00 | 0.00 | 0.86 | 0.86 | 0.24 | 0.04 | 0.88 | 0.76 |
| AXA Cooperative | 0.00 | 0.03 | 0.12 | 0.12 | 0.72 | 0.28 | 0.72 | 0.72 |
| Buruj | 0.00 | 0.00 | 0.77 | 0.77 | 0.69 | 0.04 | 0.69 | 0.69 |
| Gulf General | 0.00 | 0.00 | 0.20 | 0.31 | 0.24 | 0.95 | 0.44 | 0.44 |
| Gulf Union | 0.00 | 0.00 | 0.64 | 0.51 | 0.15 | 0.99 | 0.06 | 0.05 |
| Malath Insuranc | 0.00 | 0.00 | 0.37 | 0.62 | 0.62 | 0.50 | 0.69 | 0.45 |
| SAICO | 0.00 | 0.00 | 0.04 | 0.17 | 0.67 | 0.73 | 0.57 | 0.73 |
| Salama | 0.00 | 0.00 | 0.52 | 0.81 | 0.47 | 0.65 | 0.59 | 0.37 |
| Saudi Rein | 0.00 | 0.00 | 0.87 | 0.87 | 0.91 | 0.16 | 0.22 | 0.22 |
| Tawuniya | 0.00 | 0.00 | 0.91 | 0.44 | 0.04 | 0.00 | 0.49 | 0.82 |
| MEDGULF | 0.00 | 0.00 | 0.49 | 0.49 | 0.82 | 0.09 | 0.40 | 0.40 |
| Trade Union | 0.00 | 0.00 | 0.76 | 0.92 | 0.34 | 0.61 | 0.55 | 0.61 |
| U C A | 0.00 | 0.00 | 0.15 | 0.23 | 0.84 | 0.13 | 0.06 | 0.05 |
| WAFA Insurance | 0.00 | 0.00 | 0.33 | 0.58 | 0.05 | 0.02 | 0.76 | 0.50 |
| Walaa | 0.00 | 0.00 | 0.69 | 0.69 | 0.85 | 0.65 | 0.79 | 0.65 |
| Wataniya | 0.00 | 0.00 | 0.11 | 0.40 | 0.32 | 0.02 | 0.61 | 0.41 |
Note: The table reports the Kupiec (1995) test results. The null hypothesis tests, for the long trading position, if the percentage of violations is equal to α. The models are Riskemetrics (RM), Normal APARCH (APARCH-N), Student APARCH (APARCH-ST) and skewed Student APARCH (APARCH-SKT).
Table 3 provides the Dynamic Quantile test statistic (DQ) of Engle and Manganelli (2004). The study observed in-sample performance of the four competing models, at the 1% and 5% significance levels. At the 1% significance level, both RM and APARCH-N VaR models had a poor performance in modelling large negative returns, as with the less restrictive test of Kupiec (1995). The APARCH-ST and APARCH-SKT provided the best performance and the APARCHSKT is still recording the best performance. These results are in line with the Kupiec (1995) test results. At the 5% significance level, all four models provided a bad performance. These conclusions are also valid for both Takaful and Mutual insurance companies.
| Table 3 ENGLE AND MANGANELLI TEST RESULTS (IN-SAMPLE) FOR THE LONG TRADING POSITION |
||||||||
| α = 1% | α = 5% | |||||||
| RM | APARCH-N | APARCH-ST | SKST-APARCH | RM | APARCH-N | APARCH- ST | SKST-APARCH | |
| Takaful insurance companies | ||||||||
| Jazira Takaful | 0.00 | 0.00 | 0.96 | 0.92 | 0.18 | 0.13 | 0.62 | 0.64 |
| AlRajhi Takaful | 0.00 | 0.00 | 0.56 | 0.65 | 0.05 | 0.00 | 0.06 | 0.04 |
| SABB Takaful | 0.01 | 0.47 | 0.94 | 0.40 | 0.00 | 0.01 | 0.14 | 0.14 |
| Solidarity | 0.00 | 0.00 | 0.69 | 0.71 | 0.02 | 0.00 | 0.01 | 0.00 |
| Mutual insurance companies | ||||||||
| CHUBB | 0.00 | 0.00 | 0.92 | 0.98 | 0.08 | 0.00 | 0.00 | 0.00 |
| METLIFE AIG ANB | 0.01 | 0.01 | 0.37 | 0.16 | 0.00 | 0.00 | 0.05 | 0.05 |
| Al Alamiya | 0.01 | 0.07 | 0.98 | 0.98 | 0.00 | 0.00 | 0.01 | 0.01 |
| Sagr Insurance | 0.00 | 0.00 | 0.88 | 0.93 | 0.00 | 0.00 | 0.54 | 0.28 |
| Al-Ahlia | 0.00 | 0.00 | 0.72 | 0.79 | 0.00 | 0.00 | 0.01 | 0.03 |
| Alinma Tokio M | 0.04 | 0.30 | 0.15 | 0.15 | 0.53 | 0.53 | 0.25 | 0.29 |
| Allianz SF | 0.00 | 0.00 | 0.94 | 0.83 | 0.00 | 0.00 | 0.22 | 0.50 |
| Amana Insurance | 0.00 | 0.36 | 0.99 | 0.99 | 0.00 | 0.00 | 0.67 | 0.47 |
| AICC | 0.00 | 0.00 | 0.81 | 0.97 | 0.00 | 0.00 | 0.00 | 0.00 |
| Arabian Shield | 0.00 | 0.00 | 0.06 | 0.06 | 0.02 | 0.00 | 0.00 | 0.00 |
| AXA Cooperative | 0.00 | 0.02 | 0.72 | 0.72 | 0.00 | 0.00 | 0.08 | 0.08 |
| Buruj | 0.01 | 0.01 | 0.55 | 0.55 | 0.02 | 0.00 | 0.02 | 0.02 |
| Gulf General | 0.00 | 0.00 | 0.86 | 0.93 | 0.00 | 0.00 | 0.00 | 0.00 |
| Gulf Union | 0.00 | 0.00 | 0.80 | 0.79 | 0.00 | 0.00 | 0.00 | 0.00 |
| Malath Insuranc | 0.00 | 0.00 | 0.49 | 0.67 | 0.00 | 0.00 | 0.02 | 0.01 |
| SAICO | 0.00 | 0.00 | 0.02 | 0.22 | 0.00 | 0.00 | 0.01 | 0.01 |
| Salama | 0.00 | 0.00 | 0.96 | 0.97 | 0.00 | 0.00 | 0.00 | 0.00 |
| Saudi Rein | 0.00 | 0.00 | 0.72 | 0.72 | 0.54 | 0.29 | 0.64 | 0.64 |
| Tawuniya | 0.00 | 0.01 | 0.82 | 0.73 | 0.04 | 0.00 | 0.29 | 0.34 |
| MEDGULF | 0.00 | 0.01 | 0.95 | 0.95 | 0.01 | 0.00 | 0.32 | 0.32 |
| Trade Union | 0.00 | 0.00 | 0.04 | 0.04 | 0.00 | 0.00 | 0.00 | 0.00 |
| U C A | 0.00 | 0.00 | 0.15 | 0.26 | 0.00 | 0.00 | 0.00 | 0.00 |
| WAFA Insurance | 0.00 | 0.00 | 0.44 | 0.64 | 0.00 | 0.00 | 0.82 | 0.81 |
| Walaa | 0.00 | 0.00 | 0.95 | 0.95 | 0.06 | 0.00 | 0.08 | 0.19 |
| Wataniya | 0.00 | 0.00 | 0.70 | 0.97 | 0.00 | 0.00 | 0.00 | 0.00 |
Note: The table reports the Engle and Manganelli (2004) test results. The models are Riskemetrics (RM), Normal APARCH (APARCH-N), Student APARCH (APARCH-ST) and skewed Student APARCH (APARCH-SKT).
Acknowledgement
This project was supported by Deanship of Scientific Research at Prince Sattam Bin Abdulaziz University under the project No. 2017/02/8310.
Conclusion
The study have two main goals: First, observed the performance of four competing models namely APARCH with Normal distribution (APARCH-N), APARCH with Student distribution (APARCH-ST) and APARCH with skewed Student distribution (APARCH-SKST), in estimating VaR of insurance stocks in KSA. Second, observed at the decoupling hypothesis of Takaful insurance stocks from the mutual insurance companies. The study focus on the insurance industry because it can substantially increase the non-oil GDP sector, as its actual contribution is only 2.1% compared to the banking sector. This is in line with the KSA 2030 vision, which aims at diversifying sources of income for the Saudi economy and decreasing its dependence on oil products. Analyzing this particular industry because the percentage of Gross Written Premium (GWP) retained by the insurance companies (84%, in 2016) is too big compared to the reinsurance contracts. Therefore, the insurance companies are assuming most of the market risk, and they have to manage this risk.
In sum, based on the study results are in line with outstanding literature dealing with the stylized facts of asymmetry and fat tails for stock market volatility in emerging markets. The study concluded two contributions. First, at extreme cases, VaR models with skewed distribution of the conditional variance showed a better performance than normal distribution. Second, Author found that VaR models for Takaful insurance companies had the same patterns as Mutual insurance companies, which is in contradiction with the decoupling hypothesis of Takaful insurance stocks from the mutual insurance companies. Based on observation both segments are under the same authority (SAMA). It is recommend that policy makers and risk managers in the KSA Insurance industry has to take into consideration the asymmetric behaviour of stock returns as well as fat tails in measuring risk.
Endnote
1. According to the Saudi Arabian Monetary Authority, “The banking sector has assets of 126% over the nonoil GDP sector”. Financial Stability Report 2017. http://www.sama.gov.sa/
References
- Ajmi, A.N., Hammoudeh, S., Nguyen, D.K., & Sarafrazi, S. (2014). How strong are the causal relationships between Islamic stock markets and conventional financial systems? Evidence from linear and nonlinear tests. Journal of International Financial Markets, Institutions and Money, 28, 213-227.
- Allen, D.E., Singh, A.K., & Powell, R.J. (2013). EVT and tail-risk modelling: Evidence from market indices and volatility series. The North American Journal of Economics and Finance, 26, 355-369.
- Aloui, C., & ben Hamida, H. (2014). Modelling and forecasting value at risk and expected shortfall for GCC stock markets: Do long memory, structural breaks, asymmetry, and fat-tails matter? The North American Journal of Economics and Finance, 29, 349-380.
- Aloui, C., Hkiri, B., Lau, C.K.M., & Yarovaya, L. (2016). Investors’ sentiment and US Islamic and conventional indexes nexus: A time frequency analysis. Finance Research Letters, 19, 54-59.
- Assaf, A. (2015). Value-at-Risk analysis in the MENA equity markets: Fat tails and conditional asymmetries in return distributions. Journal of Multinational Financial Management, 29, 30-45.
- Christoffersen, P. F. (1998). Evaluating interval forecasts. International economic review, 39(4), 841-862.
- Christoffersen, P. F. (2012). Elements of financial risk management. Academic Press.
- Degiannakis, S., Floros, C., & Dent, P. (2013). Forecasting value-at-risk and expected shortfall using fractionally integrated models of conditional volatility: International evidence. International Review of Financial Analysis, 27, 21-33.
- Diamandis, P.F., Drakos, A.A., Kouretas, G.P., & Zarangas, L. (2011). Value-at-risk for long and short trading positions: Evidence from developed and emerging equity markets. International Review of Financial Analysis, 20(3), 165-176.
- Engle, R.F., & Manganelli, S. (2004). CAViaR: Conditional autoregressive value at risk by regression quantiles. Journal of Business & Economic Statistics, 22(4), 367-381.
- Giot, P., & Laurent, S. (2003). Value?at?risk for long and short trading positions. Journal of Applied Econometrics, 18(6), 641-663.
- Halbleib-Chiriac, R., & Pohlmeier, W. (2012). Improving the value at risk forecasts: Theory and evidence from the financial crisis. Journal of Economic Dynamics and Control, 36(8), 1212-1228.
- Hammoudeh, S., Mensi, W., Reboredo, J.C., & Nguyen, D.K. (2014). Dynamic dependence of the global Islamic equity index with global conventional equity market indices and risk factors. Pacific-Basin Finance Journal, 30, 189-206.
- Hammoudeh, S., Santos, P.A., & Al-Hassan, A. (2013). Downside risk management and VaR-based optimal portfolios for precious metals, oil and stocks. The North American Journal of Economics and Finance, 25, 318-334.
- Hasanov, A.S., Poon, W.C., Al-Freedi, A., & Heng, Z.Y. (2018). Forecasting volatility in the biofuel feedstock markets in the presence of structural breaks: A comparison of alternative distribution functions. Energy Economics, 70, 307-333.
- Huang, A.Y.H., & Tseng, T.W. (2009). Forecast of value at risk for equity indices: an analysis from developed and emerging markets. The Journal of Risk Finance, 10(4), 393-409.
- Kenourgios, D., Naifar, N., & Dimitriou, D. (2016). Islamic financial markets and global crises: Contagion or decoupling? Economic Modelling, 57, 36-46.
- Kupiec, P.H. (1995). Techniques for verifying the accuracy of risk measurement models. Journal of Derivatives, 3, 73-84.
- Maghyereh, A.I., & Al-Zoubi, H.A. (2006). Value-at-risk under extreme values: the relative performance in MENA emerging stock markets. International journal of managerial finance, 2(2), 154-172.
- Masih, M., Kamil, N.K.M., & Bacha, O.I. (2018). Issues in Islamic equities: A literature survey. Emerging Markets Finance and Trade, 54(1), 1-26.
- McMillan, D.G., & Kambouroudis, D. (2009). Are risk metrics forecasts good enough? Evidence from 31 stock markets. International Review of Financial Analysis, 18(3), 117-124.
- McMillan, D.G., & Speight, A.E.H. (2007). Value?at?risk in emerging equity markets: Comparative evidence for symmetric, asymmetric, and long?memory GARCH Models. International Review of Finance, 7(1?2), 1-19.
- Naifar, N. (2016). Do global risk factors and macroeconomic conditions affect global Islamic index dynamics? A quantile regression approach. The Quarterly Review of Economics and Finance, 61, 29-39.
- Nasr, A.B., Lux, T., Ajmi, A.N., & Gupta, R. (2016). Forecasting the volatility of the dow jones islamic stock market index: Long memory vs. regime switching. International Review of Economics & Finance, 45, 559-571.
- Rizvi, S.A.R., & Arshad, S. (2014). An empirical study of Islamic equity as a better alternative during crisis using multivariate GARCH DCC. Islamic Economic Studies, 22(1), 159-184.
- Rossignolo, A.F., Fethi, M.D., & Shaban, M. (2012). Value-at-Risk models and Basel capital charges: Evidence from Emerging and Frontier stock markets. Journal of Financial Stability, 8(4), 303-319.
- Shahzad, S.J.H., Ferrer, R., Ballester, L., & Umar, Z. (2017). Risk transmission between Islamic and conventional stock markets: A return and volatility spillover analysis. International Review of Financial Analysis, 52, 9-26.
- Xekalaki, E., & Degiannakis, S. (2010). ARCH models for financial applications: John Wiley & Sons.
- Yilmaz, M.K., Sensoy, A., Ozturk, K., & Hacihasanoglu, E. (2015). Cross-sectoral interactions in Islamic equity markets. Pacific-Basin Finance Journal, 32, 1-20.