Research Article: 2021 Vol: 20 Issue: 2S
A Confirmatory Factors Analysis of the Happiness at the Workplace in Promoting Employee Happiness in Public Organization
Essa Yousuf Majid Al Suwaidi, Universiti Teknikal Malaysia Melaka
Suriati Akmal, Universiti Teknikal Malaysia Melaka
Samer Ali Alshami, Universiti Teknikal Malaysia Melaka
Keywords
Public Organization, Performance
Abstract
Much is written about work performance happiness from Western and Eastern countries and perspectives, but limited literature is available only to happiness at work, especially in the Arab region. Furthermore, employees in the public organizations in UAE are not well satisfied due to poor workplace conditions. In some ministries in UAE must equipment are not well maintained to ease the work of an employer. However, this study seeks to stimulate a concentration of research on job satisfaction in the Middle East and explicitly in the United Arab Emirates. The aim of the present paper is to confirmatory factors analysis of the happiness at the workplace in promoting employee happiness in public organization. The data were obtained from the employee of Dubai Electricity and Water Authority in UAE. Since the population of this study is 11787 therefore, the sample size was 370. Surveyed through the self-administered Google form and by posting. The data was screened, and out of the 370 questionnaires distributed, 260 were completed and were received. Analysis of Moment Structures (AMOS) in Structural Equation Modelling (SEM) confirmatory factor analysis (measurement and structural measurement models) were used to analysed the data. Although this study has conceptualized the improving happiness at the workplace in promoting employee happiness in public organization. The findings of this study has conceptualized the improving happiness at the workplace in promoting employee happiness in public organization. Additional research is needed among other states in UAE. The motivational formulation of employee happiness, job involvement, work place climate and its impact on organizational performance is a point of future research.
Introduction
Happiness is the degree to which you perceive and evaluate your life as beneficial (Naseem, 2018). In addition to an enduring, psychological feeling of contentment (Mohanty, 2014). In the hedonic view, happiness is pleasant feeling and favourable judgment, while the contrasting eudemonic view describes it as doing what is morally right, what is righteous, that will enhance growth and all that is meaningful to an individual (Ryff & Singer, 2008). Both these views contribute to the overall happiness of an individual.
The extent of employee happiness has been found to have a considerable positive influence on the employee motivation and overall job satisfaction at work (Al-Ali & Shibami, 2019). In particular, workers who display a general sense of happiness and emotional satisfaction with their overall well-being are likely to be inspired to perform extremely well in the workplace environment. Often-happy workers strive to synchronise and convert their emotional happiness by displaying habits that contribute to higher efficiency towards achieving organisational objectives (Jebb & Oishi, 2018). The national culture, which plays an important role in generating and maintaining employee morale in the company, is essential to employee satisfaction (Sony& Mekoth, 2016). People that are pleased with their lives usually experience greater satisfaction and happiness in their jobs
In addition, happiness is correlated with evidence of success in the workplace and can increase an employee’s effectiveness, performance and job satisfaction levels at work (Walsh & Lyubomirsky, 2018). It is therefore, important for organizations to identify the factors which influence employee happiness to enhance its cultural value-offering for employees and, in turn, increase their levels of job satisfaction.
However, addressing a seminar organized by the Emirates Government Services Excellence Programmer, Ms. Al Roumi said: “The UAE government, under the leadership of Sheikh Mohammed bin Rashid Al Maktoum, Vice President and Prime Minister of the UAE and Ruler of Dubai, is keen to transform all government ministries and institutions by creating a happy work environment with the aim of maintaining employee rather than turnover (Lee & Mitchell, 2017; Bakhtiari et al., 2019).
Furthermore, UAE public and private both organizations facing high employee turnover rates (Alhashmi & Papastathopoulos, 2017). In 2014 there are only 38% employee in UAE would like to change their employer Gulf News. There percentage is increased to 56% in 2017. In addition, it is reported that, most employee want the employers to provide a wider array of benefits that can purchase on their own. Although they received high salary, the employees are unsatisfied with the work-life balance support that given by employer. The work-life balance support includes preventive care and stress management. These results show that salary is not the only way to avoid employee retention and maintain happiness among employee.
Helmreich & Merritt (2019) noted that changes in the work style, work culture, family needs, and work demands in UAE public organizations are rapidly taking place, which eventually increased the population of dual earner couples, single parent families and eldercare responsibilities. These increased changes in UAE public organizations have adverse impact on employees’ as well as organizational performance, which is quite evident in the amount of backlog in the UAE public organizations (Al Suwaidi & Alshami, 2020), poor attitude towards work and poor interpersonal relationships, increased pressure at the workplace in UAE public organizations negatively affects the work-life balance (Parakandi & Behery, 2016).
Further, Employees in the public organizations in UAE are not well satisfied due to poor workplace conditions( Bhatnagar & George, 2016 ; Rouhani & Asadi, 2020 ), most of the staff in the government organizations are not happy with their work because of outdated working equipment, rigorous supervision and weak government services in their organizations. This forced many government staff moved to private sectors. These issues tremendously affect the employee happiness in the UAE government organization.
Research Methodology
Since the population of this study is 11787 therefore, the sample size will be determining sample size from a given (Krejcie & Morgan, 1970) which will be 370. AMOS-SEM software package for simulation and modelling procedure is used in locating the significant and dominant factors. Purposive sampling techniques was used while Structural Equation Modelling (SEM) was used to develop a new model of happiness at the workplace in promoting employee happiness in public organization.
The questionnaires were distributed to the staff of Dubai Electricity and Water Authority in UAE. Questions will be provided in both languages English and Arabic language as it is assuming that the citizen of UAE includes UAE national that prefer Arabic language and non-UAE national (expatriates) that use English for communication with local people. The questionnaire included the instruments related to transformational leadership, organizational culture, employee’s empowerment, employee satisfaction and happiness. Thus, an aggregate 370 completed questionnaire were distributed to targeted respondents. Of these, 260 questionnaires were received. The study was conducted from Month, January 2020 to May 2020.
The data were distributed through Posting, Email, and survey and in Person from the sample group. The reason behind this approach is that most of the employees have access to a Personal Computer and Internet. It is also a timely and effective way to receive responses. These prospective respondents will be requested to complete the questionnaire. Table 1 shows the questionnaire was divided into four sections.
| Table 1 Questionnaire Descriptions |
||
|---|---|---|
| Section | Questionnaire | Purpose |
| Section 1 | Demographic information such as Gender, Age, Ethnic Group, Marital Status, Number of Children, Exercise Frequency, Education Level, Years of Service, Job Level and Department | To identify the dimension and dynamics of the population of the developed model. |
| To outlines various indirect factors of the developed model. | ||
| Sections 2 | Independent variables | To capture the respondent’s perception of influence the government entities in promoting a happier work environment |
| Sections 3 | Dependent Variables | To investigate the relationship between happier working environment and employee performance |
| Sections 4 | Mediating | Investigate the relationship between organizational culture, happier working environment and employee performance. |
The responses from the Dubai Electricity and Water Authority in UAE Survey will be analysed using Statistical Package for Social Sciences (SPSS) and AMOS to achieve the research objectives. In order to remove any bias or incorrect records from the datasets, data were cleaned. The nature of the responses was established with the use of descriptive and inferential statistical indexes. The reliability of the instruments was then established by calculating Cronbach alphas.
Analysis and Result
Confirmatory Factor Analysis (CFA)
Confirmatory factor analysis is a more dependable method of factor analysis which is engaged to examine whether the measures of a construct are in agreement with the researcher’s perspective of the nature of that construct (Awang, 2014). In fact, (Awang, 2015) stated that CFA procedure has relieved the older methods such as EFA to establish construct validity.
The proposed assessment happiness at the workplace in promoting employee happiness in public organization was based on the previous validated empirical studies with comprehensive theoretical literature. Confirmatory Factor Analysis (CFA) is to confirm happiness at the workplace in promoting employee in public organization with a view to happiness values within the Abu Dhabi in UAE. Inferably, CFA is to test association that may exist between the observed variables under each hypothesised construct in order to quantitatively assess the quality of the factor structure which would provide further evidence of the construct validity of the new measurement.
Basically, the application of SEM with the combination of CFA for this research is in consonance with the standard steps as recommended by prominent scholars (Awang, 2015; Hair et al., 2012) such as: (1) model specification; (2) model identification; (3) estimation of parameter; (4) measure of goodness-of-fit; and (5) model re-specification.
To be exact, in this research analysis process, the preliminary measure is to test the validity of the measurement model before considering the structural model. Hence, both measurement and structural models were evaluated by model fitting through Maximum Likelihood (ML) estimation. The goodness-of-fit indices and level of acceptance used as guide in the assessment of the construct measurement models and structural equation models’ fitness was presented in Table 2.
| Table 2 Goodness-of-Fit Index and Level of Acceptance |
||||
|---|---|---|---|---|
| Name of category | Goodness-of-fit indices | Acceptance level | Comments | Literature support |
| Absolute fit | Chisq | P > 0.05 | Sensitive to sample size greater than 200 | Wheaton et al., (1977) |
| Absolute fit | RMSEA | RMSEA < 0.08 | Range 0.05 to 1.00 is acceptable | Brownne & Cudeck (1993) |
| Absolute fit | GFI | GFI > 0.90 | GFI = 0.95 | Jorekog & Sorbom (1984) |
| Is a good fit | ||||
| Incremental fit | AGFI | AGFI > 0.90 | AGFI = 0.95 | Tanaka & Huba (1985 |
| Is a good fit | ||||
| Incremental fit | CFI | CFI > 0.90 | CFI = 0.95 | Bentler (1990) |
| Is a good fit | ||||
| Parsimonious fit | Chisq/df | Chisq/df < 5.0 | The value should be less than 5.0 | Marsh & Hocevar (1985) |
Subsequently, re-specified models in this research were tested before using the models for further analysis and Modification Indices (MI) were used as a guide to detect specification error during the process of model re-specification.
Therefore, confirmatory factor analyses of the measurement model of the entire latent constructs in the research assessment framework evaluated and presented in the subsequent sections accordingly. In addition, initial measurement models; fitness indexes; modification indices and; final measurement models were presented sequentially for each latent construct. The purpose of this was for the readers to understand every step of evaluating each of the measurement model fitness in the research assessment model.
Measurement Model for Organizational Culture Construct
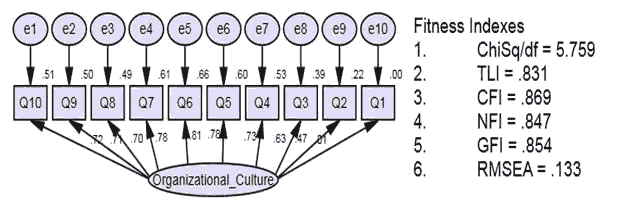
The measurement model for organizational culture is a graphical representation of the relationship between response items and their underlying organizational culture construct and then analysis is carried out using CFA. The construct organizational culture has ten (10) items of questions in the questionnaire. However, (Awang, 2015; Hair et al., 2012) cautioned that the minimum number of items needed to measure a latent construct should not be less than four (4) and this is to avoid the model identification problem during the analysis process.
The application of AMOS is then used for the construct of organizational culture measurement model. The factor loading for each item, squared multiple correlation (R2) and fitness indexes for the organizational culture construct was examined. Hence, AMOS calculated standardized estimate of factor loading and R2 value score of the initial measurement model for the organizational culture construct were presented in Figure 1
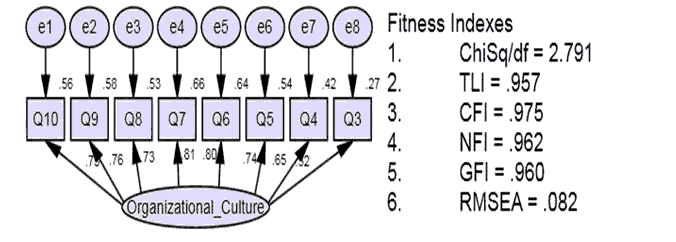
The factor loading for items (Q1 and Q2) is below 0.6, and Chisq/df is higher than 3.0 as presented in Figure 4.5, hence, the need for modification. Therefore, item (Q1 and Q2) were deleted because requirement was not achieved and the new measurement model re-specified and final measurement model for organizational culture construct presented in Figure 2. Hence, the remaining eight (8) items were used in the analyses of structural equation modelling and to test and validate research hypotheses.(Table 3)
| Table 3 Confirmatory Factor Analysis for Organizational Culture |
|||
|---|---|---|---|
| Name of category | Goodness-of-fit indices | Acceptance level | Comments |
| Absolute fit | Chisq | P > 0.05 | Sensitive to sample size greater than 200 |
| Absolute fit | RMSEA | RMSEA < 0.08 | Range 0.05 to 1.00 is acceptable |
| Absolute fit | GFI | GFI > 0.90 | GFI = 0.95 |
| Is a good fit | |||
| Incremental fit | AGFI | AGFI > 0.90 | AGFI = 0.95 |
| Is a good fit | |||
| Incremental fit | CFI | CFI > 0.90 | CFI = 0.95 |
| Is a good fit | |||
| Parsimonious fit | Chisq/df | Chisq/df < 5.0 | The value should be less than 5.0 |
Finally, the organizational culture construct’s final measurement model (2) had satisfied all the acceptable cut-off values as recommended in the goodness-of-fitness indexes (Awang, 2014).
Measurement Model for Employee Satisfaction
The measurement model for employee satisfaction is graphically presented in the relationship between response items and their underlying employee satisfaction construct. Confirmatory Factor Analysis (CFA) was carried out and the result of the analysis presented in Figure 3. In the construct of employee satisfaction measurement model, factor loading for each item, squared multiple correlation (R2) and fitness indexes for each of the items examined.
The factor loading for items (Q11 to Q17) is below 0.5, and Chisq/df is higher than 3.0 as presented in Figure 4, hence, the need for modification. Therefore, item (Q11 to Q17) were deleted because requirement was not achieved and the new measurement model re-specified and final measurement model for LT construct presented in Figure 3. Hence, the remaining five (5) items were used in the analyses of structural equation modelling and to test and validate research hypotheses.(Table 4)
| Table 4 Confirmatory Factor Analysis for Employee Satisfaction |
|||
|---|---|---|---|
| Name of category | Goodness-of-fit indices | Acceptance level | Comments |
| Absolute fit | Chisq | P > 0.05 | Sensitive to sample size greater than 200 |
| Absolute fit | RMSEA | RMSEA < 0.08 | Range 0.05 to 1.00 is acceptable |
| Absolute fit | GFI | GFI > 0.90 | GFI = 0.95 |
| Is a good fit | |||
| Incremental fit | AGFI | AGFI > 0.90 | AGFI = 0.95 Is a good fit |
| Incremental fit | CFI | CFI > 0.90 | CFI = 0.95 Is a good fit |
| Parsimonious fit | Chisq/df | Chisq/df < 5.0 | The value should be less than 5.0 |
Finally, the employee satisfaction construct’s final measurement model (4) had satisfied all the acceptable cut-off values as recommended in the goodness-of-fitness indexes (Awang, 2014).
Measurement Model for Transformational Leadership
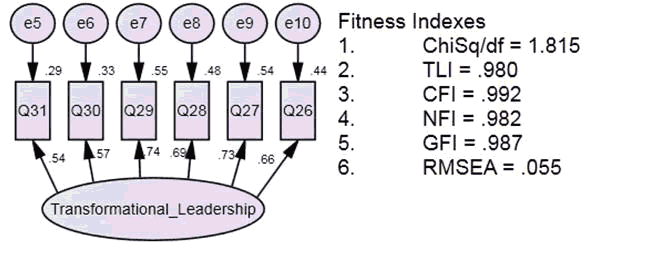
Figure 5, presented the result of Confirmatory Factor Analysis (CFA) for the transformational leadership measurement model. In the construct of transformational leadership measurement model, factor loading for each item, squared multiple correlation (R2) and fitness indexes for each of the item observed were presented. The essence was to identify whether level of acceptance for every index are achieved in the transformational
leadership construct.
From the measurement model transformational leadership, all the factors loadings appear good as none is below 0.5. However, the Chi/df appears to need modification as it was below the minimum acceptable value of 3. Finally, the transformational leadership construct’s final measurement model had satisfied all the acceptable cut-off values as recommended in the goodness-of-fitness indexes (Awang, 2014; 2015). The factor loading for items (Q23 to Q25 and Q32 -Q35) is below 0.5, and Chisq/df is higher than 3.0 as presented in Figure 6, hence, the need for modification. Therefore, item (Q23 to Q25 and Q32 -Q35) were deleted because requirement was not achieved and the new measurement model re-specified and final measurement model for transformational leadership construct presented in Figure 4.10. Hence, the remaining five (5) items were used in the analyses of structural equation modelling and to test and validate research hypotheses. (Table 5)
| Table 5 Confirmatory Factor Analysis for Employee Satisfaction |
|||
|---|---|---|---|
| Name of category | Goodness-of-fit indices | Acceptance level | Comments |
| Absolute fit | Chisq | P > 0.05 | Sensitive to sample size greater than 200 |
| Absolute fit | RMSEA | RMSEA < 0.08 | Range 0.05 to 1.00 is acceptable |
| Absolute fit | GFI | GFI > 0.90 | GFI = 0.95 |
| Is a good fit | |||
| Incremental fit | AGFI | AGFI > 0.90 | AGFI = 0.95 |
| Is a good fit | |||
| Incremental fit | CFI | CFI > 0.90 | CFI = 0.95 |
| Is a good fit | |||
| Parsimonious fit | Chisq/df | Chisq/df < 5.0 | The value should be less than 5.0 |
Finally, the transformational leadership construct’s final measurement model (6) had satisfied all the acceptable cut-off values as recommended in the goodness-of-fitness indexes (Awang, 2014).
Measurement Model for Employee Empowerment Construct
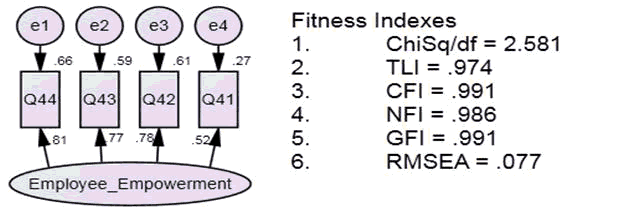
In the same order of presentation, Figure 7 presented the result of the CFA for the ER measurement model. The factor loading for each item, squared multiple correlation (R2) and fitness indexes were observed.
The factor loading for items (Q36 to Q40) is below 0.5, and Chisq/df is higher than 3.0 as presented in Figure 7, hence, the need for modification. Therefore, item (Q36 to Q40) were deleted because requirement was not achieved and the new measurement model re-specified and final measurement model for employee empowerment construct presented in Figure 8. Hence, the remaining four (4) items were used in the analyses of structural equation modelling and to test and validate research hypotheses. (Table 6)
| Table 6 Confirmatory Factor Analysis for Employee Empowerment |
|||
|---|---|---|---|
| Name of category | Goodness-of-fit indices | Acceptance level | Comments |
| Absolute fit | Chisq | P > 0.05 | Sensitive to sample size greater than 200 |
| Absolute fit | RMSEA | RMSEA < 0.08 | Range 0.05 to 1.00 is acceptable |
| Absolute fit | GFI | GFI > 0.90 | GFI = 0.95 |
| Is a good fit | |||
| Incremental fit | AGFI | AGFI > 0.90 | AGFI = 0.95 |
| Is a good fit | |||
| Incremental fit | CFI | CFI > 0.90 | CFI = 0.95 |
| Is a good fit | |||
| Parsimonious fit | Chisq/df | Chisq/df < 5.0 | The value should be less than 5.0 |
Finally, the employee empowerment construct’s final measurement model (see Figure 8) had satisfied all the acceptable cut-off values as recommended in the goodness-of-fitness indexes (Awang, 2014). The result showed that all items had suitable factor loading, in summary, all employee empowerment items construct that satisfied the level of acceptance were used for the structural equation modelling in this research.
Measurement Model for Happiness Construct
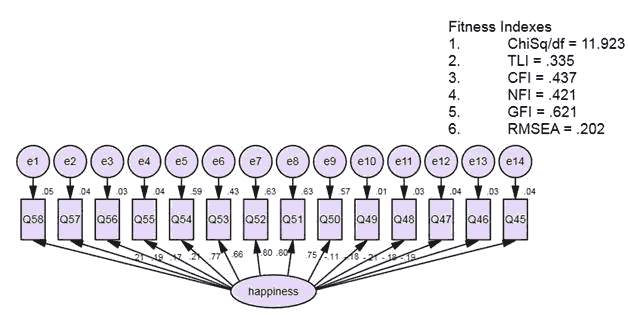
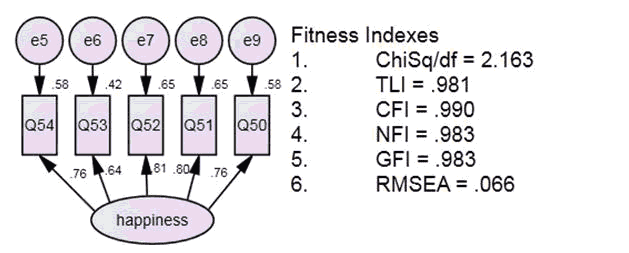
In the same order of presentation, Figure 9 presented the result of the CFA for the happiness measurement model. The factor loading for each item, squared multiple correlation (R2) and fitness indexes were observed.
The result showed that the items from Q45 to Q49 and Q55 to Q58 had low factor loading, so, they candidates to be deleted. Therefore, items were deleted because requirement was not achieved and the new measurement model re-specified and final measurement model for happiness construct presented in Figure 9. Hence, the remaining five items (5) items were used in the analyses of structural equation modelling and to test and validate research hypotheses. The final measurement model is as Figure 10 shown below. (Table 7)
| Table 7 Confirmatory Factor Analysis for Happiness |
|||
|---|---|---|---|
| Name of category | Goodness-of-fit indices | Acceptance level | Comments |
| Absolute fit | Chisq | P > 0.05 | Sensitive to sample size greater than 200 |
| Absolute fit | RMSEA | RMSEA < 0.08 | Range 0.05 to 1.00 is acceptable |
| Absolute fit | GFI | GFI > 0.90 | GFI = 0.95 |
| Is a good fit | |||
| Incremental fit | AGFI | AGFI > 0.90 | AGFI = 0.95 |
| Is a good fit | |||
| Incremental fit | CFI | CFI > 0.90 | CFI = 0.95 |
| Is a good fit | |||
| Parsimonious fit | Chisq/df | Chisq/df < 5.0 | The value should be less than 5.0 |
In summary, all happiness items construct that satisfied the level of acceptance were used for the structural equation modelling in this research.
Conclusion
The findings will also be useful to other organizations services, not only in the country, but also across the region. Specifically, determination of whether the implementation of happiness strategy among their employee has positively contributed towards its performance is expected to provide a benchmark for other agencies in the region in order to foster their performance as well. As such, the findings in this study are expected to not only be useful to the AD organizations, but also to the entire Gulf region as well.
To the best knowledge of the researcher, this is the first study of this kind in the Arab World, and hence the findings are expected to be quite impactful in establishing the specific management issues that face the region. More so, since UAE is a developing country, the findings obtained are expected to create a springboard for other researches in the region with regard to strategic management practices in the happiness systems in the countries within the region. With the adoption of quantitative research methods in this study, new findings on the specific strategic management practices in the UAE’s employee force were expected, and hence this study contributed largely towards enrichment of management research and theories in the Arab world. Validation results proved the factors and measurement models developed and indicated their applicability in happiness evaluations. SEM models were proposed in building satisfaction and performance evaluations using dependent and independent factors. The models provide a guide for better understanding of these facilities and their interactive behaviour. Methodologically, findings of this study add to existing knowledge of relation of happiness.
Acknowledgement
We would like to thank Universiti Teknikal Malaysia Melaka for supporting us in publishing this paper.
References
- Al Suwaidi, E.Y.M., Akmal, S., & Alshami, S.H.A. A conceptual framework of happiness at the workplace in promoting employee happiness in public organization.
- Suwaidi, E.Y.M., Al-shami, S.A., & Akmal, S. (2020). Applying structural equation model to develop a new model of happiness at the workplace in promoting employee happiness in public organization. International Journal of Nonlinear Analysis and Applications, 11, 311-320.
- Ali. A.W., Ameen, A., Isaac, O., Khalifa, G.S., & Shibami, A.H. (2019). The mediating effect of job happiness on the relationship between job satisfaction and employee performance and turnover intentions: A case study on the oil and gas industry in the United Arab Emirates. Journal of Business and Retail Management Research, 13(4).
- Alhashmi, M., Jabeen, F., Al-Nasser, A., & Papastathopoulos, A. (2017). The antecedents of employee turnover intentions in the police force in the united arab emirates: A conceptual framework.
- Awang, Z. (2012). Research methodology and data analysis. Penerbit Universiti Teknologi MARA Press.
- Awang, Z. (2014). A handbook on SEM for academicians and practitioners: The step-by-step practical guides for the beginners. Bandar Baru Bangi, MPWS Rich Resources.
- Awang, Z. (2015). SEM made simple: A gentle approach to learning structural equation modeling. MPWS Rich Publication
- Bakhtiari, M., Ahmadi, Y., & Sarchami, A. (2019). Analyzing the relationship between employee empowerment and organizational success in sarcheshmeh copper complex. SRPH Journal of Applied management and Agile Organisation, 1(1), 1-8.
- Bentler, P.M. (1990). Comparative fit indexes in structural models. Psychological bulletin, 107(2), 238.
- Bhatnagar, A., & George, A.S. (2016). Motivating health workers up to a limit: partial effects of performance-based financing on working environments in Nigeria. Health policy and planning, 31(7), 868-877.
- Browne, M.W., Cudeck, R., Bollen, K.A., & Long, J.S. (1993). Testing structural equation models.
- Hair, J.F., Sarstedt, M., Ringle, C.M., & Mena, J.A. (2012). An assessment of the use of partial least squares structural equation modeling in marketing research. Journal of the academy of marketing science, 40(3), 414-433.
- Helmreich, R.L., & Merritt, A.C. (2019). Culture at work in aviation and medicine: National, organizational and professional influences. Routledge.
- Jebb, A.T., Tay, L., Diener, E., & Oishi, S. (2018). Happiness, income satiation and turning points around the world. Nature Human Behaviour, 2(1), 33-38.
- Joreskog, K.G., & Sorbom, D. (1984). LISREL: Analysis of Linear Structural Relationships by the Method of Maximum Likelihood. Version VI. Chicago: Nationai Education Resources. Parameswaran, Ravi and A. Yaprak (1987)," A Cross-National Comparison of Consumer Research Measures," Journal of International Business' Studies, 18, 35-49.
- Krejcie, R.V., & Morgan, D.W. (1970). Determining sample size for research activities. Educational and psychological measurement, 30(3), 607-610.
- Lee, T.W., Hom, P.W., Eberly, M.B., Junchao (Jason) Li, & Mitchell, T. R. (2017). On the next decade of research in voluntary employee turnover. Academy of management perspectives, 31(3), 201-221.
- Marsh, H.W., & Hocevar, D. (1985). Application of confirmatory factor analysis to the study of self-concept: First-and higher order factor models and their invariance across groups. Psychological bulletin, 97(3), 562.
- Naseem, K. (2018). Job stress, happiness and life satisfaction: The moderating role of emotional intelligence empirical study in telecommunication sector Pakistan. J. Soc. Sci, 4(1), 7-14.
- Parakandi, M., & Behery, M. (2016). Sustainable human resources: Examining the status of organizational work–life balance practices in the United Arab Emirates. Renewable and Sustainable Energy Reviews, 55, 1370-1379.
- Rouhani, B., & Asadi, F. (2020). The effect of implementation of ethical management-based systems on the employee’s administrative health in the organizations. SRPH Journal of Medical Sciences and Healthcare Management, 2(1), 1-4.
- Sony, M., & Mekoth, N. (2016). The relationship between emotional intelligence, frontline employee adaptability, job satisfaction and job performance. Journal of Retailing and Consumer Services, 30, 20-32.
- Tanaka, J.S., & Huba, G.J. (1985). A fit index for covariance structure models under arbitrary GLS estimation. British journal of mathematical and statistical psychology, 38(2), 197-201.
- Walsh, L.C., Boehm, J.K., & Lyubomirsky, S. (2018). Does happiness promote career success? Revisiting the evidence. Journal of Career Assessment, 26(2), 199-219.
- Wheaton, B., & Muthen, D.F. (1977). ALWIN, and GF SUMMERS (1977) “Assessing reliability and stability in panel models,” pp. 84-136 in DR Heise (Ed.).
