Research Article: 2021 Vol: 20 Issue: 2S
A Methodology of Bringing Perspective Innovation Products to Market
Sergey Yevgenievich Barykin, Peter the Great St. Petersburg Polytechnic University
Andrey Aleksandrovich Bochkarev, National Research University Higher School of Economics
Sergey Mikhailovich Sergeev, Peter the Great St. Petersburg Polytechnic University
Tatiana Anatolievna Baranova, Peter the Great St. Petersburg Polytechnic University
Dmitriy Anatolievich Mokhorov, Peter the Great St. Petersburg Polytechnic University
Aleksandra Maksimovna Kobicheva, Peter the Great St. Petersburg Polytechnic University
Keywords
Innovation System, Open Innovations, Scientific Cooperation, Interaction Model, Innovation Products.
Abstract
Within the innovative economy competing firms bring innovative products to market on the basis of free flow of innovative ideas and effective interaction between the scientific sphere and the business environment. Authors aim to develop the methodology for comparing the innovative products and selecting the products for bringing to market within the framework of the interaction model. The empirical significance of the developed methodology is increasing the effectiveness of the innovative process within the frameworks of the innovative ecosystem. One of the most important steps towards building an innovation ecosystem is the formation of effective models of interaction between universities, government and the business community. However, an effective interaction model of universities, business and government in Russia is in a process of launching. Authors suggest making innovative decisions on the basis of the methodology of innovative products selections taking into account the efficiency of all forms of joint cooperation. The developed methodology can be recommended for usage in the practice of managing the innovation activities to achieve significant results.
Introduction
Currently the implications of open innovation concept could vary depending on specific conditions (Yun, 2017), and different countries and regions are characterized by unique technological development trajectories (Nguyen et al., 2019; Zhao et al., 2020), which include a variety of different schemes for the generation, dissemination, and use of new knowledge that determine a specific socio-economic system (Dosi, 1982). The creation of a harmonious ecosystem of government, business, and universities is the key goal of any state focused on innovative development (Bedford et al., 2018). One of the most important steps towards building an innovation ecosystem is the formation of effective models of interaction between universities, government and the business community (Antipov et al., 2019).
In the modern world, more and more organizations are using the advantages of a synergistic approach, when openness to partnership is the key to the prosperity of both all participants in the interaction and the whole region, district, country. Higher schools (universities) act as key elements of this system, being its connecting links, the main purpose of which is the following types of activities: the formation of communication networks and the organization of effective and efficient interaction with the external environment (Kobicheva & Bryant, 2020), performing the functions of communicators, mediators in a broad aspect of the social-economic system (Kobicheva, Baranova & Tokareva, 2020) How the effective interaction model of innovation actors in Russia should look today? Which indicators should be taken as the basis of effective interaction of university and business structures in innovation system? How to select the most perspective joint innovative projects of universities and business structures for adequate bringing innovative products to market? These are still unresolved issues on the Russian market that make the study relevant and predetermine the goal.
This paper is structured in the following way. Introduction proves the relevance of the research. Section 2 describes the theoretical background on the open innovation perspectives as the key concept of improving in-novation activity efficiency due to permanent interaction and cooperation of innovation system actors. The next Section 3 contains the main research results. Some interesting issues regarding the interaction process inside innovative systems are discussed in the Section 4. Finally, the obtained results are discussed in the context of other research studies (Section 5).
For the manufacturer and its business, the problem of technology turnover and the task of choosing a strategy for entering the market are closely interrelated. Since the turn of the 20th century, the entire world has entered a period of technological singularity. It is also predicted that the pace of changing technologies, generations of products and services will constantly increase. Designers and technologists are forced to search for such solutions when developing products in order to meet a number of multidirectional criteria. This was especially evident in the segment of technically complex products and computer equipment. On the one hand, the reliability requirements imply a guarantee of long-term serviceable operation. On the other hand, already at the stage of launching products to the consumer market, specialists are aware of innovative solutions for the next generations in this product segment. This means that it is possible to predict the period when the obsolescence of products will occur. A partial solution lies in the field of obsolescence management and risk management techniques. But the difficulty is that part of the consumer pool has a habit of the previous generation, has the inertia of thinking and consumption, and slowly changes its preferences.
Materials and Methods
Theoretial Foundations
Ongoing globalization and exponential growth in technological intensity (Chesbrough & Bogers, 2014; Gassmann, 2006) has increased the importance and need for Open Innovation (OI) (Mitchell & Singh, 1996; Ghobakhloo & Fathi, 2019) which has been recognized as an integral part of one of the Sustainable developments of the United Nations until 2030 (Smart et al., 2019; UN General Assembly, 2015).
Scientific awareness of OI has grown exponentially since the seminal work of Chesbrough (Chesbrough & Bogers, 2014), resulting in more than 4,000,000 documents indexed on Google Scholar in 2020. Chesbrough stated that “... valuable ideas can come from inside or outside the company and can go to market from inside or outside the company as well” (Chesbrough, 2017) (p. 43). Building on Chesbrough's comments on the OI paradigm, OI research has moved forward over the years. In 2014, Chesbrough and Bogers (Chesbrough & Bogers, 2014) (p. 33) expanded on the original concept of OI by introducing a modern definition: “a distributed innovation process based on purposively managed knowledge flows across organizational boundaries, using pecuniary and non- pecuniary mechanisms in line with the organization's business model”.
Several authors evaluated the OI results and stressed the need to further explore the OI perspectives in theory and practice. For example, Gassmann and colleagues (Chesbrough, 2017) contributed to the OI phenomenon by organizing a field of research and identifying gaps, highlighting the importance of patents and intellectual property. In addition, these authors demonstrated the relevance of studying OI on SMEs by highlighting the impact of OI on virtual R&D teams. Then, building on the evolution of the OI paradigm and growing interest among academics and practitioners, Chesbrough and Bogers described the volume of academic literature since the term “open innovation” was coined in 2003. In their seminal paper, Chesbrough and Bogers expanded the definition of OI by introducing monetary and intangible mechanisms for inbound and outbound OI and emphasizing the importance of the firm's business model. More recently, Bogers and colleagues (Bogers et al., 2017) have developed an integrative structure of analysis levels for OI research. They have contributed to the development of the paradigm by presenting the possibilities for future research at the micro, meso and macro levels of analysis (for example, from individual problems to OI applications at the sectoral or national level). Overall, these scientists demonstrated the importance of examining the role and application of OI as the key concept of improving innovation activity efficiency, thus confirming the need for our research.
Open innovation focuses on using targeted knowledge inflows and outflows to accelerate internal and external innovation (Faems, 2008). The phenomenon of open innovation has also influenced the way universities and research groups conduct research and contribute to innovation processes (Perkmann & Walsh, 2007). Innovation is a multi- step process (Anahita, Jennifer & Sally, 2009) that includes several types of practices at different stages (West et al., 2014). Over the past 10 years, open innovation research and policy has focused on developing and promoting more inbound rather than outbound practices and processes to create valuable knowledge (Bogers et al., 2017; Enkel, Gassmann & Chesbrough, 2009). Advances in open innovation policies and practices, such as open data (Murray-Rust, 2008), open access to research publications (Ross, 2011) or open infrastructure for co-creation of knowledge (European Commission, 2014), have undermined the well-established open innovation policy, and with it the standard types of openness in innovation, that is, identification and sale (outbound) and search and acquisition (in-bound) (Dahlander & Gann, 2010). Digital and communication technologies have opened new unexplored opportunities and challenges for the management of innovation in universities (for example, reliable data exchange, quality control and reproducibility of research methods and results, management of collaborative research platforms, funding instruments, university-industry relations, strategic alliances, spin-offs, startups and consortia). In this regard, discovering how research groups are using new findings from open innovation is a top priority for developing effective policy and governance mechanisms for universities.
The open innovation practice of interaction between universities and business in Russia is a new field of study. This practice enhances scientific integrity, and understand the value of research and innovation (Perkmann et al., 2013; Tacke, 2010). Therefore, it is necessary to understand how open innovation affects the management of research and innovation in universities. New institutions of open innovation need to be adapted, updated and combined to effectively realize their re-search and innovation potential in the digital world. Universities are a solid foundation for open innovation (Ayris et al., 2018; Bedford et al., 2018) that foster innovation processes at the global, regional, national and local levels.
Using the Leydesdorff model (triple helix), it is possible to adequately define and measure the relations between the actors of the innovation system, in particular, the authorities, the business environment, and higher schools, due to which it is possible to achieve synergy or the integral effect of innovation. There is not a single example in the world when the National Innovation System (NIS) is effectively implemented in parallel with the principles of the triple helix, and when higher schools are not present at the center of all events. The logic of dependence on universities is simple - only through the efforts of the younger generation can a new economy be built. These people are in only one place - in universities, so this particular place, first of all, should focus on resources for the development of innovative processes (Leydesdorff, Perevodchikov & Uvarov, 2015).
One of the most important issue to be considered is the fact that open innovations allow interacting people and organizations in creating ecosystems. Chesbrough notes that the main trend in the development of open innovation regards the digital transformation (Bogers et al., 2019). It involves business models—the logic of creating and capturing value—that dynamically transcend organizational boundaries within that innovation ecosystem (Bogers, Chesbrough & Moedas, 2018). So, small organizations are able to rapidly increase their influence in the market on the basis of open innovations being defined by Clayton M. Christensen as disruptive. He examined the complexity and inconsistency of innovation (Christensen et al., 2018).
The complexity of knowledge could be investigated using the Quadruple Helix model (Carayannis & Campbell, 2009) which differs from the fundamental Triple Helix model of innovation by adding a fourth helix as the “media-based and culture-based public” to the “university-industry-government relations” (three helices developed by Etzkowitz and Leydesdorff (Etzkowitz & Leydesdorff, 2000) generating a national innovation system: academia/universities, industry, and state/government. Leydesdorff explains that the metaphor of a Triple Helix could be considered as a basis for making the extensions the model to more than three helices (Leydesdorff, 2012). The abovementioned Quadruple Helix and suggested later the Quintuple Helix being ecologically sensitive (Carayannis, Barth & Campbell, 2012) could be treated as universal and in a wide sense be extended to N-Tuple Helix model (Park, 2014).
A new stage in the development of society endows knowledge with great power in public life, therefore universities, as the main creators of knowledge, should introduce a new function in modern conditions and act as integrators. By "integration function" we mean the organization of processes of interaction of elements in a complex system to ensure its development. In a particular case, we consider information interaction, which is a process of joint production, exchange, and transfer of knowledge. The University plays the role of a leading participant and organizational intermediary for cooperation between the academic environment, business environment, and law enforcement agencies. The main goal of this cooperation is to unite efforts to solve interdisciplinary problems in the educational and scientific fields, as well as activities aimed at introducing innovations. The complex tasks of forming and searching for rational ways to implement the results of scientific and technical projects highlight the need to assess their results.
Developing the Model for Bringing the Innovative Product to Market
In this paper, we propose a methodology that allows us to assess the necessary reduction in the supply of the previous generation of technologies and to increase the market presence of the next, innovative, and provided that the maximum total profit is maintained. For practical calculation, a study of the offer of SAN (Storage Area Network) solutions from Huawei was conducted. The choice of the data storage equipment market is based on Gartner research. According to its analysts, the required amount of SAN capacity increases by more than 50% annually. In addition, the review of changes in the technical solutions used by SAN developer’s shows that the update of innovative technologies is due to their role as one of the most dynamically changing areas of high-tech products.
According to Digital Economy Compass 2020 Statista, which compiled the most relevant and recent data on the entire digital economy, there is a steady trend to change the balance between the share of data that companies store on their own data storage systems and in cloud storage (Figure 1).

Figure 1: Changing the Balance of Demand for Types of Storage Systems.
This dynamic reflects the growing demand for data storage systems from the corporate business segment. Also, a necessary condition is the modernization of the IT (information technology) infrastructure of all active participants in business activities. The situation in the world caused by the COVID-19 pandemic was a particularly noticeable driver of the increase in IT capacity (Genkin & Mikheev, 2020) and the scale of data storage systems. In 2020, the increase in the required capacity for data processing and storage has doubled compared to the previous year. According to the results of a study conducted by IDC EMEA Quarterly Enterprise Storage Systems, investments in high-performance flash systems increased in the period 2019-20, the share of which was about 40% in monetary terms. This shows that traditional hard disk drive-based storage systems are still dominant among consumers. But if you pay attention to the dynamics of growth in demand for flash storage systems, then according to Markets and Markets Research, the demand for this innovative technology increases by an average of 25% (Figure 2).

Figure 2: All-Flash Array Market By Region.
Also, the most important result of this statistical review was the analysis confirming the steady growth of object data warehouses. In addition, if in the period up to 2018, innovative flash storage hosted business-critical software applications, now there is a process of consolidating all information resources of the enterprise and gradually replacing traditional types of data storage. The main indicators that determine the choice of the type of data storage:
• Performance and flexible reconfiguration;
• Scalability due to special software for increasing storage volumes, expanding functionality and upgrading;
• Fault tolerance, redundancy of all composite nodes;
• Data availability, replication, and persistence features;
• Web-based management, monitoring and diagnostics.
Since when choosing a storage system, the consumer evaluates the system in combination with the costs of its acquisition and operation, the criterion is usually a balance of economic and technical indicators that characterize the positive aspects of previous and innovative solutions.
Since the production of innovative products, as a rule, involves a significant part of the available material resources and at the same time uses the same production facilities, science-based planning (Conceição, Sousa, & Fontes, 2018) allows to optimally rebuild the production process. In the service sector or business organization, the application of the proposed methodology will provide maximum economic efficiency for the combined application of both technologies. The result will be the ability to plan investments in innovative technologies and solutions and, most importantly, to remain competitive.2.3.
Formulation of the Problem
In this paper, the task of finding an economically sound strategy for bringing an innovative product to the market is set. It is necessary to find a balance between reducing the output of products using the previous technology and increasing the production and sale of an innovative product. Since these business processes involve significant financial costs, the quality criterion (Krasnov et al., 2019) of the resulting solution will be the total profit from the demand in the consumer market for products based on both technologies, taking into account the costs incurred to promote the innovative product.
Solution Method
First, we define the basic formalisms necessary to develop a mathematical model. This process is divided into three stages:
1. To assess the market demand for products of the previous generation and innovative, we use the data of marketers. Let's combine the analytical statistics into a matrix of market preferences. The elements of such a matrix correspond to the level of demand for the products offered, taking into account the competitive environment.
2. Let's use the method of dynamic assessment of the development of consumer demand based on the matrix data market demand using the theory of statistical analysis and stochastic planning.
3. We will evaluate the final economic indicators calculated for an acceptable planning horizon for the programs of production of the previous and innovative product.
We also introduce the concept of the planning period T , after which the assessment of economic indicators takes place.
At the first of these stages, we will define a list of summary marketing indicators and use them to process demand statistics for products of the previous generation and for innovative products. We introduce the following grouping of the consumer pool: DN (Demand for an innovative) - the consumer purchases our innovative product during the period T ; DF (Demand for a former) - the consumer purchases our product of the previous generation during the period T ; DS (Stopped using) - the consumer has stopped purchasing our company's products either because of lack of need, or purchases them from competitors during the period T ; DP (Does not consume products) - the consumer either has not used this type of product yet, or has purchased it from other manufacturers during the period T .
All data in a formalized form can be presented in the form of a matrix of consumer preference statistics. (Table 1)
| Table 1 Matrix of Consumer Demand Statistics |
|||
|---|---|---|---|
| DF | DN | DS | |
| DF | P11 | P12 | P13 |
| DN | P21 | P22 | P23 |
| DP | P31 | P32 | P33 |
The corresponding positions of the matrix contain statistical data in the form of transition probabilities between the listed categories of consumers.
P11 - data on the number of consumers of the previous generation of the product during the planned period and who continued to use it;
P12 - data on the number of consumers of the previous generation of the product during the planning period and who changed it to an innovative one;
P13 - data on the number of consumers of the previous generation of the product during the planned period and are no longer interested in our products;
P21 - data on the number of consumers of innovative products during the planning period and who abandoned it in favor of the previous generation of the product;
P22 - data on the number of consumers of innovative products during the planning period and continuing to use them;
P23 - data on the number of consumers of innovative products during the planned period and no longer interested in our products;
P31 - data on the number of consumers who purchased a product of the previous generation during the planning period;
P32 - data on the number of consumers who purchased an innovative product during the planning period;
P33 - data on the number of consumers who are interested in our products, but have not yet made a purchase during the planned period.
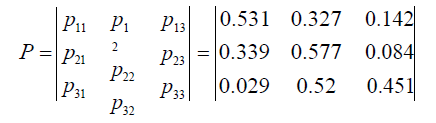
This data can be formalized (Borisoglebskaya et al., 2020) in the form of a matrix P :
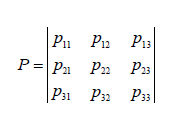
The elements of the matrix P = {pi j } , i, j = 1, 2, 3 row by row, must meet the conditions of the complete group of events Σ pi j = 1, j ∀i , that is, the matrix P is stochastic on the right.
The second stage involves the use of the value estimation method Pi j , ( i, j = 1, 2, 3 ) of the consumer demand matrix. Within the framework of the task under consideration, it is necessary to take into account such features of the consumer and, first of all, the corporate market, as a difficult to identify internal structure, an aggressive competitive environment (Provotorov et al., 2020) and a short period of operation time and, accordingly, the terms of product changeability.
For the possibilities of software implementation of statistical estimation of values (Pij i, j = 1, 2, 3 ), we applied a modern algorithm with the property of scalability and invariance to the data.
In the mathematical modeling of (Borisoglebskaya et al., 2019a) matrix values, a general representation is used in the form: p* (t) = p(t) + λ(t) , where the component p(t) is a deterministic function that meets the condition: p(t) = p(t + mT) : ∀m = 1, 2,... . In this expression: t - time; T - period.
We use the designation: λ(t) - random changes caused by a variety of factors such as the competitive market environment, changes in consumer preferences, economic and other (Borisoglebskaya, Provotorova & Sergeev, 2019) numerous reasons.
To apply mathematical modeling, it is necessary to process statistical data and estimate the T magnitude and values of the coefficients used in demand modeling (Krasnov et al., 2019b) of the Fourier expansion: A(t) , An , θn for n = 1, 2,... as elements of the vectors (Krasnov et al., 2019a) {A0 , A1 , A2 ,...} and {θ1 ,θ2 ,...} .
To do this, it is necessary to formalize the functions p* (t); p(t);λ(t) over asufficiently long period of time t ∈ [0, t*].
We introduce additional functions of the form: pk* (t) = p* (t + kT ); k = 1, 2,... , defined on t ∈[0,T ] .
The deviations λ(t) in this case will be centered random fluctuations. We introduce the deviation indicator: Δ(T, p* ) = Δ(T, p* (t), p* (t),...) and estimates of the amplitude:
 where is the mathematical expectation M
  obtained by calculating the averaged values of the original functional dependencies. To calculate them, we use expressions for processing statistical series as follows:
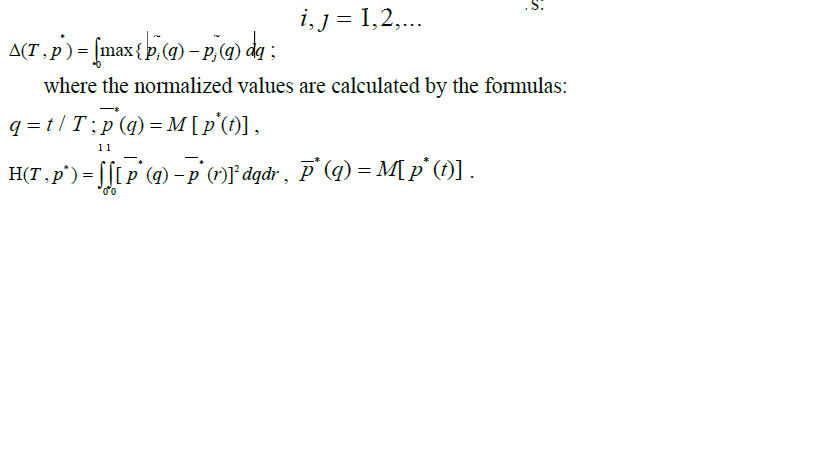
For practical purposes, it is important to get an average estimate of the desired component:  and its characteristic allows you to observe long-term trends and, in addition, can serve the purposes of predictive planning.
At the third stage, first, using the (Pilipenko et al., 2019) method of calculating the values Pij ( i, j = 1, 2, 3 ) of the matrix, we determine their specific values.
We supplement the calculated data with a vector of economic indicators G of the form: G = {gF , gN } , where gF -corresponds to the profit from the sale of a product of the previous generation, gN - respectively from the sale of an innovative one.
The corresponding positions G contain the results of the calculation of integrated profit indicators (Golosnoy et al., 2019), depending on the technology of the product offered on the market.
Mathematical Modeling
Based on the formalization of the indicators of market interest in the products of the previous generation and innovative, we apply the algorithm (Sergeev & Kirillova, 2019) (Borisoglebskaya et al., 2019) estimates of the cost conversion for the promotion of an innovative product, the dynamics of changes in consumer demand, and the total profit from the market presence of both generations of products. This will allow you to reasonably plan the costs of mastering the industrial production of innovative products and marketing.
We introduce the concept of the state vector of market (Borisoglebskaya, Provotorova & Sergeev, 2019) (Sergeev et al., 2020) demand 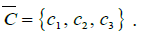
The components reflect the C following quantitative indicators: c1 - the number of consumers of the previous generation of the product during the planning period T ; number of consumers of the innovative product during the planning period T ; c2 - the number of consumers of the innovative product during the planning period T ; c3 - the number of consumers who have stopped purchasing our products or who are interested in them, but did not purchase them during the T planned period.
To perform the calculation, we will fix the estimated planning horizon and divide it into periods. As a rule, a period is taken for a period of time after the expiration of which, summary reporting data is provided. In the problem under consideration, 1 month is taken for the period, and the entire horizon is given a length of 6 months. This is due to the fact that the parameters of consumer demand can change significantly over long periods of time. Note that for an abstract mathematical model, the specific values of the duration of the period are not significant.
Then the volume of demand for the next planning period will be calculated using the formulas:
c11 = c1 p11 + c2 p21 + c3 p31 ; c21 = c1 p12 + c2 p22 + c3 p32 ; c31 = c1 p13 + c2 p23 + c3 p33
Where for cij the first index i = 1 means the number of consumers of the previous generation of products, for i = 2 innovative consumers, for i = 3 new consumers; the second index indicates the j number of the planning period.
Briefly, this can be written as: 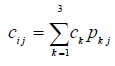 for i, j = 1...3 . Applying the rules of matrix algebra, write this relation in a vector-matrix form, convenient for programming and composing algorithms:
  P where
 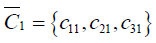 The result reflects the state of market demand across the period. Then we calculate in two periods:
Thus, the full calculation includes the determination of the power spectrum of the P, P2 ,..., PR consumer demand matrix.
Multiplying the initial vector  sequentially by the degrees of the matrices, we will already get the values of the volume of consumer demand for the previous generation of the product and for the innovative one.
Then, using the data on the profit from the sale of the previous product gF and the innovative gN and, summing up the profit G for all periods in the form: 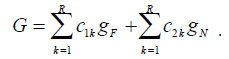
Summing the profit for all periods generating by both a product of the previous generation gF and an innovative product gN , we will get an economically significant indicator G .
Results
Using a mathematical model based on specific numerical data makes it possible to optimize the production program of such technologically complex Huawei products as data storage systems. For the calculation, information on the following proposed substitute products is used. A high-performance storage system based on artificial intelligence technologies called Huawei OceanStor Dorado and Huawei OceanStor Pacific Series.
Each product line from these solutions provides cost-effective, cost-effective and technologically efficient reliable services. The range of their applications is extremely wide and is used for high-performance computing as part of problem-oriented applications, artificial intelligence systems, high-speed analysis and recognition of video materials, as well as in a number of other information-rich scenarios. Innovative systems go beyond the operational parameters, service, traditional and architectural.
They also use a new-generation elastic EC (Erasure code) algorithm and the possibility of uncompromising multiprotocol interaction. This gives an innovative option to recover entire digital data packets in various situations when information is lost, helps to protect information, preventing data leaks when working with memory or when transmitting them through various communication channels. Also, a number of specialized hardware components are built into these systems. These lines set a new standard for forward-looking storage systems. In many industries, these systems will optimize business processes, and expand the potential of digital information for the introduction of intelligent technologies. Note that these products belong to corporate equipment worth tens of thousands of dollars. The increase in sales, even a small one, should bring Huawei a serious profit.
The initial data for the calculation based on the presented model are the current sales figures of Huawei in the segment of SAN solutions. From this data, we get the value of the vector 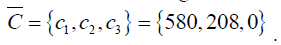
Processing statistics according to the proposed method gives the value of the consumer preferences matrix.
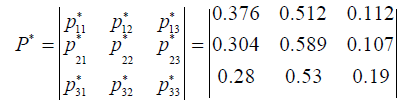
The obtained values reflect the current state of sales of products with planned investments in the promotion of modern flash technologies of data storage systems. If we plan additional costs in the amount of Q = 45, 000 USD for marketing in order to expand the pool of consumers of innovative systems, then the analysis of statistics gives a slightly different picture. At the same time, we get new values of the consumer preferences matrix. Let's denote it as P* .
The calculation process for the same initial data for the vector  is presented in Table 2. When programming the calculation for 6 planned accounting periods, data for the degrees of the P and P* matrices are obtained, which are used in the presented mathematical model.
| Table 2 Calculation Process |
|||||
|---|---|---|---|---|---|
| Matrix P | Matrix P* | ||||
| 2nd exponentiation of a matrix | |||||
| 0,3969 | 0,4362 | 0,1669 | 0,3284 | 0,5534 | 0,1182 |
| 0,3780 | 0,4875 | o, 1345 | 0,3233 | 0,5593 | O, 1174 |
| 0,2048 | 0,5440 | 0,2512 | 0,3196 | 0,5562 | o, 1242 |
| 3rd exponentiation of a matrix | |||||
| 0,3635 | 0,4683 | 0,1683 | 0,3248 | 0,5567 | 0,1185 |
| 0,3699 | 0,4748 | 0,1553 | 0,3245 | 0,5572 | 0,1184 |
| 0,3004 | 0,5115 | o, 1881 | 0,3240 | 0,5571 | 0,1189 |
| 4th exponentiation of a matrix | |||||
| 0,3566 | 0,4765 | o, 1668 | 0,3245 | 0,5570 | 0,1185 |
| 0,3619 | 0,4757 | o, 1624 | 0,3245 | 0,5570 | 0,1184 |
| 0,3384 | 0,4912 | 0,1704 | 0,3245 | 0,5570 | 0,1185 |
| 5th exponentiation of a matrix | |||||
| 0,3558 | 0,4783 | o, 1659 | 0,3245 | 0,5570 | 0,1185 |
| 0,3581 | 0,4773 | o, 1646 | 0,3245 | 0,5570 | 0,1185 |
| 0,3511 | 0,4827 | 0,1662 | 0,3245 | 0,5570 | 0,1185 |
| 6th exponentiation of a matrix | |||||
| 0,3559 | 0,4786 | 0,1655 | 0,3245 | 0,5570 | 0,1185 |
| 0,3567 | 0,4781 | 0,1652 | 0,3245 | 0,5570 | 0,1185 |
| 0,3549 | 0,4797 | 0,1654 | 0,3245 | 0,5570 | 0,1185 |
Next, you need to estimate the reduced profit G in the absence of additional investments in marketing promotion and calculate the reduced profit G* after additional costs in Q the amount of promoting modern flash technologies for all periods. If there is a difference in values G* - G > Q , this means that it is advisable to spend money on the promotion of innovative digital technology.
It is more convenient to present the results of the calculation in the form of diagrams (Figure 3) and (Figure 4). The presented graphs clearly show the significant influence of even small changes in the composition of the matrices P and P* .

Figure 3: Simulation Results in the Absence of Additional Investment

Figure 4: Simulation Results, Taking Into Account Additional Investments
The system of graphs in Figure 4 shows the dynamics of changes in demand for products of the previous generation (Former), innovative (Innovative) and the projected total profit (Sum). The calculation was carried out in the absence of additional investments for the marketing promotion of an innovative technological solution.
The system of graphs in Figure 5 shows the dynamics of changes in demand for products of the previous generation (Former), innovative (Innovative) and the projected total profit (Sum*). The dotted line also indicates the change in profit (Sum) based on the results shown in Fig. 4. The calculation was carried out under the conditions of additional costs for the promotion of modern flash technologies for all periods.

Figure 5: The Sphere of Active Participation of the University Integration Function In Innovation Processes.
Taking the triple helix model as a basis, we propose to build an interaction model of the innovation process actors in the Russian Federation. In our model, the integration function of universities connects the information flow of three dynamic and constantly developing actors of the innovative economy (government - academy - business) by a common thread. The locus of function is located in the center of the model, and the core, or "information genome", encourages all drivers to create multilayer communications, networks, and organizations among the spirals (Figure 6).

Figure 6: The Locus of the Integration Function in the Model of Interaction Between the Actors of The Innovation Process
Although the spirals of institutional spheres are constantly evolving and trans-forming new information, the integration function is not lagging but is being modernized and adapted to new conditions, helping to interact with subjects at every level of their development. Universities in the process of implementing the integration function create innovative schemes for the transfer of knowledge based on digital technologies, new methods for calculating the attractiveness of common projects with the industry, thereby increasing the return on investment, universities are responsible for management innovations during the integration process, and also monitor the observance of intellectual property rights.
The university integration function can be interpreted as a flow of knowledge generated and appropriately supported by the efforts of universities. Thus, thanks to the integration function of universities, the most favorable environment for the implementation of innovative activities in general appears. This enabling environment is an in-novation ecosystem in which participants in the innovation process interacting with each other have a synergistic effect. Collaborative innovation ecosystems are considered successful innovation ecosystems. A successful ecosystem is based on the organizational structure of the network.
Conclusion
In the most general form, the task of determining the strategy of behavior in the market rests on the problem of the changeability of technologies, the changeability of generations of goods and services. Since the world has already entered a phase of technological singularity several decades ago, the pace of such turnover will only increase. The essence of the problem is that it is necessary to constantly improve the products, apply innovative solutions in technologies, materials and product properties. This applies not only to industrial production, but also to the service sector, information, administrative and other types of interaction. Consumer preferences have inertia. It is not just conservative thinking and habits that are causing the slow change in the vector of consumer demand. The need for re-equipment costs is also a serious reason to use the technologies of the previous generation. On the other hand, innovative products and technologies are more competitive. The task of the business is to find a strategy that meets the balance between two generations of products and technologies and brings maximum profit.
We have proposed a method that allows us to reduce the use of the previous generation of technologies and increase the presence of the next one, provided that the maximum total profit is maintained. Since the production of innovative products, as a rule, involves much of the available material resources and uses the same production facilities, this will allow you to optimally restructure the production process. In the service sector or business organization, the application of the proposed methodology will provide maximum economic efficiency for the combined application of both technologies. The result will be the ability to plan investments in innovative technologies and solutions and, most importantly, to remain competitive.
As the main indicator of the effectiveness of the considered approach of innovative actors’ interaction, we propose to take, first of all, the number of implemented innovative projects at the regional, district, and national levels. It is possible to increase the degree of innovative development and diversification of the economy of the Russian Federation thanks to the active and permanent use of new technologies developed at different levels and based on scientific developments of a fundamental nature. To achieve maximum results, it is necessary to select scientific developments that are of interest from the point of view of the possibility of their practical application and contribution to the country's innovative development.
One of the main tasks of any state at the present time is the creation of an innovation ecosystem in its country. For a more effective mutual participation of the main participants in the innovation environment, it is necessary to determine their mutual interests, which represent certain needs that can be successfully satisfied through participation in innovation, and to develop an effective system for modeling this kind of activity. Incentives for innovation are sustainable if actors can create unified communication networks based on specialized platforms and develop triple helix collaboration. Triple spirals are endowed with systems with the property of self-adaptation to any external changes, allowing them to move forward on the basis of self-development without the participation of the governing center.
We would like to show that thanks to the introduction of this methodology within the framework of the innovation actors interaction model, the flow of new knowledge, projects and developments are controlled and carefully processed during the transition from the regional level to the district level, and then from the district to the highest level - the national level, thus at the federal level, there are the most priority and most contributing developments (Figure 7).

Figure 7: Model of Interaction Between the Actors of the Innovation Process.
Such a model of interaction between universities, business structures and the state, based on the integration function of higher schools, is able to bring the economy to a new level of development, increasing the efficiency and effectiveness of all forms of joint cooperation.
The current conditions for innovations development on Russian market are not adequate. The level of interaction between university and other innovation system actors is low, that also slows down innovation. These facts prove the necessity of interaction model development and introduction. An extremely important point, from our point of view, is the effective selection of promising projects within the framework of the interaction model at each level of government, so that the best ideas and technologies reach the federal level and have every chance of implementation and success.
The presented research is aimed at developing an interaction model for universities and other participants in the innovation system, which implements the integration function of the university, ensures the activation of scientific and innovative activities, accelerates the transfer processes and allows to select the most perspective project on all levels of government. The practical significance of the work lies in the possibility of using the authors' developments in the practice of managing the innovation activities of a country to achieve significant results.
In our further research we are going to adjust the proposed methodology for the selection of perspective projects at the university level and calculate the most promising projects for 2021/2022.
Author Contributions
All the authors contributed substantially to the entire work reported. They read and approved the final manuscript.
Conflicts of Interest
The authors declare no conflict of interest.
References
- Anahita, B., Jennifer, R., & Sally, S. (2009). Towards a multidisciplinary definition of innovation. Management Decision. Emerald Group Publishing Limited, 47(8), 1323–1339.
- Antipov, S.K., Bocharov, A.A., Kobicheva, A., & Krasnozhenova, E.E. (2019). Assessment of Region Economic Development on the Basis of Neural Network Model. IOP Conference Series: Earth and Environmental Science, 302(1).
- Ayris, P., López, A., Maes, K., & Labastida, I. (2018). Open science and its role in universities : A roadmap for cultural change. League of European Research Universities, 13.
- Barykin, S., Kalinina, O., Aleksandrov, I., Konnikov, E., Yadikin V., & Draganov, M. (2020). Personnel management digital model based on the social profiles’ analysis. Journal of Open Innovation: Technology, Market, and Complexity, 6(152): 20.
- Barykin, S.Y., Bochkarev, A.A., Kalinina, O.V., & Yadykin, V.K. (2020). Concept for a supply chain digital twin. International Journal of Mathematical, Engineering and Management Sciences, 5(6), 1498– 1515.
- Barykin S.Y, Kapustina I.V, Kirillova T.V, Yadykin V.K, Konnikov Y.A. (2020). Economics of digital ecosystems. Journal of Open Innovation: Technology, Market, and Complexity, 6(124): 16.
- Bedford T et al. (2018). Role of universities of science and technology in innovation ecosystems: Towards Mission 3.1 (CASAER white paper): 32.
- Bogers, M., Ann-Kristin, Z., Afuah, A., Almirall, E., Brunswicker, S., Dahlander, L., … & Wal, A.L.J.T (2017). The open innovation research landscape: established perspectives and emerging themes across different levels of analysis. Industry and Innovation. Routledge, 24(1), 8–40.
- Bogers, M., Chesbrough, H., Heaton, S., & Teece, D.J. (2019). Strategic management of open innovation: A dynamic capabilities perspective. California Management Review, 62(1), 77–94.
- Bogers, M., Chesbrough, H., & Moedas, C. (2018). Open innovation: Research, practices, and policies. California Management Review, 60(2): 5–16.
- Borisoglebskaya, L.N., Provotorov, V.V., Sergeev, S.M., & Kosinov, E.S. (2019). Mathematical aspects of optimal control of transference processes in spatial networks. IOP Conference Series: Materials Science and Engineering, 537(4).
- Borisoglebskaya, L.N., Provotorova, E.N., & Sergeev, S.M. (2019). Commercial software engineering under the digital economy concept. Journal of Physics: Conference Series, 1399(3).
- Borisoglebskaya, L.N., Provotorova, E.N., Sergeev, S.M. (2019). Promotion based on digital interaction algorithm. IOP Conference Series: Materials Science and Engineering, 537(4).
- Borisoglebskaya, L.N., Provotorova, E.N., Sergeev, S.M., & Khudyakov, A.P. (2019). Automated storage and retrieval system for Industry 4.0 concept. IOP Conference Series: Materials Science and Engineering 537(3), 0–6.
- Borisoglebskaya, L.N., Sergeev, S.M., Provotorova, E.N., & Zaslavskiy, A.A. (2020). Digital algorithms for supply chain automation of mechanical engineering production. IOP Conference Series: Materials Science and Engineering, 862(4).
- Carayannis, E.G., Barth, T.D., & Campbell, D.F. (2012). The quintuple helix innovation model: Global warming as a challenge and driver for innovation. Journal of Innovation and Entrepreneurship, 1(1), 2.
- Carayannis, E.G., & Campbell, D.F.J. (2009). ‘Mode 3’ and ‘Quadruple Helix’: Toward a 21st century fractal innovation ecosystem. International Journal of Technology Management, 46(3–4): 201–234.
- Chesbrough, H. (2017). The future of open innovation. Research Technology Management, 60(1), 35–38.
- Chesbrough, H., & Bogers, M. (2014). Explicating open innovation: Clarifying an emerging paradigm for understanding innovation. In new frontiers in open innovation. Oxford University Press: Oxford.
- Christensen, C.M., McDonald, R., Altman, E.J., & Palmer, J.E. (2018). Disruptive innovation: An intellectual history and directions for future research. Journal of Management Studies, 55(7), 1043–1078.
- Conceição, O, Sousa C, Fontes M. (2018). Knowledge bases and variety of networking behaviour among research-based spin-offs. Proceedings of the European Conference on Innovation and Entrepreneurship, ECIE 2018-Septe(September), 208–218.
- Dahlander, L., & Gann, D.M. (2010). How open is innovation? Research Policy 39(6), 699–709.
- Dosi, G. 1982. Technological paradigms and technological trajectories: A suggested interpretation of the determinants and directions of technical change. Research Policy, 11(3), 147–162.
- Enkel, E., Gassmann, O., & Chesbrough, H. (2009). Open R&D and open innovation: Exploring the phenomenon. R&D Management. John Wiley & Sons, Ltd, 39(4), 311–316.
- Etzkowitz, H., & Leydesdorff, L. (2000). The dynamics of innovation: From National Systems and ‘mode 2’ to a Triple Helix of university-industry-government relations. Research Policy, 29(2): 109–123.
- European Commission. (2014). Boosting open innovation and knowledge transfer in the european union. Faems, D. (2008). Open Innovation: Researching a New Paradigm–By H. Chesbrough, W. Vanhaverbeke and
- J. West. Creativity and Innovation Management. John Wiley & Sons, Ltd, 17(4), 334–335.
- Gassmann, O. (2006). Opening up the innovation process: Towards an agenda. R&D Management. John Wiley & Sons, Ltd, 36(3), 223–228.
- Genkin, A.S., & Mikheev, A.A. (2020). Influence of coronavirus crisis on food industry economy. Foods and Raw Materials, 8(2), 204–215.
- Ghobakhloo, M., Fathi, M. (2019). Corporate survival in Industry 4.0 era : The enabling role of lean-digitized manufacturing. Journal of Manufacturing Technology Management. Emerald Group Publishing Limited: School of Engineering Science, University of Skövde, 31(1), 1–30.
- Golosnoy, A.S., Provotorov, V.V., Sergeev, S.M., Raikhelgauz, L.B., & Kravets, O.J. (2019). Software engineering math for network applications. Journal of Physics: Conference Series, 1399(4).
- Kobicheva, A., Baranova, T., & Tokareva, E. (2020). The development of an interaction mechanism between universities and other innovation system actors: Its influence on university innovation activity effectiveness. Journal of Open Innovation: Technology, Market, and Complexity, 6(4), 1–20.
- Kobicheva, A.M., & Bryant, C. (2020). The coordination centre model as a tool for increasing human capital efficiency and commercialization of university innovations. IOP Conference Series: Materials Science and Engineering, 940(1).
- Krasnov, S., Sergeev, S., Zotova, E., & Grashchenko, N. (2019). Algorithm of optimal management for the efficient use of energy resources. E3S Web of Conferences, 110.
- Krasnov, S., Zotova, E., Sergeev, S., Krasnov, A., & Draganov, M. (2019). Stochastic algorithms in multimodal 3PL segment for the digital environment. IOP Conference Series: Materials Science and Engineering, 618(1).
- Leydesdorff, L. (2012). The Triple Helix, Quadruple Helix and an N-Tuple of Helices: Explanatory models for analyzing the knowledge-based economy? Journal of the Knowledge Economy, 3(1), 25–35.
- Leydesdorff, L., Perevodchikov, E., & Uvarov, A. (2015). Measuring triple-helix synergy in the Russian innovation systems at regional, provincial, and national levels. Journal of the Association for Information Science and Technology. John Wiley & Sons, Ltd, 66(6), 1229–1238.
- Mitchell, W., & Singh, K. (1996). Survival of businesses using collaborative relationships to commercialize complex goods. Strategic Management Journal. John Wiley & Sons, Ltd, 17(3), 169–195.
- Murray-Rust P. (2008). Open Data in Science. Nature Precedings.
- Nguyen, D.C., Pathirana, P.N., Ding, M., Seneviratne, A. (2019). Blockchain for 5G and beyond networks: A State of the Art Survey. Journal of Network and Computer Applications. Elsevier Ltd, 166, 1–38.
- Park, H.W. (2014). Transition from the triple helix to n-tuple helices? An interview with Elias G. Carayannis and David F. J. Campbell. Scientometrics, 99(1), 203–207.
- Perkmann M., Tartarik, V., McKelvey, M., Autio, E., Broström, A., D’Ested, P., … & Sobrerof, M., (2013). Academic engagement and commercialisation: A review of the literature on university–industry relations. Research Policy, 42(2), 423–442.
- Perkmann, M., & Walsh, K. (2007). University–industry relationships and open innovation: Towards a research agenda. International Journal of Management Reviews. John Wiley & Sons, Ltd, 9(4), 259– 280.
- Perkmann, M., West, J., Link, A., Siegel, D.S., & Wright, M. (2013). Open science and open innovation: Sourcing Knowledge from Universities. Handbook of University Technology Transfer, 1–41.
- Pilipenko, O.V., Provotorova, E.N., Sergeev, S.M., & Rodionov, O.V. (2019). Automation engineering of adaptive industrial warehouse. Journal of Physics: Conference Series, 1399(4).
- Provotorov V.V., Danilevich D.V., Fedotov A.A, Sergeev S.M, Kravets O.J. (2020). Digital management by supply networks in engineering. IOP Conference Series: Materials Science and Engineering, 862(3).
- Ross, S.S. (2011). Book Review: Cribb, J., & Sari, T. (2010). Open Science: Sharing Knowledge in the Global Century. Collingwood, Victoria, Australia: CSIRO. pp. 221. Science Communication. SAGE Publications Inc, 33(2), 264–266.
- Sergeev, S., Kirillova, T. (2019). Information support for trade with the use of a conversion funnel. IOP Conference Series: Materials Science and Engineering, 666(1).
- Sergeev, S.M., Kurochkina, A.A., Lukina, O.V., Zasenko, V.E. (2020). Interactive algorithm for estimating consumer demand for tourism services for sustainable operation of the transport industry. IOP Conference Series: Materials Science and Engineering, 918(1).
- Smart, P., Holmes, S., Lettice F., Pitts, F.H., Zwiegelaar, J.B., Schwartz, G., & Evans, S., (2019). Open science and open innovation in a socio-political context: knowledge production for societal impact in an age of post-truth populism. R and D Management, 49(3), 279–297.
- Tacke, O. (2010). Open science 2.0: How research and education can benefit from open innovation and web 2.0. Advances in Intelligent and Soft Computing, 76, 37–48.
- UN General Assembly. (2015). UN general assembly, Transforming our world : The 2030 Agenda for Sustainable Development. Resolution adopted by the General Assembly on 25 September 2015 16301(October), 1–35.
- West, J., Salter, A., Vanhaverbeke, W., & Chesbrough, H. (2014). Open innovation: The next decade. Research Policy. Elsevier B.V. 43(5), 805–811.
- Yun, J.J. (2017). Business model design compass. Open Innovation Funnel to Schumpeterian New Combination Business Model Developing Circle. Springer Nature Singapore Pte Ltd. 2017.
- Zhao, X., Xiao, W., Wu, L., Zhao, Z., Huo, J., Wang, S., … & Sun, D. (2020). Intelligent city intelligent medical sharing technology based on internet of things technology. Future Generation Computer Systems 111, 226–233.