Research Article: 2022 Vol: 21 Issue: 5
A Study on Factors Affecting the Adoption of Information and Communication Technology in Rural Areas of India
Rajshree Yadav, School of Management & Business Studies
Reshma Nasreen, School of Management & Business Studies
Asad Ahmad, School of Management & Business Studies
Citation Information: Yadav, R., Nasreen, R., & Ahmad, A., (2022). A study on factors affecting the adoption of information and communication technology in rural areas of India. Academy of Strategic Management Journal, 21(5), 1-10.
Abstract
Objectives: The central issue addressed in this paper is to understand the significant factors affecting rural consumers' Intentions to adopt ICT devices post Covid-19 with the help of the Technology Adoption Model (Modified TAM).
Method: Primary Data of 580 samples (316 male and 264 female) from villages of Rajasthan, Uttar Pradesh, and Haryana were collected using a self-administered questionnaire in regional language, and data was analyzed using EFA (Exploratory factor analysis) and SEM (Structural equation modeling) through SPSS 22.0 and ANOVA 22.0.
Findings: Rural consumers have a moderate attitude toward adopting ICT Devices. Furthermore, the study's findings revealed that perceived ease of use has a significant impact on attitude and Intention to use various ICT devices, whereas perceived usefulness does not significantly influence the attitude of rural consumers.
Novelty: The robustness of modified TAM is studied in Rural Context, and how it can be strengthened is discussed in this paper.
Keywords
Information and Communication Technology (ICT), Attitude toward ICT, Intention to use, ICT devices, Perceived Usefulness, Perceived Ease of Use.
JEL Codes
M37, O33, P25
Introduction
Information and communication technology (ICT) has become an integral element of our professional and personal lives. In August 2014, the Government launched the Digital India program during a meeting headed by Prime Minister Shri Narendra Modi, who aspires to convert the country into a knowledge economy and a digitally empowered society. The Digital India initiative is transformative, ensuring that everyone may access government services via electronic means. This initiative was to be executed in stages, from 2014 to 2018 (PIB, 2014), but there are still a lot of roadblocks to achieving this initiative. One primary reason for this can be attributed to the Digital Divide India faces, with 67% of the urban population using ICT and only 31% of the rural population using ICT in 2020, according to the IAMAI (2020) report Internet and Mobile Association of India. Even though ICT plays an essential role in shaping the way people shop (e-commerce), do banking (digital payments), entertain themselves, and interact with others (social media and communication). Still, despite of these significant benefits offered by ICT's to people, a variety of empirical studies have been conducted in various sectors such as higher education institutions (Abbad et al., 2009; Tømte & Hatlevik, 2011; Alshare et al., 2005; Afshari et al., 2013; Hsu et al., 2009) school-based studies (Hatlevik & Christophersen, 2013; Yuen & Ma, 2002), organisation based studies (Venkatesh & Davis, 2000; Venkatesh et al., 2010) e-government services in developed countries (Horst et al., 2007), on managers (Akour et al., 2006), ICT experts and faculty (Bhuasiri et al., 2012), integrating technology adoption models (Van Biljon & Kotzé, 2007), developed countries (Yang, 2005; Yen et al., 2010; Tømte & Hatlevik, 2011) but very few studies are done in rural areas, especially of developing nations and that too if done are in either education or agriculture sectors or urban areas (Bhuasiri et al., 2012; Moghaddam & Khatoon-Abadi, 2013; Ooi et al., 2011) or in rural areas of developed nations (LaRose et al., 2007; Warren, 2007). After identifying these gaps in the literature, this study was initiated to identify the most favored factor by rural users through a highly recognized Technology acceptance model in IT acceptance behavior.
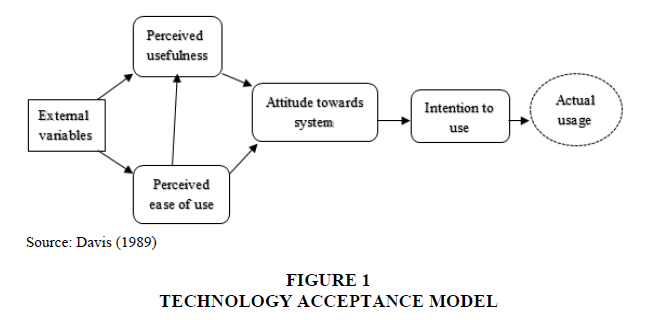
Modified TAM is a modified version of the Theory of Reasoned Action (TRA), a model designed specifically to predict user acceptance of information technology. For this reason, modified TAM is a model built on the user's Intention. In the TRA, one's belief shapes one's attitude leading to intentions, eventually leading to the behavior. The MODIFIED TAM used this belief-attitude-intention-behavior link to model consumers' adoption of Information Technology (Szajna, 1996; Riemenschneider & McKinney, 2002; Benedetto et al., 2003). According to modified TAM, the two most important factors driving IT adoption behavior are Perceived usefulness and perceived ease of use. If PU has an immediate impact on attitude and the Intention to use, then PEOU also impacts attitude and Intention through PU.
In the above model (Figure 1), Perceived ease of use can be defined as the degree to which an individual feels that learning to use technology will require minimal effort, and Perceived usefulness is the amount to which a person thinks that using technology will enhance their performance (Kamaruddeen et al., 2022).
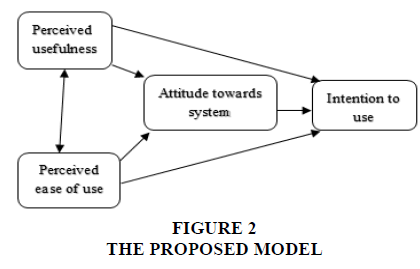
The primary objective of this study is to estimate the robustness of modified TAM in rural contexts by studying the relevance of two factors, PU and PEOU, on attitude and Intention to use Information and communication technology for which the following model is proposed (Figure 2).
Methodology
The type of data used in this study is Quantitative, obtained from Primary sources. The study's data collection took place from July to December 2021. It included participants from rural areas of 3 North-Indian states, namely Haryana, Rajasthan, and Uttar Pradesh. As it was optional for the participants to participate in this study, those who participated were rewarded with small refreshment, and almost everyone who was approached participated in this study. Out of 600 distributed questionnaires, 580 questionnaires were complete and suitable for this study after removing the ones with missing values. The questionnaire was divided into two parts, the 1st part consisted of questions about demographics, and 2nd part consisted of inquiries related to measuring items studied. The things used in this study were Perceived usefulness, Perceived ease of use, Attitude towards the system, and Intention to use, all designed to understand better consumers' views and perspectives on ICT gadgets in rural areas. A 5-point Likert scale was used with emojis expressing five as strongly agree to 1 as strongly disagree, making it more straightforward for respondents to fill up the questionnaire. Table 1 shows an overview of the participants' demographic Information.
| Table 1 Demographic Information Of The Participants |
||
|---|---|---|
| State | Frequency of respondents | Percent (%) |
| Uttar Pradesh | 102 | 17.6 |
| Rajasthan | 176 | 30.3 |
| Haryana | 302 | 52.1 |
| Gender | ||
| Female | 264 | 45.5 |
| Male | 316 | 54.5 |
| Age | ||
| 13-19 | 90 | 15.5 |
| 20-34 | 290 | 50 |
| 35-49 | 142 | 24.5 |
| 50 & above | 58 | 10 |
| Education | ||
| No formal education | 95 | 16.4 |
| Middle school (up to 5th Class) | 126 | 21.7 |
| High school (up to 12th Class) | 150 | 25.9 |
| Graduation | 84 | 14.5 |
| Post-Graduation | 54 | 9.3 |
| Ph. D Holders | 33 | 5.7 |
| Others | 19 | 3.3 |
| Diploma | 19 | 3.3 |
| Occupation | ||
| Agriculture/Self-employed | 173 | 29.8 |
| Business | 34 | 5.9 |
| Service | 85 | 14.7 |
| Student | 149 | 25.7 |
| Homemaker | 110 | 19 |
| Stitching | 7 | 1.2 |
| Shop | 2 | 0.3 |
| Contractual-labour | 5 | 0. 9 |
| Unemployed | 15 | 2.6 |
| Income | ||
| No income | 260 | 44.8 |
| 1000-10000 | 165 | 28.4 |
| 10001-20000 | 73 | 12.6 |
| 20001-30000 | 39 | 6.7 |
| Above 30000 | 43 | 7.4 |
| Device used Mostly | ||
| Smart Phone | 264 | 45.5 |
| Keypad Phone | 134 | 23.1 |
| Tablet /Laptop/PC | 35 | 6 |
| Television | 41 | 7.1 |
| Radio | 20 | 3.4 |
| None of the above | 86 | 14.8 |
| Users | ||
| Smart Phone Users | 299 | 51.6 |
| Keypad Phone Users | 194 | 33.4 |
| Non-Users | 87 | 15 |
The second part consisted of questions regarding the scaler items adapted from the modified TAM model and modified according to the rural people of India (Davis, 1986), which are as follows in Table 2.
| Table 2 Tam Model And Modified According To The Rural People Of India |
|
|---|---|
| Variables | Measurement Items |
| 1.Perceived Usefulness (PU) | Using the device is helpful, in my opinion. Using the device would make it easier to carry out my tasks. Using the device would help me to complete my tasks more quickly. Overall, I think that using the device is advantageous. |
| 2.Perceived ease of use (PEOU) | It is easier for me to use the device. I find my interaction with the device clear & understandable. It is easy for me to become skilful at using the device. Overall, I find the use of this device easy |
| 3.Attitude towards ICT | Using the device is a good idea. Using the device is a wise idea. I like the idea of using the device. Using the device gives a pleasant experience. |
| 4.Intention to use ICT | I plan to use this device in the future too. I will strongly recommend this device to others. I will like to use this device again. I am likely to use this device in the future. |
The study uses a two-stage methodology. In the first stage, a survey was conducted to give loadings for discovered factors, and then measures were refined using Confirmatory factor analysis (CFA). In the second stage, using Structural equation modeling (SEM) techniques, a structural model (Figure 2) was built and estimated. SEM is a statistical method for evaluating hypotheses concerning the correlations between observable and latent variables. Its primary advantage is measuring a model entirely, but it does not examine the relationship between latent variables. Latent variables are the factors or constructs measured by Observed variables, statements, or items. So, its structural model is calculated once a model is verified with the least number of observed variables to estimate the latent variable. A path model is a figure used to represent a structure model.
There are various published studies in which user approval of information technology has long been measured using SEM methods (Afshari et al., 2013; Abbad et al., 2009; Bollen, 1998; Mac Callum et al., 2014; Ooi et al., 2011; Venkatesh et al., 2000; Yen et al., 2010). Therefore, the analysis of the data in this study is done using SEM to test the following hypothesis:
Research Hypothesis
H01: Perceived Usefulness significantly impacts attitude to use ICT
H02: Perceived Usefulness significantly impacts Intention to use
H04: Perceived Ease of Use significantly impacts attitude to use ICT
H05: Perceived Ease of Use significantly impacts Intention to use
H06: Attitude to use ICT significantly impacts Intention to use ICT
Results and Discussion
CFA Model
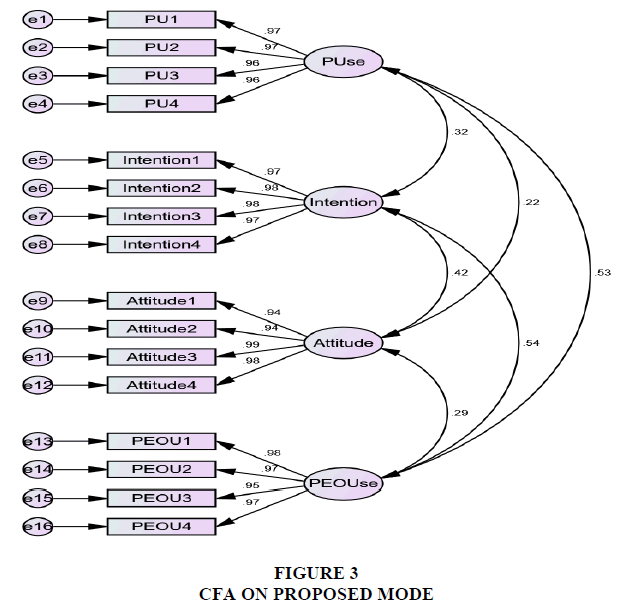
Amos 22 was used to perform CFA to estimate maximum likelihood. As shown in Figure 3. All the items have been considerably loaded on all anticipated factors. The results (CMIN/DF=2.452; AGFI=0.934; NFI=0.988; CFI=0.993; RMSEA=0.050) showed a satisfactory fit (Hair et al., 2014) to the data. Each factor's composite dependability was higher than the permitted level of 0.7. (Table 3) Additionally, AVE values were larger than 0.5 indicating convergent validity for all the constructs (Fornell & Larcker, 1981).
| Table 3 Convergent Validity And Composite Reliability And Discriminant Validity |
||||||||
|---|---|---|---|---|---|---|---|---|
| Factor | AVE | Convergent Validity (AVE>0.5) | CR | Composite Reliability (CR>0.7) | Puse | Intention | Attitude | PEO Use |
| Puse | 0.930 | Yes | 0.982 | Yes | 0.964 | - | - | - |
| Intention | 0.949 | Yes | 0.987 | Yes | 0.326*** | 0.974 | - | - |
| Attitude | 0.924 | Yes | 0.980 | Yes | 0.213*** | 0.404*** | 0.961 | - |
| PEOUse | 0.931 | Yes | 0.982 | Yes | 0.531*** | 0.549*** | 0.284*** | 0.965 |
Source: Authors compilation
Note: p<0.100, *p<0.050, **p<0.010, ***p<0.001 (Significance of Correlations)
For discriminant validity, square root of AVE> inter-construct correlation, in Table 3, it can be inferred that the diagonal values 0.94, 0.974, 0.961, and 0.965 representing AVE are all greater than the * marked values representing inter-construct correlations, so the model achieves discriminant validity (Gaskin & Lim, 2016).
Validating that a model accomplishes its intended goal is known as model validation. It includes confirming that the model is predictive in its intended use (Hu & Bentler, 1999). For example, no validity concerns were found in the above-proposed model.
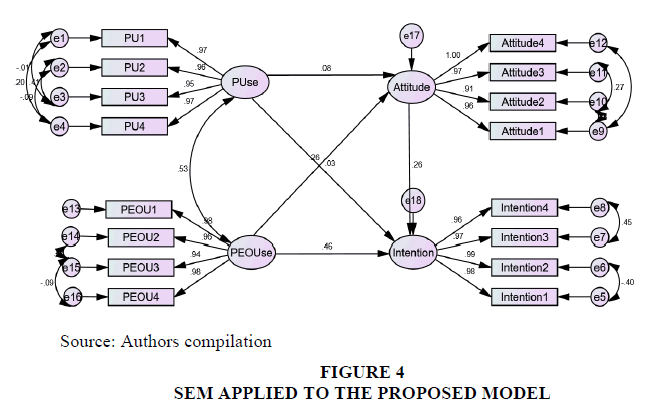
The Proposed model was further verified for model fit, and the outcomes of the tests are shown in Table 4 and Table 5, all the observed values fulfil the benchmark set by previous authors, and hence the model is accepted. The complete results of this model are depicted in Figure 4.
| Table 4 Measurement Model Fit Indices (Sem) |
||
|---|---|---|
| Fit Index | Observed Values | Recommended Values* |
| Chi-square/df | 2.389 | <3.0 |
| AGFI | 0.935 | >0.90 |
| NFI | 0.988 | >0.90 |
| CFI | 0.993 | >0.90 |
| RMSEA | 0.049 | <0.070 |
Note: The asterisk (*) denotes the recommended value's.
Source: Hu & Bentler (1999).
| Table 5 Standardized Regression Weights (Sem) |
|||
|---|---|---|---|
| Estimates | p-value | ||
| Attitude | ←PUse | 0.105 | 0.084 |
| Attitude | ←PEOUse | 0.262 | 0.000 |
| Intention | ←PEOUse | 0.461 | 0.000 |
| Intention | ←PUse | 0.034 | 0.519 |
| Intention | ←Attitude | 0.265 | 0.000 |
Source: Authors compilation
The significant findings are that Perceived Usefulness is insignificantly related to both attitudes toward ICT and Intention to use ICT devices. In contrast, Perceived Ease of use is significantly associated with both attitudes toward using ICT devices and Intention to use ICT devices.
As per previous studies, it has been found that Perceived Usefulness plays an essential role in the Intention of consumers to adopt information technology (Davis, 1986; Yu et al., 2018; Nadlifatin et al., 2020). However, as in business organizations or educational institutions, users must use IT devices. Therefore, perceived ease of use is an insignificant factor in adopting of these technologies. Whereas in this study, the rural consumers emphasized perceived ease of use as they are new to these devices and hence find using a new device difficult. Therefore, Government and policymakers should make these devices easy to use to achieve the dream of digital India.
Conclusion
This study explored the usefulness of modified TAM in rural areas of developing countries like India and identified the significant factors influencing the adoption of ICT in three different villages, namely Haryana, Rajasthan, and Uttar Pradesh. Estimates from the CFA solution based on EFA output were adequate. The resulting measurement model's model validity measures were satisfactory. The most influential factor was Perceived ease of use, whereas the least significant factor was Perceived Usefulness. This study validated a prevalent and widely used technology adoption model for assessing the rural consumer's Intention to adopt ICT devices and found that this model is not as robust in rural context as it is in Urban Context. SEM made it easy to identify the essential factor determining the Intention toward ICT adoption of rural people. The above-researched model may be used as a model by strategic managers in sales and marketing businesses to enhance rural consumers' perceptions of ICT. Perceived ease of use must be prioritized to support India's Digital India dream because this is the significant challenge rural people are facing in adopting a new device, as there is no one to teach them how to use it. Therefore, it has become the primary reason for the growing digital divide between rural and urban areas. Accordingly, marketing managers should design some user-friendly devices or advertisements to make it easy for rural people to understand the use of ICT devices. Like Google makes ads that no matter which language one speaks, one can still search for any information online by just speaking into the device. So, such advertisement strategies can make rural people aware of the easefulness of the device and will help in bridging the rural-urban divide.
References
Abbad, M.M., Morris, D., & De Nahlik, C. (2009). Looking under the bonnet: Factors affecting student adoption of e-learning systems in Jordan.International Review of Research in Open and Distributed Learning,10(2).
Indexed at, Google Scholar, Cross Ref
Afshari, M., Ghavifekr, S., Siraj, S., & Jing, D. (2013). Students’ attitudes towards computer-assisted language learning.Procedia-Social and Behavioral Sciences,103, 852-859.
Indexed at, Google Scholar, Cross Ref
Akour, I., Alshare, K., Miller, D., & Dwairi, M. (2006). An exploratory analysis of culture, perceived ease of use, perceived usefulness, and internet acceptance: The case of Jordan. Journal of Internet Commerce, 5(3), 83-108.
Indexed at, Google Scholar, Cross Ref
Alshare, K., Grandon, E., & Miller, D. (2005). Internet usage in the academic environment: the technology acceptance model perspective.Academy of Educational Leadership Journal,9(2), 81-97.
Benedetto, C.A., Calantone, R.J., & Zhang, C. (2003). International technology transfer: Model and exploratory study in the People's Republic of China. International Marketing Review, 20(4), 446-462.
Indexed at, Google Scholar, Cross Ref
Bhuasiri, W., Xaymoungkhoun, O., Zo, H., Rho, J.J., & Ciganek, A.P. (2012). Critical success factors for e-learning in developing countries: A comparative analysis between ICT experts and faculty. Computers & Education, 58(2), 843-855.
Indexed at, Google Scholar, Cross Ref
Bollen, P. (1998). Structural equations with latent variables. New York: Wiley.
Davis, F.D. (1986). A technology acceptance model for empirically testing new end-user information systems: Theory and results. Doctoral dissertation, Sloan School of Management, Massachusetts Institute of Technology.
Davis, F.D. (1989). Perceived usefulness, perceived ease of use, and user acceptance of information technology. MIS Quarterly, 13(3), 319-340.
Fornell, C., & Larcker, D.F. (1981). Evaluating structural equation models with unobservable variables and measurement error.Journal of Marketing Research,18(1), 39-50.
Indexed at, Google Scholar, Cross Ref
Gaskin, J., & Lim, J. (2016). Master validity tool.AMOS Plugin In: Gaskination’s StatWiki.
Hair, J.F., Gabriel, M., & Patel, V. (2014). AMOS covariance-based structural equation modeling (CB-SEM): Guidelines on its application as a marketing research tool.Brazilian Journal of Marketing,13(2).
Hatlevik, O.E., & Christophersen, K.A. (2013). Digital competence at the beginning of upper secondary school: Identifying factors explaining digital inclusion.Computers & Education,63, 240-247.
Indexed at, Google Scholar, Cross Ref
Horst, M., Kuttschreuter, M., & Gutteling, J.M. (2007). Perceived usefulness, personal experiences, risk perception and trust as determinants of adoption of e-government services in The Netherlands.Computers in Human Behavior,23(4), 1838-1852.
Indexed at, Google Scholar, Cross Ref
Hsu, M.K., Wang, S.W., & Chiu, K.K. (2009). Computer attitude, statistics anxiety and self-efficacy on statistical software adoption behavior: An empirical study of online MBA learners. Computers in human behavior, 25(2), 412-420.
Indexed at, Google Scholar, Cross Ref
Hu, L.T., & Bentler, P.M. (1999). Cutoff criteria for fit indexes in covariance structure analysis: Conventional criteria versus new alternatives.Structural Equation Modeling: A Multidisciplinary Journal,6(1), 1-55.
IAMAI. (2020). The Internet and Mobile Association of India (IAMAI).
Kamaruddeen, A.M., Rui, L.S., Lee, K.L., Alzoubi, H.M., & Alshurideh, M.T. (2022). Determinants of emerging technology adoption for safety among construction businesses. Academy of Strategic Management Journal, 21(S4), 1- 19.
LaRose, R., Gregg, J. L., Strover, S., Straubhaar, J., & Carpenter, S. (2007). Closing the rural broadband gap: Promoting adoption of the Internet in rural America.Telecommunications Policy,31(6-7), 359-373.
Mac Callum, K., & Jeffrey, L. (2014). Comparing the role of ICT literacy and anxiety in the adoption of mobile learning.Computers in Human Behavior,39, 8-19.
Indexed at, Google Scholar, Cross Ref
Moghaddam, B.K., & Khatoon-Abadi, A. (2013). Factors affecting ICT adoption among rural users: A case study of ICT Center in Iran.Telecommunications Policy,37(11), 1083-1094.
Indexed at, Google Scholar, Cross Ref
Nadlifatin, R., Miraja, B., Persada, S., Belgiawan, P., Redi, A.A.N., & Lin, S.C. (2020). The measurement of University students’ intention to use blended learning system through technology acceptance model (TAM) and theory of planned behavior (TPB) at developed and developing regions: Lessons learned from Taiwan and Indonesia.International Journal of Emerging Technologies in Learnin,15(9), 219-230.
Ooi, K.B., Sim, J.J., Yew, K.T., & Lin, B. (2011). Exploring factors influencing consumers’ behavioral intention to adopt broadband in Malaysia.Computers in Human Behavior,27(3), 1168-1178.
Indexed at, Google Scholar, Cross Ref
PIB. (2014). Press information Bureau, Government of India.
Riemenschneider, C.K., & McKinney, V.R. (2002). Assessing belief differences in small business adopters and non-adopters of web-based e-commerce.Journal of Computer Information Systems,42(2), 101-107.
Szajna, B. (1996). Empirical evaluation of the revised technology acceptance model.Management Science,42(1), 85-92.
Indexed at, Google Scholar, Cross Ref
Tømte, C., & Hatlevik, O.E. (2011). Gender-differences in self-efficacy ICT related to various ICT-user profiles in Finland and Norway. How do self-efficacy, gender and ICT-user profiles relate to findings from PISA 2006.Computers & Education,57(1), 1416-1424.
Indexed at, Google Scholar, Cross Ref
Van Biljon, J., & Kotzé, P. (2007). Modelling the factors that influence mobile phone adoption. InProceedings of the 2007 annual research conference of the South African institute of computer scientists and information technologists on IT research in developing countries(pp. 152-161).
Indexed at, Google Scholar, Cross Ref
Venkatesh, V., & Davis, F.D. (2000). A theoretical extension of the technology acceptance model: Four longitudinal field studies.Management Science,46(2), 186-204.
Venkatesh, V., Bala, H., & Sykes, T.A. (2010). Impacts of information and communication technology implementations on employees' jobs in service organizations in India: a multi?method longitudinal field study.Production and Operations Management,19(5), 591-613.
Venkatesh, V., Morris, M.G., & Ackerman, P.L. (2000). A longitudinal field investigation of gender differences in individual technology adoption decision-making processes.Organizational Behavior and Human Decision Processes,83(1), 33-60.
Indexed at, Google Scholar, Cross Ref
Warren, M. (2007). The digital vicious cycle: Links between social disadvantage and digital exclusion in rural areas.Telecommunications Policy,31(6-7), 374-388.
Indexed at, Google Scholar, Cross Ref
Yang, K.C. (2005). Exploring factors affecting the adoption of mobile commerce in Singapore.Telematics and informatics,22(3), 257-277.
Indexed at, Google Scholar, Cross Ref
Yen, D.C., Wu, C.S., Cheng, F.F., & Huang, Y.W. (2010). Determinants of users’ intention to adopt wireless technology: An empirical study by integrating TTF with TAM.Computers in Human Behavior,26(5), 906-915.
Indexed at, Google Scholar, Cross Ref
Yu, Y., Yi, W., Feng, Y., & Liu, J. (2018). Understanding the intention to use commercial bike-sharing systems: An integration of TAM and TPB. InProceedings of the 51st Hawaii International Conference on System Sciences.
Yuen, A.H., & Ma, W.W. (2002). Gender differences in teacher computer acceptance.Journal of Technology and Teacher Education,10(3), 365-382.
Received: 26-Apr-2022, Manuscript No. ASMJ-22-11894; Editor assigned: 28-Apr-2022, PreQC No. ASMJ-22-11894(PQ); Reviewed: 06-May-2022, QC No. ASMJ-22-11894; Published: 13-May-2022


