Research Article: 2017 Vol: 21 Issue: 1
An Application of Linear Programming In Performance Evaluation
Livinus U Uko, Georgia Gwinnett College
Robert J Lutz, Georgia Gwinnett College
James A Weisel, Georgia Gwinnett College
Keywords
Linear Programming, Evaluation Processes, Smart pdf Form.
Introduction
Assessing performance of employees is an important process for achieving excellence. Performance evaluations serve as a basis for many key decisions such as compensation, promotion and employee development. Organizations that lack effective evaluation systems may experience higher rates of employee dissatisfaction, attrition and lowered productivity. Universities and colleges, like other organizations, are expected to develop effective systems for evaluating faculty performance. There are some unique challenges to evaluating faculty performance because of the wide-ranging activities in which faculty regularly engage. Never the less, a consensus has emerged on the need to establish valid and reliable systems of assessing faculty performance (Wolfer & Johnson, 2003).
The distribution of responsibilities and allocation of effort to various components of responsibility such as teaching, research and service affects the ability to perform in each of these components (Ridley & Collins, 2015). It is therefore necessary to present a complete measure of performance while recognizing the relative importance of these various components. Systems of faculty evaluation and reward should recognize differing patterns of productivity in faculty as well as the mission of the institution (Boyer, 1990).
Elmore (2008) suggests that assessment of faculty work should be based on the most empirical and objective means possible. Miller & Seldin (2014) show that academic administrators are under growing pressure to assess faculty performance through formalized, systematic methods and that deans weigh a wide range of factors in the evaluation process. Practices of assigning difference weights to different roles vary widely among institutions and are influenced by numerous institutional characteristics (Centra, 1977).
In many performance evaluation processes, a supervisor assigns scores, subject to a predefined scale, for specified areas of responsibility. An overall score is determined by weighting the scores from the individual areas such that the weights account for 100% of the total effort. For example, a Department Chair assigns scores on a 0.0-4.0 scale to assess a faculty member’s teaching effectiveness, student engagement, scholarship and service. These scores are then weighted, based on the level of importance attached to each area, to obtain an overall evaluation score. In many cases, the faculty has some degree of flexibility in choosing the weights assigned to their areas of responsibility.
Caldwell Jr. & Schulte (2002) describe results of their survey showing various indicators of faculty dissatisfaction with the evaluation process. Indicators of dissatisfaction included uncertainty of specific responsibilities, difficulty in preparing for promotion and tenure because of a lack of consistency in performance evaluations and a lack of standards for various aspects of their responsibilities. Allowing faculty to choose their own weights, within predefined ranges, gives them more freedom and control and should lead to greater satisfaction with the evaluation process. Arreola (2006) recommends the use of such a dynamic faculty role model rather than a static faculty role model.
Linear Programming (also called Linear Optimization or LP) is the study of methods to achieve an optimal outcome in a linear mathematical model. It uses mathematical techniques to find an optimal value for a linear objective function, subject to linear equality and/or inequality constraints. It was originally developed during the Second World War, mainly by George Dantzig, to optimize the use of limited (i.e., constrained) military resources. A historical treatment of the subject can be found in Lenstra, Kan & Schrijver (1991). However, it has since been extended to a wide variety of business, engineering and scientific applications (Charnes & Cooper, 1961; Gärtner & Matoušek, 2006; Dantzig &Thapa, 1997). In this paper, we propose an application of the technique to the faculty performance evaluation process.
The Scenario
At Georgia Gwinnett College, the faculty has some degree of flexibility in choosing the area evaluation weights, within predetermined intervals, at the time they submit their end-of-year evaluation portfolios. Some schools within the college have experimented with situations in which faculty members assign their area evaluation weights at the beginning of the academic year. However, the rigidity of this process tended to create problems for the faculty. For instance, a faculty member might assign higher weights to the areas of scholarship and student engagement and lower weights to teaching and service at the beginning of the year, in anticipation of the achievement of higher outcomes in the first two areas and lower outcomes in the second two during the year. However, as is often the case, the faculty member may obtain better outcomes in the lesser-weighted areas and then end up with a low overall evaluation score, caused by the rigid pre-assigned unfavourable weights. This led to dissatisfaction and contributed to the abandonment of the practice.
Since faculty desire high evaluation scores, they tend to select their weights, while preparing their end-of-year evaluation portfolios, based on their perceptions of how well they performed in each evaluated area. For instance, a faculty member who feels that he or she performed well in the areas of scholarship and student engagement, but not so well in teaching and in service, would typically assign higher weights for the first two roles and lower weights to the second two. However, if the supervisor’s review of the faculty member’s areas of strength and weakness differ from the faculty member’s perception-as is often the case-the weights selected by the faculty member end up yielding an unfavourable overall evaluation score. Even in the case that the faculty member’s self-assessment of areas of strength and weakness coincides with the assessment arrived at by the supervisor, it is virtually impossible for a faculty member to choose the right mix of weights that will lead to an optimal evaluation score.
This often leads to situations where faculty members play a numbers game, which creates doubts about the validity of evaluation process. Suppose, for instance, that a college assigns the following intervals, as shown in Table 1, for the weights of the four evaluated roles that we have been considering.
| Table 1 Weights of the Four Evaluated Roles |
||
| Role | Minimum Weight | Maximum Weight |
| Teaching | 45% | 60% |
| Student Engagement | 15% | 30% |
| Scholarship | 10% | 30% |
| Service | 10% | 30% |
Suppose that two fictitious faculty members, professors A and B selected their role weights within these intervals shown in Table 2 below.
| Table 2 Weight Intervals of Professor A and B |
||
| Role | Professor A Role Weights | Professor B Role Weights |
| Teaching | 60% | 45% |
| Student Engagement | 15% | 15% |
| Scholarship | 12% | 10% |
| Service | 13% | 30% |
Additionally, suppose that the supervisor assigns both professors the following identical performance scores, on a scale of 0.0-4.0, shown in Table 3.
| Table 3 Identical Performance Scores of A and B |
|
| Role | Score |
| Teaching | 4.0 |
| Student Engagement | 3.6 |
| Scholarship | 3.0 |
| Service | 3.0 |
Professor A’s overall evaluation score is (4.0 × 0.60) + (3.6 × 0.15) + (3.0 × 0.12) + (3.0 × 0.13)=3.69. However, Professor B’s overall score is (4.0 × 0.45) + (3.6 × 0.15) + (3.0 × 0.10) + (3.0 × 0.30)=3.54, which is considerably different from Professor A’s score. Several questions arise immediately. How fair is this process? Is this process really rewarding performance-which appears to have been identical for the two fictitious employees or is it rewarding their ability to choose favourable weights?
To resolve these problems, we have proposed, in our College, a modified evaluation process in which faculty do not choose their own weights, but instead, have optimal weights assigned automatically via Linear Programming in such a way that these weights fit within the assigned limits and maximize the overall performance score corresponding to their supervisor-assigned scores in each of the evaluated roles. The process identifies automatically the areas in which faculty members were most productive and rewards them in the most efficient possible way in those areas. It levels the playing field, by always assigning identical evaluation scores to any two faculty members that get identical performance scores and by assigning an evaluation score that does not depend on a match between the faculty member’s prior self-assessment and the supervisor’s assessment.
We implemented our idea by designing a fillable pdf file for supervisors at Georgia Gwinnett College in which the scripts for the calculation of optimal weights are incorporated automatically using a relatively small number of lines of code, based on an explicit LP solution formula that we derived, as described in the appendix. LP codes are usually quite long and are typically implemented in expensive commercial software. We believe that our smart form is the first instance in which an LP code has been successfully embedded in a smart fillable pdf form. Figure 1 shows the annotated evaluation summary illustrating the process flow of the smart form with fictitious data.
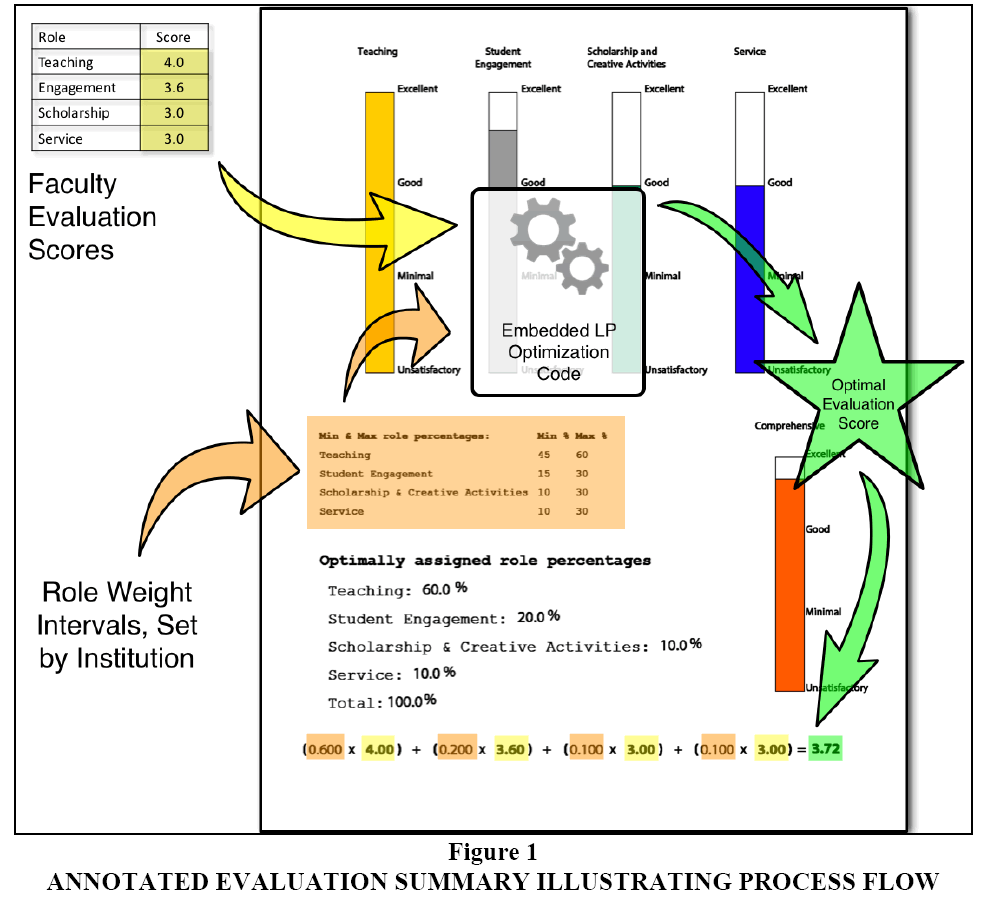
Figure 1: Annotated Evaluation Summary Illustrating Process Flow
After reading the relevant portfolio and/or having a face-to-face meeting, a supervisor enters role scores for a faculty member into the smart form. The form then generates optimal weights for the evaluated roles, within the pre-assigned limits and uses them to calculate composite overall scores and display bar charts of employees’ role scores and overall composite scores.
Our form was considered by the Georgia Gwinnett College Faculty Senate in the spring of 2017 and given an overwhelming endorsement. This gives credence to the supposition that the adoption of the method may lead to improved faculty satisfaction with the evaluation process.
Application of the Lp Model
The algorithm (see the Appendix) finds the explicit solution of the following LP problem:
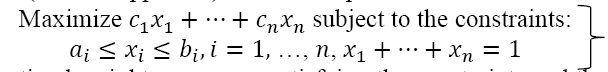
It finds the optimal weights  satisfying the constraints and the optimal objective satisfying the constraints and the optimal objective function score
 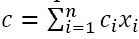 corresponding to the pre-assigned ‘scores’
  Although we consider four roles for purposes of this paper, the model can be used to design a smart form for the evaluation of employees in n evaluated areas R1, ...,Rn .
Conclusion
At our institution, faculty members are evaluated on four roles annually, namely Teaching, Student Engagement, Scholarship and Creative Activities and Service. The performance evaluation process that we proposed in this paper assigns to each employee the optimal weights that are compatible with their supervisor-assigned scores in each role. We implemented our idea by designing a fillable pdf file for supervisors in which scripts for the calculation of optimal weights are incorporated automatically using a relatively small number of lines of code, based on the LP explicit solution formula derived previously. After reading employees portfolios and/or having face-to-face meetings, supervisors enter role scores for employees into the smart form. The form then generates optimal weights and uses these to calculate composite overall scores and display bar charts of employees’ role scores and overall composite scores.
Because of this, overall evaluation scores depend on employees’ performance alone rather than their ability or luck in choosing ideal role weights. We believe that this modified process levels the playing field and will lead to improved satisfaction with the annual performance review process.
It is also quite easy to implement the proposed evaluation process in a smart EXCEL® performance evaluation form or simply within an executable form on a web page. However, we preferred a portable document format (pdf) implementation because it is easier to use a pdf form in a standalone manner. It is very easy to extract data from and provide automation within a pdf form and the resulting weights and scores are automatically entered into the employee’s record.
Modified versions of our smart form can be used to provide cost-effective autonomous solutions in a wide variety of modelling situations. Suppose for instance that a company wishes to assign different fractional totals of a product to n retail outlets R1, ...,Rn, respectively, in such a way that 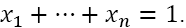 If the minimum and maximum capacity of the retail outlet Ri for this product is specified by an inequality of the form ai≤bi and ci is the profit earned by selling one unit of the product at the outlet Ri, then our algorithm provides optimal values for the allocation of the quantities x1, ...,xn . More elaborate examples of resource allocation problems can be found, for example, in King (1989).
Appendix
Formulation, Solution and Implementation of the Linear Programming Model
We suppose that each employee is evaluated on the roles R1, ...,Rn and that x1, ...xn, respectively, are the weights assigned to them. Suppose that company policy stipulates that the weights must satisfy the constraints
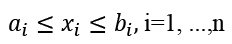
and the equation
If are c1, ...,cn the respective scores that the supervisor assigns to the employee on these roles, then the Linear Programming (LP) problem corresponding to an optimized weight assignment process is as follows:

Given concrete values of the input variables n,  this LP problem with can be solved with EXCEL or any of the other large number of available LP software. However, since it has relatively few constraints, we will be able to solve it explicitly. Since
 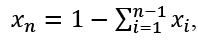 the LP problem can be written in the equivalent reduced LP form:
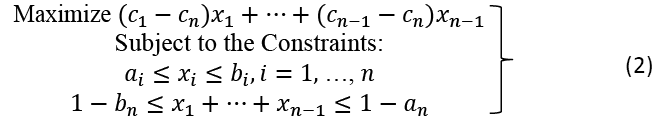
We first observe that if  then the LP problem (1) and the reduced LP problem (2) have no feasible solutions and it is impossible for any employee to select weights as required by the administration. Therefore, we assume, in all that follows, that the following feasibility condition holds:

For simplicity, we will also assume that

This can be enforced, in practice, by sorting the sequence c1, ...,cn as the first step in the solution implementation algorithm. Since the coefficients of the linear objective function (2) in the reduced LP problem are all positive and non-increasing, we can obtain an optimal solution by simply choosing the maximum possible xi values within the feasible region  starting at xn-1 and working our way down to x1.
Let  Then, it follows from the feasibility condition (1) that
  If the extra condition
  also holds, then X(n) is an optimal solution to the reduced LP problem.
Suppose that X(m+1) and sm have been defined and that sm > 1-an. Then we define the subsequent lower terms  and sm-1 by induction in the form
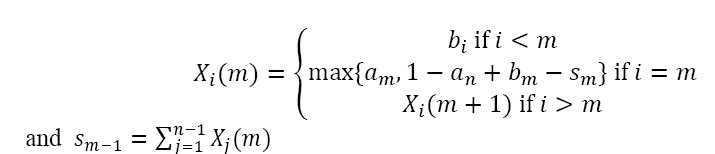
It follows from these definitions that the condition 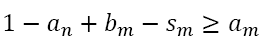 holds if and only if
  The condition
The conditions  for
for  feasibility condition (1). It follows that there must exist a largest index value p such that
  Since the condition
 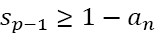 always holds, we see that
 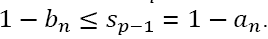 This implies that X() is an optimal solution to the reduced LP problem. On setting
  we obtain the explicit solution
  to the initial LP problem.
References
- Arreola, R.A. (2006). Developing a comprehensive faculty evaluation system: A guide to designing, building and operating large-scale faculty evaluation systems, 3e. Jossey-Bass, San Francisco, CA.
- Boyer, E.L. (1990). Scholarship reconsidered: Priorities of the professorate. Princeton, NJ: The Carnegie Foundation for the Advancement of Teaching.
- Caldwell, R.W. & Schulte, M. (2002). Developing and implementing faculty performance evaluation: A collaborative model. The International Business & Economics Research Journal, 1(9), 1-8.
- Charnes, A. & Cooper, W.W. (1961). Management models and industrial applications of linear programming. 1 & II, J. Wiley.
- Centra, J.A. (1977). How universities evaluate faculty performance: A survey of department heads. Graduate Record Examinations Board Research Report No. 75-5bR.
- Dantzig, G.B. & Thapa, M.N. (1997). Linear programming 1: Introduction. Springer-Verlag.
- Elmore, H.W. (2008). Toward objectivity in faculty evaluation. Academe, 94(3).
- Gärtner, B. & Matoušek, J. (2006). Understanding and using linear programming. Berlin: Springer.
- King, J.H. (1989). Allocation of scarce resources in manufacturing facilities. AT&T Technical Journal, 68(3), 103-113.
- Lenstra, J.K., Rinnooy Kan, A.H.G. & Schrijver, A. (1991). History of mathematical programming: A collection of personal reminiscences. North-Holland, Amsterdam.
- Miller, J.E. & Seldin, P. (2014). Changing practices in faculty evaluation: Can better evaluation make a difference. Academe, 100(3).
- Ridley, D. & Collins, J. (2015). A suggested evaluation metric instrument for faculty members at colleges and universities. International Journal of Education Research, 10(1), 97-114.
- Wolfer, T.A. & Johnson, M.M. (2003). Re-evaluating student evaluation of teaching: The teaching evaluation form. Journal of Social Work Education, 39, 111-121.