Letter to the Editor: 2018 Vol: 17 Issue: 6
An Empirical Study of Leadership Styles in the UAE Human Resource Strategy
Damodharan Varadarajan Sowmya, Dubai Women’s College
Anil Chandrasekaran, Dubai Women’s College
Louise Patterson, Dubai Women’s College
Abstract
Introduction: This study focuses on eliciting the leadership styles used in the decisionmaking process against various organizational levels across different organizational types and the influence of the position, age, experience, department, education under differing situations among the employed people of UAE. Initially, the authors believed that participant’s traits such as age, education would have the major impact rather than position-based experience, industry, and different situations on the leadership styles expressed. However, a deeper analysis and study of the data gathered from various organizations, the results were surprisingly different.
Aim: The analysis of the study revealed how the participant’s position, qualifications, experienced and industry affected the leadership styles. Some very interesting questions and situations have been attempted to understand the leadership style in this report based on a standard leadership style survey. This paper aims to report the findings of an empirical study exploring the relationship between three prominent models of leadership styles using the independent variables. Further, a Neural Network analysis methods and identify the most prominent influencer of the choice probability of leadership style. The independent variable which relates to the demographic and work-related includes factor such as age, gender, level of education, industry type, levels of management, total work experience, experience in the organization.
Methodology: The study is an empirical study based on leadership questionnaire survey using multivariate analysis followed by neural network estimation on the data collected from employees across various levels of management in the UAE. Multifactor Leadership Questionnaire developed and administered as a means of objective assessment of the leadership style of various managers across the UAE followed by the categorizing of scores to identify prominent/explicit styles and dormant styles that were then analyzed based on modeling.
Findings: The results reveal that the spectrum of three leadership styles containing basic characteristics, such as the type of branches, the age, and educational level are inter-related with communication, commitment, satisfaction, and effectiveness. The authors conclude that the unique setting and context found in the public sector-very much defined by the UAE Constitution-leads to subtle, but very real and noteworthy differences. The current literature around the world show that the private sector is more efficient than the public sector based on the various analyses. However, our research analyses gives a different picture for the UAE. The results shows that in the UAE the public sector is more effective and efficient than the private sector because of the leadership styles followed in this sector.
Research Limitations/Implications: Limitations include the self-report methodology that measures perceptual data with a series of questionnaire items. The survey responses that were Academy of Strategic Management Journal Volume 17, Issue 6, 2018 2 1939-6104-17-6-285 complete for analysis were more skewed towards the public sector as the other sectors did not respond well.
Originality/Value: The paper is original research that identifies the characteristics of an organization linked to selected demographic (personal and professional) variables of all level of managers on their managerial style in the UAE.
Keywords
Managers, Leadership Style, UAE, FAHR and Neural Analysis.
Introduction
“It is my duty as the leader of the young people of this country to encourage them to work and to exert themselves to raise their standards and to be of service to the country. The individual who is healthy and of a sound mind and body but who does not work commits a crime against himself and society” His Highness Zayed bin Sultan Al Nahyan.
During the nearly forty-six years of its existence, the United Arab Emriates (UAE) has achieved notable successes. In a larger measure, these successes are attributable to the countries leadership and their leadership styles. Leadership in the UAE revolves around its constitution and the rulers of the seven constituent emirates. Each of the seven rulers’ leadership styles has played a vital role in the success of the country. Since its founding, one man stands out as having provided an unusual degree of leadership style which has been the driving force in all major aspects of the country life in the first three decades, and it is the Abu Dhabi ruler and UAE president Sheikh Zayed bin Sultan Al Nahyan. The creation of the union, growth, and development of the UAE was possible because of the visionary leadership style of His Highness, the father of the nation, Sheikh Zayed (Ziyad, 1982).
As per the FAHR (Federal Authority for Government Human Resources), one of the important values in their mission statement is to develop leadership excellence among employees in Federal Government institutions in the UAE. The FAHR aims to develop leadership skills of people in the UAE in the field of entrepreneurship, innovation, excellence, and quality as well as set policies and laws to improve the quality of services and achieve leadership in all the aspects of the work system (Federal Decree Law No. 11, 2008).
This study is to examine the three different leadership styles in the UAE across various organizations as well as to find out the relationship with relates to the position, age, experience, department, education and various situations. Initially, the authors believed that participant’s position, industry, age and different situations would have no effect on the leadership styles employed in a study, and our target was to find the best leadership style. Upon a deeper analysis of the data gathered from various organizations, the results were surprisingly different.
The recent research conducted in the US (Ferguson et al., 2017) revealed an interesting picture about the data which provides rich insights into the similarities, differences, and critical nuances of public versus private sector leadership. The paper is aimed to address the gap in the literature by concentrating on both private and public sectors in the UAE. It focuses on their leadersship styles, challenges and prioritizes them in parallel for the most part.
The analysis of the study revealed how the participant’s position, qualifications, experience and industry affected the leadership styles. Some very interesting questions and situations have gathered in this report based on leadership style survey. This paper aims to report the findings of an empirical study exploring the relationship between three prominent models of leadership styles using the independent variables Neural Network analysis methods and identify the most prominent influencer of the choice probability of leadership style. The independent variable which relates to the demographic and work-related includes factor such as age, gender, level of education, industry type, levels of management, total work experience, experience in the organization.
The rapid development and changes that have occurred in the UAE in the past four decades are possible due to the qualities and charisma of leadership styles and their decision making (Davidson, 2005). Besides, limited research has been conducted on leadership styles in the UAE context, though it has cited as effective and successful by mouth; it has not studied explicitly. Hence, there are conceptual, empirical and theoretical gaps in understanding the nature of leadership styles and their decision making in the UAE this research will address those gaps.
Background
The Growth of UAE
Few countries in history have experienced, in less than four decades, a huge shift in income and development comparable to that of the United Arab Emirates (UAE) during the last part of the twentieth century (UAE Ministry of Economy, 2018). The UAE developed a public national educational system in a 45-year period that is like what Western countries established in over a 100-year period. Since the early 1970s, the UAE emerged from relative obscurity in global affairs to become one of the wealthiest and most dynamic countries in the world (MENA Report, 2018).
The UAE is the second largest Gulf Arab economy, and among the fastest-growing economies in the world. Throughout the past 40 years, its GDP grew rapidly, increasing from Dh6.5bn in 1971 to approximately Dh1248bn in 2011, an increase of 192 times. (International Monetary Fund, 2013), The GDP growth rate of the UAE over the past years reached record numbers exceeding those of many developed and emerging countries when the rate of growth over the past five years accounted for 34 percent. (Emirates, 2011). The per capita GDP also increased from the US $10,000 in 1975 to the US $37,622 in 2016 (Annual Economic Report, 2017).
Local and international reports indicate that the steady economic growth the country over the past four decades years is not attributed to energy production and export, as is the case with many of the oil economies. But due to a strategy of diversifying sources of income, and reduction of oil-reliance for the favor of other sectors, such as finanlcial services, logistics, tourism and trade and industry, where the country was able to strike record highs in these sectors and even become a competitor to many economies (Shihab, 2001).
The industry sector in the UAE witnessed remarkable development during the past years regarding the number of establishments, the size of investments and the number of employees. There has also been a significant evolution in the quality of national industrial products which increased their competitiveness edge in domestic and global markets (Emirates, 2011). Since the discovery of oil in the UAE more than 45 years ago, the UAE has undergone a profound transformation from an impoverished region of small desert principalities to a modern state with a high standard of living (Forbes, 2017). Most of the recent developments in the last 40 years are mostly attributed to the late leader His Highness Zayed bin Sultan Al Nahyan, who is still revered for his vision and charismatic leadership style.
Brief of the Leadership Style of His Highness Zayed bin Sultan Al Nahyan
Leadership is an internal power of convincing the people and bring the best out of them, and the world has created so many leaders who have helped in the progress of the nation. But only an extraordinary leader with a strong belief, commitment, and leadership skills could be able to create a miracle in transforming a desert-like UAE into a modern state which is a real pride of the world now. His Highness Sheikh Zayed bin Sultan Al Nahyan who is the principal architect of the United Arab Emirates and held office as the president of UAE for over 30 years. The leadership style of Sheikh Zayed in the following anecdote he often quotes:
“The Ruler should not have any barrier which separates him from his people.”
Sheikh Zayed was an effective leader who catalyzed a vigorous pursuit of national development through the unionization of the emirates into a singular nation with a federal form of government and had a sharp vision, and the most significant guarantee of his effectiveness was the growth of the country during his governance. His success became the success of the country which was a transformation of the vision into a reality (UK Essays, 2015). Sheikh Zayed gained the respect and the love of the people due to his unique leadership style of wisdom. He adopted important principles of far-sightedness for Islamic nations and could earn international recognition as well. His charisma helped him to create a policy to maintain a close relationship with the people (Al Bawaba News, 2007). Sheikh Zayed had an extraordinary ability to construct a nation composed of three major elements, the bureaucratic structure of a modern state, diverse tribal elements, and a federal system. The UAE is a rising international Arab star; by 2021, the Golden Jubilee Year of the Nation, the nation is expected to attain global golden heights of education per capita for GDP, and it is possible due to the visionary leader and the father of the nation Sheikh Zayed (Ahmed, 2015).
Leadership
Northouse (2012) defines leadership as “a process whereby an individual influence a group of individuals to achieve a common goal”. Leadership is a process in which an individual exercises influence over others and inspires them to help and support the completion of a common task. Leadership comes from the word “lead” which means: “to show someone the way somewhere or take them there by going in front of them” (The Longman Dictionary, 2013). It is obvious that leadership is the way of acting and behaving to lead a group of people to certain common goals or objectives. It requires some personal attributes, interpersonal relations, and a doctrine. Leadership is a process in which an individual exercises influence over others and inspires them to help and support the completion of a common task. The key words are leadership style is to influence, inspire and support.
Leadership is one of the important HR strategy measures of achieving success in any organization. Leadership refers to a group phenomenon, goal-directed and action-oriented group of leaders and followers. Leaders exist with the power of followers. It is important to have leaders to reach success as leaders can influence change in individuals and group. To accomplish complex tasks, keep the group focused, and orderly people need leaders. The leadership effectiveness and efficiency consist of three main components: achieving goals, maintaining internal stability and health, and adapting to the external environment (Oghonnia, 2007).
Leadership Styles
Lewin et al. (1939) first distinguished the three classical styles of leadership, based on the use of competence. They can be defined similarly even today:
1. The autocratic (authoritative) style: Characterized by implementing the will of a leader, without taking into the consideration the opinion of subordinates. Leaders decide alone, give orders to subordinates and expect them to carry them out, based on unilateral, top-down communication. To motivate, leaders use their position to decide on the appropriate remuneration.
2. The democratic (participative) style: Characterized by the two-way communication between the leader and the subordinates. A leader is a person with a friendly approach to subordinates. He or she discusses the proposed tasks and decisions, procedures, etc. The leader consults them and their opinions carefully considered. Also, the leader coordinates work helps in performing duties and analyzes the achieved results with subordinates. Subordinates also participate in conducting evaluations and giving rewards.
3. The free rain (delegative style) style: The leader only occasionally uses his or her power and assigns a significant level of freedom to subordinates, to perform their jobs. Leader relies on subordinates to individually determine the objectives of their activities, the means to achieve them, as well as the implementation process. The leader helps subordinates to obtain the necessary information and ensure contact with the external environment (Koontz & Weihrich, 1993).
The JEDS (Job Evaluation and Description System) is a way of classification of the job description in all the federal governments in 2014 (FAHR Report, 2016). The JEDS is one of the best global practices in HR development, and it has helped to identify and map the job description in the federal government consists of 323 support and assistance jobs, 556 basic and professional jobs and 71 leadership jobs until 2016 in the federal government entities. The leadership jobs constitute roughly 5% of the total jobs across federal bodies which are vital in managing, implementing, and executing the decision of the government across the UAE (FAHR Report, 2016). So, understanding the leadership styles is very important as leaders hold the key position in any organization and their strategy is vital not only in the step of planning but also in implementing the strategies of the government of UAE.
Literature Review
Northouse (2012) defines leadership as a process in which a person influences others to meet an objective. A leader directs an organization in a manner that makes the organization more cohesive and coherent. The bottom line is to influence a group to achieve a common goal. There are four factors which affect leadership; namely situation, communication, follower, and leader. The leader has the task of showing his followers and superiors that he is worthy of being followed. Rowe (2007) asserts that although a position as manager in an organization gives the holder authority to accomplish certain tasks and objectives in the organization, this power does not make a leader, it only creates a boss.
One can see and feel the impact of leadership styles in many aspects of our life. It is an important and essential attribute that has been existed to assist people to manage and develop their life. UAE has organizations that employ managers and employees, but what distinguishes it from other countries is the significant number of foreigners, both white and blue collar. In the UAE, there are more than 200 nationalities and a population about 8.26 million and half of the population are labors (UAE National Bureau of Statistics, 2010).
Multiculturalism exists in the UAE with different nationalities, cultures, languages, religions, and norms. Leaders working in such a society require a high level of understanding about the different cultures and their values of the employees. Understanding the organizational behavior of a company one works for will aid in creating a better work environment and good communications within the subordinates. Managing a company with different nationalities or being an employee with managers and colleagues of different nationalities is not an easy matter to deal. This situation is a sensitive matter due to the variety of backgrounds in the society. It is a critical issue as the country is growing economically. This study is vital in understanding the various leadership styles based on different sectors and with diversified backgrounds.
Geert Hofstede researched the international differences in work-related values, and he classified the differences in four categories:
1. Power distance: The size of distance employees sees between them and their bosses.
2. Uncertainty avoidance: How cultures handle the uncertainty of future and rapid changes which create anxiety.
3. Individualism/Collectivism: The sense of an employee within an organization as a free person or a part of the harmonized group.
4. Masculinity/Femininity: It is not only about the role of male or female. Is also about the society if it is masculine, it will show assertive behavior, and the feminine society will show nurturing behavior.
According to Lewin et al. (1939), “Leadership style is the manner and approach of providing direction, implementing plans, and motivating people”. In fact, leadership style changes according to the environment as well as, the team circumstances, and the situation. The leaders' ideas, principles, and suppositions are very important to the leadership style that they accept. Every system has a special collection of good and bad qualities, and everyone makes use of leadership in a special way (Tannenbaum & Schmidt, 1973). However, the major styles of leadership are authoritarian or autocratic; participative or democratic; and free rein.
In this paper, the authors will analyze the various kinds of leadership styles that prevailed in the UAE as of now and will interlink the same with the kind of innovative strategy that a company possesses. Leadership does not depend only on the senior roles within an organization. It exists at every level, and in each employee, it is the sense of ownership and the sense of leading by example. Therefore, a person who does not have any major leadership role assigned can also display important traits of leadership (Kirkpatick & Locke, 1991).
If one talks about the leadership style, it is nothing but a pattern of behavior while a person is in a leadership position and it is a combination of behavior and attitude which is regularly shown by a person while dealing with group members. It is important to understand that leadership style is a constant this play of a certain behavior related to a leadership role. (Yousef, 2000).
A leadership style is the situation-based concept, and it depends upon the actual situation in which a leader is performing. Therefore, a leadership style based on the situation may be said to be the right one. However, there is no actual scale to rate the leadership behavior in a manner. The right leadership style can fulfill various purposes and the success of the organization, and the performance of managers within the organization at because of applying the right leadership style (Oshagbemi, 1999).
Literature suggests that majorly the factors that impact the kind of leadership style are three forces which are the leader himself, the subordinates and reporting into the leader and the situation in which leaders are performing. Other factors can also impact the leadership style, and they are a function of the organizational unit, lateral interdependence, crisis task characteristics and technology, authority hierarchy, stages in the organization life cycle and subordinate’s competence and performance (Randeree & Chaudhry, 2007).
A social-centric leader would display a high need for affiliation however at the same time he would not be noticeably concerned and following that any egocentric leader would be aggressive, selfish, impulsive, and restless and would not be in a position to accept the limitations and constraints of the society. On the other hand, a ‘man-ape related’ leader would be quite calculative to achieve success which may have selfish interlinked profits, would be materialistic and expressive. Lastly, an “existential” leader would show high tolerance towards ambiguity and would be much more lenient than the others (Randeree & Chaudhry, 2007).
The literature (Adler, 1991; Ali, 1989) which talks about the Arabic leadership styles mentions that the consultative style is quite predominant in case of decision-making. There is also an observation which has been discussed commonly about the Arabic companies that consultative or participate in leadership is commonly found within these organizations because the employees are quite satisfied with their jobs, and a high display potential and provide the organization with high-performance (Adler & Kwon, 2002).
There are many studies concerned with the determination of the most common and effective leadership style. Results indicate that consultative style was the most common and effective leadership style. Also, results indicate that the leaders’ attributes such as national culture, experience, education, and age; employees’ attributes such as gender, national culture, age and tenure in current organization and organizational factors such as the organization’s ownership have a meaningful relationship with leadership style.
Also, Ting-Toomey (1999) believed that leaders need to be skilled in creating transcultural visions. Leadership exists in all societies and is critical to the functioning of organizations within societies. However, the attributes as characteristic for leaders may vary across cultures (Thierry et al., 1999). As a result, there is a growing awareness of the need for a better understanding of the way the leadership styles in various cultures (Klein & House, 1995).
Robbins (1993) also suggested that national culture plays an important role in determining the effectiveness of leadership style. Similarly, Adler (1991), Badawy (1980) and Bass (1981) have argued that national boundaries make considerable differences in leadership style. Furthermore, a leader to lead effectively in another culture must understand the social values, customs, norms, leadership behavior and work-related cultural values of the host country's workforce (Fatehi, 1996). Some of the previous researchers have studied leadership style in the Arab world. For example, Ali (1989) examined the decision-making styles of UAE managers. The results showed that the consultative style was predominant.
Based on the literature review the authors found there is a gap in the literature which has to be addressed in the UAE. The authors developed the survey instrument to address those factors to conduct the study. As well as to focus on those factors such as education level, years of experience, public or private sectors, level of management and authority for the period.
Similarly, the sector of work regarding public, private or entrepreneurial may also influence one’s decision making leadership styles. In addition to the sector, the field of work regarding the functional area such as marketing, finance, information systems, licensing and much more also exhibit different styles. It was of interest to identify if there were any significant differences in the leadership styles followed by people in these different sectors and departments. These factors of the organization when influenced with personality traits of demography are expected to give valuable results that can be of great value to organizations to plan for their employees and training. It may be helpful in trying to identify training needs for people in organizations to understand the type of leadership that is ideal as well as find out ways the company may adopt to nurture and gain skills in the required style.
The factors considered in the study where, the independent variables used were predominantly demographic and work-related.
Age
Age is considered to be a great influencer in decision making. The general philosophy is that older people tend to make better decisions. It may also classify in this case that age alone cannot define the style as this relates to their normal work, a combination of the experience that has he or she out of aging is a better estimator and hence it can be covariates.
Gender
There have always been differing views and changes in views of how people of opposite sexes make decisions, the situation they are exposed to normal life and work environments. It was of interest to know if this can be an influencing factor in the style of leadership in an organizational decision-making environment.
Level of education
Education is supposed to make one knowledgeable. The understanding that one makes out of education and learning will influence the nature of decision making and the styles of leadership exhibited. However, it may not be a great influencer if a specific skill set is based on the experience in handling would be more important and significant rather than age. Say for example diagnosing or troubleshooting a car, a young man with no proper education, however, having extensive mechanical skill due to exposure to the environment might be very autocratic in diagnosing the issue as when compared to a more learned, aged person. Since this study focuses more on a general work environment that requires not just experience of handling similar or bounded conditions but concerning a variety of conditions that require knowledge and understanding along with being in a team of people to resolve issues or making decisions.
Industry type
For similar work conditions say marketing or purchase, there could be differences in the style of decision making in different sectors of the industry. A person in a private organization might be influenced by the organization’s culture, procedures, methods, and walks which may have a different style as when compared to a person in a government sector. The leadership of this country, the UAE, is to be considered here that has been very democratic, transparent and welcoming in the general approach to bringing about initiatives and processes for its citizens and expatriates. It is normal that such similar organizational influence would be seen in the sector and to a greater extent with the other sectors too.
Level of management
The level of management that a person is expected to influence the style of leadership as the magnitude of issues, team size, accountability, and responsibility increases up to the levels. However, the individual nature of a person is a great influencer here as one may continue to pursue the same style irrespective of their position due to many reasons such as past experiences in being successful by using a style, the quality of decision outcome and principles followed. It may be looked at from the other perspective too, wherein the person is unable to accommodate and understand the power or feels insecure and incompetent that he/she may resort to a particular style despite the expectation of following an alternative style for the betterment of the people and decision quality. Hence, this is considered to be an important factor which represents the individual's nature and perception.
Total work experience
The years of experience in many places they worked as well as people exposed to the various situations will impact the decision-making skills. The manger with a wider range of decisions and experience tend to use broader approaches to decision making by their exposure to various demanding situations they have dealt with in their working life than an inexperienced person. The factors, which affect the decision making, include the various levels of management and his/her exposure to the organization he/she works for. The experience gained from one organization is not left behind but stays as tacit knowledge and is used in any place the person works for and is a great influencer of the style used.
Experience in the organization
Even though people join organizations with past experiences, the culture, policies, people, procedures, values, and many such organizational factors do influence the way people act and carry themselves. It happens in the initial stages, and when some people cannot match the same with their values, principles and expectations lead to early attrition. Hence, this variable may be considered as a covariate to the total experience gained and can bring about inferences about the influence of the organizational characteristics.
Experience in the position
Another factor that should be taken into consideration in the study is the influence of the position and the amount of time that one has spent in the position. When people are selected and appointed to a new position, they are unaware of skills required to work in the position, or they are power and position-oriented rather than result and goal oriented. It is possible only in the initial stages of appointment and slowly realized over a period and the style of leadership to decision making changes.
Methodology
Being a study on leadership styles for decision making, the focus is on eliciting the process followed under different situations of decision making. Following the various inputs, the authors developed a model that requires respondents to score on a five-point scale as always, frequently, occasionally, seldom and, almost never. The set of the variable is classified and coded from 5 to 1 where 5 is always and 1 seldom. The score values are not given initially to the respondent as it induces a bias. The construct has nine questions on each of the leadership styles in a mixed order thereby ensuring randomness and not leading the respondent to a particular direction. The questionnaire was shared and administered to a diverse set of people at different levels of management and decision-making capacity in different sectors of the industry.
This study makes use of primary data collected across a diverse set of people. Since the study focuses on leadership styles used in decision making, it required a stratified sample to identify differences in different strata and hence a Stratified Random Sampling process was used to identify samples. In all, five hundred sample points were collected and gathered and identified and given a questionnaire to fill. The questionnaire was distributed to government organizations, quasi – government, private and entrepreneurial organizations. Each organization required all three levels of management-lower, middle and top in its various divisions such as Marketing, Finance, Human Resources, Engineering, Design etc. the questionnaire was distributed randomly in each department to incorporate the variability found in the organizations. Table 1 summarizes the responses for the various strata. The survey had a 60% response rate, and the authors received around 328 responses. On further study of the data, it was found out that only two hundred ninety-eight (298) were complete in all respects and valid to be used for the analysis.
| Table1 Survey Categories And Counts Of Responses |
||
| Category | Variables | Count Numbers |
| Gender | Male | 193 |
| Female | 105 | |
| Age Group | 21-30 | 217 |
| 30-40 | 79 | |
| 40-50 | 45 | |
| 50 and above | 26 | |
| Management Levels |
Top | 126 |
| Middle | 126 | |
| Lower | 47 | |
| Organization Type |
Private Sector | 34 |
| Semi-Government | 21 | |
| Government | 238 | |
| Own Business | 5 | |
The data collected was based on the opinion of the people of a given situation, and coded into a categorical scaling. A linear regression may not yield the required results as in some cases of strong belief in a particular type of pronounced style of leadership in decision making will force the tails to be too fat thereby increasing the chances of the error variable to be high. However, linear regression has been conducted to identify the most pronounced factor to have an initial idea of the data. The OLS may distort the results and the following interpretation may not be valid for policy or further decision making for research purposes and requires a more robust tool to identify the degree of association to a particular style. The initial OLS regression model had the actual scores of the styles as the dependent variable thereby increasing the validity. The OLS model equations here form a matrix consisting of the product of the categories against the outcome categories.
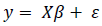
Where,
X is the matrix of the vectors of the outcome categories denoted as:
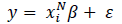
Also, the demographic variables that were included and collected also were categorical thereby limiting the use of a linear method. The other possibilities being a binomial regression could also not be satisfactorily used as the final response-dependent variable had three classifications. It left the research to opt for ordered logistic or multinomial regression methods. The ordered logistic method may not be considered as valid although, being a better estimator is reasoned based on the type of representation the collected data represents. The response was coded on a five-point scale is not the ranking as given by the respondent rather is a coding of the response to identify the overall outcome of the style used. Hence a multinomial logistic regression model was used to get the estimates of the significance of the factors studied (Engel, 1988; Menard, 2002; Malouf, 2002).
The standard logit form:
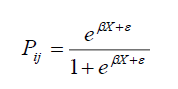
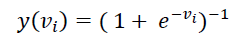
The dependent variable is to be recorded into possible categories to achieve better results. The constructs were classified and divided among three styles with each style having nine constructs. The maximum score on any construct is 45 (9 x 5) indicating that the person uses this style as the prominent style with scores as low as 30, a score of 15 or less indicates a dormant style and a score between 15 to less than 30 indicates possibilities of one or more styles. To estimate the probabilities of a particular person in relation to choosing a leadership style, it is required to get the odds of the probability (Baltas & Doyle, 2001; Darroch & Ratcliff, 1972). In addition to having the odds of the outcome, it would make more meaningful if the odds of each independent variable is considered. So that the actual values of the styles can be estimated where a neural network methodology was also used to identify and classify the most important factors (Bishop, 2006; Yu, et al., 2011). The neural network methodology uses machine learning techniques, which resemble human behavior using Artificial Intelligence methods. It is done using a sigmoid activation function as given below:
Analysis And Discussion
Descriptive
The initial data consisted of 298 samples each from different age groups, industry sectors with varying levels of the management and differing experiences in total, company based, and position based as listed in the Table 2. The mean age of the samples was 32 years with a standard deviation of 7.7 years with a range of 40 years from 20 years to 60 years thus representing a real population. The total years of experience had an average of minimum 9.5 with a range of 39 years as there were many youngsters in the survey, this is due to the fact that the study was more focused on current working generation as can be seen from the skewness that the distribution has still been normal not violating the requirements for any form of regression. People had worked about six years on average in the organization thus enabling a good estimate of the influence of the company related factors to have been well understood and reflected in their ways of work. The position-based experience was on an average of 3 years with SD 3 years and normally distributed with a skewness of 3, and it is also seen from the kurtosis values that they were very centered and formed a robust variable for the study. The value of the levels of management was mostly centered around the middle management as expected for the study as these are the people who operationalize the activities and are involved in varied decision-making environments thus compelling them to exhibit actual reflections of the style followed. The overall scores of the three different styles of leadership for decision making were Autocratic at 29, Democratic at 34 and Delegative at 32 it is seen from the kurtosis values of these that the democratic style is more peaked followed by delegative style and the autocratic much flatter. It may be understood as the most common style most of the respondents followed was more of democratic than of the autocratic style. The different sectors considered were private, semi-government, government, and entrepreneurial with most of the respondents being from the semi-government and government sectors.
| Table 2 Descriptive Statistics Of The Variables Used In The Studydescriptive Statistics |
|||||||||
| Factors | N | Range | Minimum | Maximum | Mean | Std. Deviation | Variance | Skewness (Std. Error) |
Kurtosis (Std. Error) |
| Gender | 298 | 1.00 | 1.00 | 2.00 | 1.3502 | 0.47783 | 0.228 | 0.631 (0.141) | -1.612 (0.282) |
| Age | 298 | 40.00 | 20.00 | 60.00 | 32.4214 | 7.73012 | 59.755 | 1.295 (0.141) | 1.629 (0.281) |
| Education | 298 | 5.00 | 0.00 | 4.00 | 3.1071 | 0.94034 | 0.884 | -1.446 (0.139) | 3.009 (0.277) |
| Type of Industry | 298 | 3 | 1 | 4 | 2.72 | 0.682 | 0.466 | -1.753 (0.141) | 1.988 (0.281) |
| Total Experience | 298 | 39.00 | 3.00 | 42.00 | 9.5067 | 7.39115 | 54.629 | 2.227 (0.141) | 4.978 (0.281) |
| Company Experience | 298 | 31.70 | 0.30 | 32.00 | 6.0391 | 5.35972 | 28.727 | 2.193 (0.141) | 5.474 (0.281) |
| Position | 298 | 24.80 | 0.20 | 25.00 | 3.4197 | 3.11418 | 9.698 | 3.058 (0.141) | 13.035 (0.281) |
| Level O | 298 | 2.00 | 1.00 | 3.00 | 1.7358 | 0.71449 | 0.510 | 0.436 (0.141) | -0.960 (0.281) |
| Autocratic | 298 | 38.00 | 7.00 | 45.00 | 29.8955 | 6.56353 | 43.080 | -0.130 (0.144) | 0.337 (0.287) |
| Democratic | 298 | 41.00 | 4.00 | 45.00 | 34.8258 | 6.00620 | 36.074 | -1.262 (0.144) | 3.403 (0.287) |
| Delegative | 298 | 39.00 | 6.00 | 45.00 | 32.8606 | 5.83288 | 34.022 | -0.608 (0.144) | 1.783 (0.287) |
Fundamental Statistics
A simple correlation analysis was constructed for the data set to identify the relationships between the variables which form the initial understanding of the data to be further studied and analyzed as given in Table 3. The use of correlation, in this case, may not give the real strength but is used to study the direction of relationships which is of prominence in this study. The correlation with age and the style indicate that the direction to be negative concerning the autocratic and delegative types indicating that the person out of age slowly moves from either of them to a more democratic style. It could be classified and attributed to the perspectives of one's ability to understand that decisions made on collective mechanisms are better as when compared to the other types. The results show that the higher the level of education achieved the lesser the use of the autocratic or delegative styles more significant for the autocratic. A similar pattern is seen in the results concerning the total years of experience and the organizational experience. However, it is not the case concerning the positional experience. The level of management of the employee seems to affect the style, as levels go higher people tend to be less autocratic. A similar set of pattern is followed concerning the delegative style, on the other hand; the democratic style seems to be more pronounced in the higher levels of management.
| Table 3 Results Of The Correlation Matrix For The Variablescorrelation Results Of The Variables |
||||||||||||||
| Gender | Age | Education | Total _Exp |
Comp _Exp |
Position | Industry | Autocratic | Democratic | Delegative | Auto _C |
Demo _C |
Deleg _C |
Level _O |
|
| Gender | 1 | -.282** | 0.027 | -.189** | -.142* | -.130* | .142* | 0.021 | 0.026 | 0.092 | 0.031 | -0.038 | 0.075 | -.159** |
| Age | 1 | .152** | .745** | .548** | .315** | -0.005 | -0.102 | -0.006 | -0.108 | -0.090 | 0.053 | -0.084 | .468** | |
| Education | 1 | .147* | 0.052 | 0.010 | -0.019 | -.138* | 0.115 | -0.027 | -.121* | 0.098 | -0.046 | .252** | ||
| Total_Exp | 1 | .649** | .421** | -0.019 | -0.103 | -0.044 | -.117* | -0.081 | 0.005 | -0.060 | .519** | |||
| Comp_Exp | 1 | .520** | 0.092 | -0.010 | 0.024 | -0.022 | 0.014 | 0.040 | 0.015 | .448** | ||||
| Position | 1 | 0.043 | 0.045 | -0.033 | -0.011 | 0.072 | -0.031 | 0.030 | .234** | |||||
| Industry | 1 | 0.103 | 0.094 | .116* | .123* | 0.096 | 0.080 | -0.076 | ||||||
| Autocratic | 1 | .521** | .642** | .918** | .428** | .567** | -.150* | |||||||
| Democratic | 1 | .723** | .476** | .896** | .646** | 0.109 | ||||||||
| Delegative | 1 | .570** | .627** | .885** | -0.035 | |||||||||
| Auto_C | 1 | .435** | .541** | -0.107 | ||||||||||
| Demo_C | 1 | .585** | .147* | |||||||||||
| Deleg_C | 1 | 0.007 | ||||||||||||
| level_O | 1 | |||||||||||||
Note: **Correlation is significant at the 0.01 level (2-tailed); *Correlation is significant at the 0.05 level (2-tailed).
OLS Analysis
A linear regression model was constructed based on the data for the actual scores of the styles as the dependent variable and the other factors such as age, Total experience, Company experience, position based experience, gender, education level, industry and level of management as the independent variables to estimate the coefficient to make inferences. The OLS model seems to be a good fit as given in the model summary for ANOVA (Table 4) with significant levels for the autocratic and the democratic, however; the model seems to be relatively insignificant for the delegation style.
| Table 4 Regression Model Fitting Summary For Ols (Ols Model Fitting Summary) |
|||||||
| Democratic | Model | Sum of Squares | df | Mean Square | F | Sig. | |
| R 0.097a |
Regression | 447.148 | 8 | 55.893 | 1.693 | .099b | |
| Residual | 9870.142 | 299 | 33.011 | ||||
| Total | 10317.289 | 307 | |||||
| Autocrative | Model | Sum of Squares | df | Mean Square | F | Sig. | |
| R 0.154a |
Regression | 601.085 | 8 | 75.136 | 1.917 | .057b | |
| Residual | 11719.780 | 299 | 39.197 | ||||
| Total | 12320.864 | 307 | |||||
| Delegative | Model | Sum of Squares | df | Mean Square | F | Sig. | |
| R 0.142a |
Regression | 335.484 | 8 | 41.935 | 1.335 | .226b | |
| Residual | 9394.942 | 299 | 31.421 | ||||
| Total | 9730.425 | 307 | |||||
Note: a: Predictors: (Constant), Position, age, Comp_Exp, Total_Exp -these constitute the value of the constant.
b: Dependent Variable: Delegative, Autocrative, Democratic.
The results (Table 5) were as expected for the autocratic style; the coefficients for most of the variables were negative indicating that the autocratic nature decreases as the variables change. It is also to be noted that women tend to become less autocratic as compared to men. The implications of the positional experience and the company experience indicate the amount of learning that one acquires in a position slowly translates into autocracy. It should not be a situation where it is understood that one becomes more autocratic as position experience increases but that the tacit knowledge build-up may not require democratic decisions style. However, the company experience also seems to have a similar effect which is surprising indicating that one learns the ways of work in the organization and probably starts to exhibit autocratic styles.
| Table 5 Regression Results Of The Ols Model |
|||||||||
| OLS COEFFICIENTS OF | |||||||||
| Democratic | Autocrative | Delegative | |||||||
| Model | Unstandardized Coefficients | Sig. | Unstandardized Coefficients | Sig. | Unstandardized Coefficients | Sig. | |||
| B | Std. Error | B | Std. Error | B | Std. Error | ||||
| Constant) | 29.276 | 2.723 | 0.000 | 32.329 | 2.967 | 0.000 | 30.894 | 2.656 | 0.000 |
| Age | 0.014 | 0.067 | 0.836 | -0.039 | 0.073 | 0.596 | -0.034 | 0.066 | 0.605 |
| Total_Exp | -0.135 | 0.077 | 0.083 | -0.070 | 0.084 | 0.409 | -0.110 | 0.075 | 0.017 |
| Comp_Exp | 0.069 | 0.090 | 0.047 | 0.088 | 0.099 | 0.373 | 0.066 | 0.088 | 0.458 |
| Position | -0.077 | 0.127 | 0.056 | 0.160 | 0.018 | 0.247 | 0.043 | 0.124 | 0.075 |
| Gender | 0.156 | 0.740 | 0.833 | -0.197 | 0.807 | 0.807 | 0.667 | 0.722 | 0.356 |
| Education | 0.480 | 0.359 | 0.012 | -0.506 | 0.091 | 0.196 | -0.068 | 0.350 | 0.406 |
| Industry | 0.822 | 0.501 | 0.102 | 0.755 | 0.046 | 0.168 | 0.824 | 0.489 | 0.093 |
| level_O | 1.318 | 0.570 | 0.021 | -1.038 | 0.062 | 0.096 | 0.369 | 0.556 | 0.508 |
The coefficients of the delegative regression show a decrease concerning age, total experience, and education. The most significant is the relative nature seems to be more seen in the private and entrepreneurial sectors than the government and semi-government sectors. The effects of democratic styles are negative with total experience and positional experience this may be due to similar reasons as when one learns the methods, and it is introduced to varying situations of decision making it builds as tacit knowledge and reflects a lower democratic style. The other significant variables are education and industry sectors.
The most significant variable is also the level of management, and it is the way that is seen that as people move up the levels, they tend to use democratic styles. Since most of the variables are categorical in addition to the possibility of classifying the dependent to a categorical nature on three levels as weak, confused, and strong levels of a particular style, this requires a logistic regression model to understand the inferences.
Multinomial Logistic Regression Analysis
The scores of the dependent variable can vary from 0 to 45 for any particular construct. However, the prominent style exhibited is that which has a high score. A score range of less than 15 can be classified as dormant while one with scores over 35 can be classified considered as pronounced styles. To understand the results in a better way the authors made two regressions equations. These regression equations were run one with the dependent and the independent as categorical variables with experience years as covariates since the OLS had predicted the effect of experiences either total, company based or positional they may be considered to have predictive abilities to the categorization of the dependent variable (Table 6). The model fitting was found to be significant for autocratic and democratic styles with lesser fits for the delegation style. The odds of autocratic styles are very significant indicating that the change in any of the independent variable would increase the chance of the person moving to a more autocratic style (Table 7). The change in democratic is significant concerning the education level, industry, and level of management. The results for the odds for delegate types are similar to that of the democratic style with a lesser significance which may be classified or attributed to either the respondents not having clarity of the style followed or that they are prone to use both styles equally. A further study of how these variables affect the outcome of each of the categories is also produced and the results presented in Table 8.
| Table 6 Model Fitting Summary For The Multinomial Logistic Regression |
|||||
| Multi Nominal Logistic Model Fitting Summary | |||||
| Autocratic | Model | Model Fitting Criteria | Likelihood Ratio Tests | ||
| -2 Log Likelihood | Chi-Square | df | Sig. | ||
| Intercept Only | 604.228 | ||||
| Final | 451.484 | 152.743 | 120 | 0.023 | |
| Democratic | Model | Model Fitting Criteria | Likelihood Ratio Tests | ||
| -2 Log Likelihood | Chi-Square | df | Sig. | ||
| Intercept Only | 528.231 | ||||
| Final | 893.843 | 178.674 | 120 | 0.008 | |
| Delegative | Model | Model Fitting Criteria | Likelihood Ratio Tests | ||
| -2 Log Likelihood | Chi-Square | df | Sig. | ||
| Intercept Only | 523.957 | ||||
| Final | 410.620 | 113.337 | 120 | 0.456 | |
| Table 7 Regression Results Of The Multinomial Regression |
||||||
| Log Likelihood Ratios of the Tests | ||||||
| Autocratic | Democratic | Delegative | ||||
| Effect | -2Log Likelihood of Reduced Model | Sig. | 2 Log Likelihood of Reduced Model | Sig. | -2 Log Likelihood of Reduced Model | Sig. |
| Intercept | 451.484 | 1993.843 | 410.620 | |||
| Age | 451.970 | 0.922 | 2381.973 | 0.000 | 411.510 | 0.828 |
| Total_Exp | 460.373 | 0.031 | 2579.667 | 0.000 | 411.925 | 0.728 |
| Comp_Exp | 458.844 | 0.061 | 2682.306 | 0.000 | 411.849 | 0.046 |
| Position | 454.961 | 0.034 | 1807.791 | 416.164 | 0.136 | |
| Gender | 452.454 | 0.809 | 2303.594 | 0.000 | 411.248 | 0.890 |
| Education | 479.573 | 0.021 | 4625.042 | 0.000 | 418.820 | 0.916 |
| Industry | 467.167 | 0.074 | 469.072 | 420.009 | 0.042 | |
| Level | 458.488 | 0.321 | 2357.456 | 0.000 | 412.664 | 0.016 |
| Table 8 Results Of Logistic Regression Indicating Cut Points At Different Levels Of The Dependent Variables |
||||||||||||||||
| Autocratic | ||||||||||||||||
| Level 1 | Level 2 | Level 3 | ||||||||||||||
| Factor | Beta | S.E. | Significance | Beta | S.E. | Significance | Beta | S.E. | Significance | |||||||
| Age | 1.127 | 23.988 | 0.963 | 1.113 | 23.988 | 0.963 | 1.141 | 23.988 | 0.962 | |||||||
| Total_Exp | 1.941 | 49.443 | 0.069 | 1.982 | 49.443 | 0.068 | 1.781 | 49.443 | 0.971 | |||||||
| Comp_Exp | -1.630 | 34.378 | 0.062 | -1.666 | 34.378 | 0.061 | -1.472 | 34.378 | 0.966 | |||||||
| Position | -3.804 | 102.590 | 0.070 | -3.698 | 102.590 | 0.071 | -3.638 | 102.590 | 0.972 | |||||||
| [Gender=1.00] | -14.447 | 474.799 | 0.076 | -14.312 | 474.799 | 0.076 | -13.999 | 474.799 | 0.976 | |||||||
| [Gender=2.00] | 0c | 0c | 0c | |||||||||||||
| [Education=.00] | -95.784 | 8664.318 | 0.091 | -112.043 | 8819.793 | 0.090 | -99.763 | 9154.718 | 0.991 | |||||||
| [Education=1.00] | 70.329 | 1762.113 | 0.068 | 69.963 | 1762.113 | 0.068 | 83.332 | 2020.861 | 0.967 | |||||||
| [Education=2.00] | -82.801 | 7524.530 | 0.091 | -67.633 | 7245.679 | 0.093 | -66.293 | 7643.371 | 0.993 | |||||||
| [Education=3.00] | 76.237 | 1107.449 | 0.045 | 75.422 | 1107.449 | 0.046 | 89.503 | 1485.018 | 0.952 | |||||||
| [Education=4.00] | 5.231 | 629.445 | 0.093 | 4.015 | 629.445 | 0.095 | 17.875 | 1172.620 | 0.988 | |||||||
| [Education=5.00] | 0c | 0c | 0c | |||||||||||||
| [Industr=1] | 104.019 | 1622.421 | 0.049 | 89.983 | 1397.142 | 0.049 | 89.082 | 1397.141 | 0.949 | |||||||
| [Industr=2] | -17.374 | 1115.145 | 0.088 | -31.156 | 750.536 | 0.067 | -33.425 | 750.535 | 0.964 | |||||||
| [Industr=3] | 128.607 | 824.771 | 0.082 | 5.143 | 1.444 | 0.000 | 4.172 | 0.000 | ||||||||
| [Industr=4] | 0c | 0c | 0c | |||||||||||||
| [Level=L] | -18.598 | 1954.878 | 0.092 | -17.935 | 1954.878 | 0.093 | -16.489 | 1954.878 | 0.993 | |||||||
| [Level=M] | 11.999 | 1476.330 | 0.094 | -11.965 | 1476.330 | 0.094 | -10.647 | 1476.330 | 0.994 | |||||||
| [Level=T] | 0c | 0c | 0c | |||||||||||||
| Democratic | ||||||||||||||||
| Age | 0.105 | 0.134 | 0.034 | 0.153 | 0.120 | 0.005 | 0.157 | 0.120 | 0.019 | |||||||
| Total_Exp | 0.147 | 0.212 | 0.089 | 0.153 | 0.199 | 0.040 | 0.084 | 0.198 | 0.072 | |||||||
| Comp_Exp | -0.100 | 0.196 | 0.011 | -0.165 | 0.166 | 0.019 | -0.108 | 0.163 | 0.007 | |||||||
| Position | -0.016 | 0.211 | 0.041 | -0.186 | 0.176 | 0.022 | -0.126 | 0.172 | 0.064 | |||||||
| [Gender=1.00] | -2.957 | 1.799 | 0.100 | -1.890 | 1.707 | 0.028 | -1.918 | 1.700 | 0.259 | |||||||
| [Gender=2.00] | 0b | 0b | 0b | |||||||||||||
| [Education=.00] | 0.645 | 27.476 | 0.981 | 3.992 | 22.896 | 0.062 | -2.405 | 22.857 | 0.916 | |||||||
| [Education=1.00] | 1.112 | 11.800 | 0.925 | 3.465 | 4.841 | 0.074 | -2.158 | 3.178 | 0.097 | |||||||
| [Education=2.00] | -2.085 | 26.596 | 0.038 | -1.039 | 22.447 | 0.063 | -1.687 | 21.826 | 0.038 | |||||||
| [Education=3.00] | 3.279 | 11.709 | 0.079 | 4.108 | 4.735 | 0.086 | -0.119 | 2.978 | 0.068 | |||||||
| [Education=4.00] | 2.906 | 11.731 | 0.004 | 2.443 | 4.796 | 0.010 | -1.208 | 3.070 | 0.694 | |||||||
| [Education=5.00] | 0b | 0b | 0b | |||||||||||||
| [Industr=1] | -1.631 | 8.909 | 0.055 | 1.442 | 8.854 | 0.071 | -0.624 | 8.790 | 0.003 | |||||||
| [Industr=2] | -4.122 | 8.966 | 0.046 | -0.670 | 8.857 | 0.040 | -2.861 | 8.796 | 0.005 | |||||||
| [Industr=3] | -2.194 | 8.656 | 0.800 | 0.431 | 8.639 | 0.060 | -1.206 | 8.576 | 0.088 | |||||||
| [Industr=4] | 0b | 0b | 0b | |||||||||||||
| [Level=L] | 3.758 | 2.385 | 0.115 | 1.214 | 1.799 | 0.000 | 0.733 | 1.780 | 0.080 | |||||||
| [Level=M] | 2.296 | 2.205 | 0.298 | 1.166 | 1.688 | 0.090 | 0.744 | 1.663 | 0.054 | |||||||
| [Level=T] | 0b | 0b | 0b | |||||||||||||
| Delegative | ||||||||||||||||
| Age | 1.474 | 24.195 | 0.951 | 1.484 | 24.195 | 0.951 | 1.455 | 24.195 | 0.952 | |||||||
| Total_Exp | -0.074 | 28.052 | 0.998 | -0.052 | 28.052 | 0.999 | -0.093 | 28.052 | 0.997 | |||||||
| Comp_Exp | -0.082 | 41.532 | 0.998 | -0.027 | 41.532 | 0.999 | 0.009 | 41.532 | 1.000 | |||||||
| Position | -1.429 | 80.515 | 0.986 | -1.666 | 80.515 | 0.983 | -1.568 | 80.515 | 0.984 | |||||||
| [Gender=1.00] | -10.826 | 851.692 | 0.990 | -11.132 | 851.692 | 0.990 | -11.299 | 851.692 | 0.989 | |||||||
| [Gender=2.00] | 0c | 0c | 0c | |||||||||||||
| [Education=.00] | -47.219 | 5994.776 | 0.994 | -33.898 | 5677.663 | 0.995 | -47.143 | 5749.268 | 0.993 | |||||||
| [Education=1.00] | 2.541 | 1758.596 | 0.999 | 17.315 | 1727.883 | 0.992 | 16.876 | 1727.883 | 0.992 | |||||||
| [Education=2.00] | -14.682 | 5863.473 | 0.998 | -0.988 | 5538.848 | 1.000 | -13.634 | 5612.224 | 0.998 | |||||||
| [Education=3.00] | 14.912 | 1563.170 | 0.992 | 16.502 | 1563.169 | 0.992 | 16.418 | 1563.169 | 0.992 | |||||||
| [Education=4.00] | -0.478 | 1585.767 | 1.000 | 0.485 | 1585.766 | 1.000 | 0.394 | 1585.766 | 1.000 | |||||||
| [Education=5.00] | 0c | 0c | 0c | |||||||||||||
| [Industr=1] | 13.214 | 1284.064 | 0.992 | 3.462 | 1151.176 | 0.998 | 3.580 | 1151.175 | 0.998 | |||||||
| [Industr=2] | -17.111 | 733.876 | 0.981 | -28.591 | 463.638 | 0.951 | -29.142 | 463.636 | 0.950 | |||||||
| [Industr=3] | 19.177 | 568.871 | 0.973 | 6.768 | 1.306 | 0.000 | 7.318 | 0.000 | ||||||||
| [Industr=4] | 0c | 0c | 0c | |||||||||||||
| [Level=L] | -10.041 | 1454.208 | 0.994 | -9.880 | 1454.208 | 0.995 | -9.961 | 1454.208 | 0.995 | |||||||
| [Level=M] | -11.158 | 1112.586 | 0.992 | -10.242 | 1112.586 | 0.993 | -10.545 | 1112.586 | 0.992 | |||||||
| [Level=T] | 0c | 0c | 0c | |||||||||||||
Note: b/c- this is set as the reference for the given categorical variables.
Neural Network Estimations
A neural network estimation used in machine learning and artificial intelligence uses a backward propagation technique that tries to train the model using a set of variables with hidden layers and bias, this is then used to test with a different set of similar variables to check for accuracy. A similar system may also be used to classify the categories of the output based on similar modeling. Most of the econometric models use linear approximations which often do not fit categorical data, and one such model is the logistic regression that tries to estimate the log odds of relative chances. However, the model the authors developed is based on the squares estimation which still underpins the linear approximation methods. An argument can be to use the non-linear methods of estimation which again are debatable concerning categorical data. The research tries to through light on contemporary techniques and compares their abilities against the standard estimation methods. This paper tries to use the Multi-Layer Perception model to classify the dependent variable-style of leadership (Collobert & Bengio, 2004; Hastie et al., 2009) in decision making against the various independent variables. A sigmoid activation function has been used in this case to get better results as the data is categorical (Cybenko, 1989).
The results of the neural network estimations (Figures 1-4) for delegative and autocratic styles indicate that the total years of experience does play an important role followed by the position and the industry while for the democratic, the position and company based experience have the major effect. It may be understood as the effect of the organizational culture and its impact on how a person deploys democratic styles. These results also seemingly corroborate with the linear approximations models as discussed.
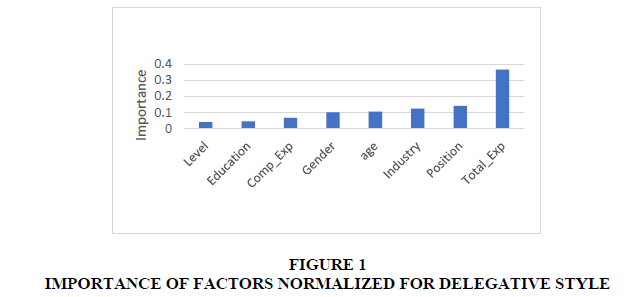
Figure 1: Importance Of Factors Normalized For Delegative Style
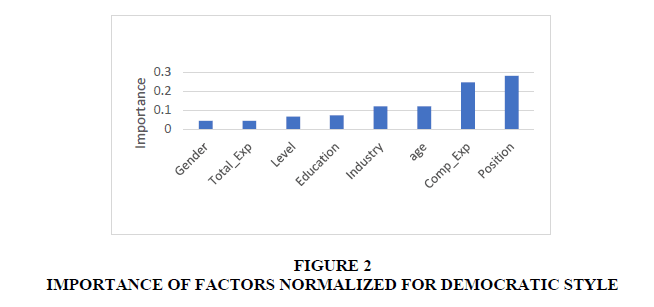
Figure 2: Importance Of Factors Normalized For Democratic Style
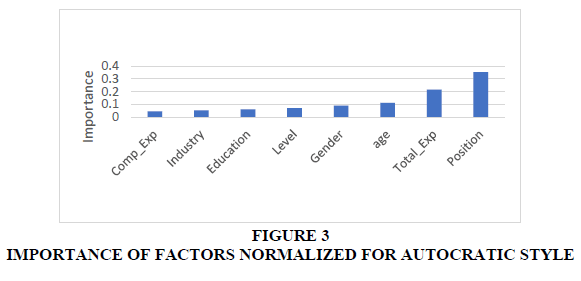
Figure 3: Importance Of Factors Normalized For Autocratic Style
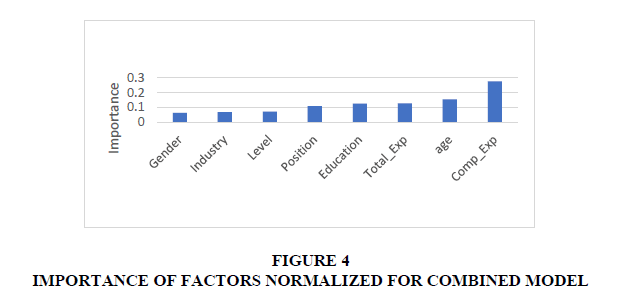
Figure 4: Importance Of Factors Normalized For Combined Model
Conclusion
“The citizen is the key element in the progress of our state and partner in forming the future of the nation” H.H. Sheikh Khalifa Bin Zayed Al Nahyan.
The research is aimed at identifying and estimating the factors that influence the style of leadership followed in decision making. It is focused on identifying if there were any specific differences in the styles in the sectors. An OLS model was initially constructed to identify the most influencing variable and being a categorical data; it was also identified to conduct a logistic regression to identify the odds of choosing one style over the other. Finally, a neural network training was also conducted to classify the characteristics to identify the most important to understand where policy matters need to focus. The authors found that the experience of a person in the organization, the experience in the position held, and level of management have an apparent effect. It can also be noted that the odds of women becoming marginally more democratic and the government and semi-government sectors were more democratic as when compared to the private which is normally not seen in the other parts of the world. Could it be attributed to the leadership styles of the national leaders? It remains a question for further research. It could also be attributed to the proportion of samples from these sectors were relatively more which could have contributed to the skewed results, requires additional data collection and further robust study of the phenomenon.
Leadership competencies are perceived as being the key competencies for roles in an organization that involve leading and influencing the work of others in some way. Leadership skills required in teams, project management, as well as at the managerial, executive and board levels. Leadership competencies are behaviors, knowledge, and skills which required by the positions having leadership responsibilities (e.g., Senior Management and Leadership roles). The FAHR is encouraging leaders to demonstrates consistent open, participative leadership style, delegating, accountability; makes team members feel valued, uses appropriate situational leadership style depending on individual CEO ability and the task or goal to completed, e.g., directing, coaching, supporting, and delegating (FAHR Report, 2016).
The authors conclude that the unique setting and context found in the public sector-very much defined by the UAE Constitution-leads to subtle, but very real and noteworthy differences. The current literature around the world show that the private sector is more efficient than the public sector based on the various analyses. However, our research analyses gives a different picture for the UAE. The results shows that in the UAE the public sector is more effective and efficient than the private sector because of the leadership styles followed in this sector.
References
- Adler, N.J. (1991). International dimensions of organizational behavior, 2nd ed. Wadsworth Publishing: Belmont, CA.
- Adler, P. S., & Kwon, S. W. (2002). Social capital: Prospects for a new concept. Academy of Management Review, 27(1), 17-40.
- Ahmed. G. (2015). Destination 2021. Forbes Middle East Guide, 46-37.
- Al Bawaba News (2007). The vision of his highness Sheikh Zayed Bin Sultan Al Nahyan: Lives on through The Wisdom Tower. Retrieved from https://www.albawaba.com/news/vision-his-highness-sheikh-zayed-bin-sultan-al-nahyan-lives-through-wisdom-tower
- Ali, A. (1989). A comparative study of managerial beliefs about work in the Arab states. Advances in International Comparative Management, 4, 95-112.
- Annual Economic Report (2017). Ministry of Economy,UAE.
- Badawy, M. K. (1980). Styles of Mideastern managers. California Management Review, 22(3), 51-58.
- Baltas, G., & Doyle, P. (2001). Random utility models in marketing research: a survey. Journal of Business Research, 51(2), 115-125.
- Bass, B. M. (1981). Stogdill's handbook of leadership: A survey of theory and research. New York.
- Bishop, & Christopher, M. (2006). Pattern recognition and machine learning. Springer: Thousand Oaks, CA.
- Collobert, R., & Bengio, S. (2004). Links between perceptrons, MLPs and SVMs. In Proceedings of the Twenty-First International Conference on Machine learning.
- Cybenko, G. (1989). Approximation by superpositions of a sigmoidal function. Mathematics of control, signals and systems, 2(4), 303-314.
- Darroch, J.N., & Ratcliff, D. (1972). Generalized iterative scaling for log-linear models. The Annals of Mathematical Statistics. Institute of Mathematical Statistics, 43(5), 1470-1480.
- Dar-us-Salam Q.(1985). Part 1 Verse 6 The Noble Quran Verse by Verse. Darussalam Publishers and Distributors: Riyadh, Saudi Arabia, 10.
- Davidson, C. (2005). The United Arab Emirates: A study in survival. Lynne Rienner Publishers: Boulder, CO.
- Emirates (2011). The glorious four decades of the UAE. Retrieved from http://www.emirates247.com/business/the-glorious-four-decades-of-the-uae-2011-12-19-1.433396
- Engel, J. (1988). Polytomous logistic regression. Statistica Neerlandica, 42(4), 233-252.
- Fatehi, K. (1996). International management: A cross-cultural and functional perspective. Upper Saddle River, New Jersey: Prentice Hall.
- Federal Decree Law No. 11. (2008). On the human resources in the federal government. Federal Decree Law No. 11.
- FAHR. (2016). FAHR issues its annual report.
- Ferguson, J., Peter, R., & Mike, R. (2017). Comparing leadership challenges civil service versus private sector. White Paper Part 2 in a 3-Part Series, the Center for Creative Leadership, Seattle, WA.
- Forbes. (2017). United Arab Emirates. Retrieved from https://www.forbes.com/places/united-arab-emirates/
- Glenz, J. (2002). Finding your leadership style: A guide for educators. Hawker Brownlow Education, Cheltenham.
- Hastie, T., Tibshirani, R., & Friedman, J. (2009). Unsupervised learning. In The Elements of Statistical Learning. Springer, New York, NY.
- International Monetary Fund. (2011). World Economic Outlook. Retrieved from https://www.imf.org/external/pubs/ft/weo/2011/02/weodata/index.aspx
- International Monetary Fund (2013). Economic prospects and policy challenges for the GCC countries.. Annual Meeting of Ministers of Finance and Central Bank Governors, Riyadh, Saudi Arabia. Retrieved from http://www.imf.org/external/np/pp/eng/2013/100513b.pdf
- Klein, K. J., & House, R. J. (1995). On fire: Charismatic leadership and levels of analysis. The Leadership Quarterly, 6(2), 183-198.
- Kirkpatick, S. A., & Locke, E. A. (1991). Leadership: do traits matter? Academy of Management Perspectives, 5(2), 48-60.
- Koontz, H., & Weihrich, H. (1993). Management: A global perspective. McGraw-Hill: New York.
- Lewin, K., LIippit, R., & White, R.K. (1939). Patterns of aggressive behavior in experimentally created social climates. Journal of Social Psychology, 10, 269-299.
- Malouf, R. (2002). A comparison of algorithms for maximum entropy parameter estimation. In proceedings of the 6th conference on Natural language learning. Association for Computational Linguistics. Retrieved from http://citeseer.ist.psu.edu/viewdoc/download?doi=10.1.1.134.7137&rep=rep1&type=pdf
- MENA Report. (2018). United Arab Emirates: Dubai Customs Launches Year of Zayed Exhibition within Carpet and Arts Oasis. Albawaba News (London) Ltd. Retrieved from https://www.albawaba.com/business/pr/dubai-customs-launches-year-zayed-exhibition-within-carpet-and-arts-oasis-2018-1073452
- Menard, S. (2002). Applied logistic regression analysis. Sage.
- Northouse, P. G. (2012). Leadership: Theory and practice. Sage publications.
- Oshagbemi, T. (1999). Managers and their time. Blackhall Publishing: Dublin.
- Oghonnia, SKC. (2007). Political parties and effective leadership: A contingency approach. PhD Dissertation, Walden University.
- Randeree, K., & Chaudhry, A. G. (2007). Leadership in project managed environments: Employee perceptions of leadership styles within infrastructure development in Dubai. International Review of Business Research Papers, 3(4), 220-232.
- Robbins, S.P. (1993). Organizational behavior, (6th edition). Prentice?Hall: Englewood Cliffs, N.J.
- Rowe, W.G. (2007). Cases in leadership. Sage Publications: Thousand Oaks, CA.
- Sensenbrenner, G., Serhan, C., Vincenzo, G., & Arthur, Ribeiro da S. (2011). United Arab Emirates: Selected Issues and Statistical Appendix. IMF Country Report No. 11/112. Retrieved from https://www.imf.org/external/pubs/ft/scr/2011/cr11112.pdf
- Shihab M. (2001). Economic Development in the UAE.United Arab Emirates: A new perspective. London: Trident Press Ltd., 249-59.
- Tannenbaum, R., & Schmidt, W. H. (1973). How to choose a leadership pattern. Boston, MA: Harvard Business Review.
- Tamman, H. (1981). Zayed Bin Sultan Al-Nahayyan: The Leader and the march. Dai Nippon Printing Co. Limited: Tokyo.
- The Longman Dictionary of Contemporary English. (2013). Reference Reviews.
- The UAE & The World’s Leading Economies. (2018). Managing challenges and opportunities amidst global change. Department of Economic Studies and Policies, UAE Ministry of Economy, UAE.
- Thierry, H., Den Hartog, D.N., Koopman, P.L., & Wilderom, C.P.M. (1999). Leadership, politics, and culture in the Netherlands. Cultures of the world: A GLOBE anthology of in-depth descriptions of the cultures of 14 countries, 1.
- Ting-Toomey, S. (1999). Communicating across cultures. Guildford: New York.
- UAE. (2010). National bureau of statistics.
- UK Essays. (2015). Strategic leadership of Sheikh Zayed Bin Sultan. Retrieved from https://www.ukessays.com/essays/history/strategic-leadership-of-sheikh-zayed-bin-sultan-history-essay.php
- Yousef, D. A. (2000). Organizational commitment: A mediator of the relationships of leadership behavior with job satisfaction and performance in a non-western country. Journal of Managerial Psychology, 15(1), 6-24.
- Yu, H. F., Huang, F. L., & Lin, C. J. (2011). Dual coordinate descent methods for logistic regression and maximum entropy models. Machine Learning, 85(1-2), 41-75.
- Ziyad, Abdul R. (1982). Zayed Bin Sultan Al Nahyan: A Life of Achievement. The Main Even.