Research Article: 2022 Vol: 25 Issue: 5S
Analysis of Application of Corporate Social Responsibility, Free Cash Flow and Profitability on Dividend Policy (Study on Manufacturing Companies Listed on the Indonesia Stock Exchange 2016-2020)
Adji Suratman, Sekolah Tinggi Ilmu Ekonomi YAI
Rahmawati Hanny Yustriannthe, Sekolah Tinggi Ilmu Ekonomi YAI
Elon Manurung, Sekolah Tinggi Ilmu Ekonomi YAI
Endang Setiawati, Sekolah Tinggi Ilmu Ekonomi YAI
Ahalik, Sekolah Tinggi Ilmu Ekonomi YAI
Citation Information: Suratman, A., Yustriannthe, R.H., Manurung, E., Setiawati, E., & Ahalik. (2022). Analysis of application of corporate social responsibility, free cash flow and profitability on dividend policy (study on manufacturing companies listed on the Indonesia stock exchange 2016-2020). Journal of Legal, Ethical and Regulatory Issues, 25(S5), 1-14.
Abstract
This study aims to determine and analysis corporate social responsibility, free cash flow, and profitability that can affect dividend policy in manufacturing companies listed on the IDX in 2016-2020. The purpose of this study is to examine the extent to which corporate social responsibility, free cash flow, and profitability have an effect on dividend policy. This study used secondary data and the sample of this study was determined by purposive sampling method in order to obtain 24 sample companies. The research method used is descriptive statistics, classical assumption test (normality test, multicollinearity test and heteroscedasticity test), model suitability test (Chow test, Hausman test, and Lagrange multiplier test), multiple linear regression, and then continued with the t test, test f and r2 test. Data analysis using the eviews 9 program. Based on the results of the study, it was found that corporate social responsibility and profitability had a positive and significant effect on dividend policy. Meanwhile, free cash flow has no significant and negative effect on dividend policy. The results of the research that have been carried out show the probability value of the free cash flow (FCF) variable >the critical probability value (α=5%) of 0.6429>0.05 and the value of t count< t table of 0.4648<1.9806, which shows that free cash flow has no significant effect on dividend policy in manufacturing companies.
Keywords
Corporate Social Responsibility, Free Cash Flow, Profitability, Dividend Policy.
Introduction
The rapid development of the business world, which can be seen from the emergence of various companies that compete with their respective advantages makes each company, must continue to make changes and updates. This makes competition in the business world continue to move and experience rapid dynamics of change. Each company will continue to compete to improve and maximize their profits and financial performance.
Financial performance refers to the act of performing financial activities. In a broader sense, financial performance refers to the extent to which financial goals are being or have been achieved. It is the process of measuring the results of a firm's policies and operations in monetary terms. However, at present, several manufacturing companies, especially in the food and beverage sub-sector, have experienced a decline in financial performance. such as MYOR, which experienced a 30% decline in share price where the original share price of IDR 3,100 in 2018 dropped dramatically in 2019 to IDR 2100.
During the first nine months of 2017, three of the four largest issuers in the sub-sector recorded weak economic performance. The four issuers are PT Indofood CBP Sukses Makmur Tbk (ICBP), PT Indofood Sukses Makmur Tbk (INDF), PT Mayora Indah Tbk (MYOR), and PT Ultrajaya Milk Industry & Trading Company Tbk (ULTJ). The weakening of the economic performance of each company naturally results in fluctuations in the value of the company (Ahmad et al., 2016).
The fluctuation of stock movements in this industry certainly has an impact on its contribution to the Indonesian economy. Currently, industry in the food and beverage sub-sector has the largest contribution to GDP. According to Kemenperin.go.id, the contribution of the food and beverage industry to the GDP of the non-oil and gas industry reached 34.95 percent in the third quarter of 2017. In addition, this achievement increased by four percent compared to the same period. In 2016.
Meanwhile, its contribution to national GDP was 6.21 percent in the third quarter of 2017, an increase of 3.85 percent over the same period the previous year. Then, seen from the development of investment realization, the food and beverage industry sector for domestic investment (PMDN) in the third quarter of 2017 reached IDR 27.92 trillion, an increase of 16.3 percent compared to the same period in 2016. Meanwhile, for foreign investment (PMA) amounting to USD1.46 billion. The decline in the company's financial performance has made the dividends received by investors also decrease (Jayanti & Puspitasari, 2017).
In fact, the main objective of investors investing in a company is to get dividends. Dividend payment is important for investors because 1) dividends provide certainty about the company's financial well-being, 2) dividends that attract investors to get current income; and 3) dividends help share market prices.
Research on dividend policy has basically been carried out by previous researchers, such as research conducted by (RAISSA, 2012) found that the profitability variable shows an insignificant positive effect on the DPR, which means that the size of the company's ability to generate profits does not affect the size of the DPR that is distributed.
In contrast to research conducted by (Krisardiyansah, 2020) found that profitability affects dividend policy, leverage has no effect on dividend policy, firm size affects dividend policy, and corporate social responsibility affects dividend policy. Based on the differences in opinion of the previous studies above, the researchers are interested in conducting similar research, namely regarding the factors that influence dividend policy with a focus on CSR disclosure, free cash flow and company profitability (Bangun et al., 2018).
One of the industries in Indonesia which is currently increasing is the manufacturing industry. According to the Ministry of Industry of the Republic of Indonesia, in 2016 Indonesia's manufacturing industry was ranked fourth in the world out of 15 countries whose manufacturing industries contributed to Gross Domestic Product (GDP) above 10%, where at that time Indonesia could contribute to GDP by 22% after South Korea (29%), China (27%) and Germany (23%).
Furthermore, in 2017 the manufacturing industry noted that the export value throughout 2017 reached USD125 billion or 76% of the total export value of Indonesia, increasing the manufacturing industry is one of the instant ways that the government can do to improve the national economy. Because with an increase in the GDP of the manufacturing industry by just 1, it will increase 0.2% of Indonesia's economic growth.
Based on the description above, the researcher will examine the effect of corporate social responsibility, free cash flow and profitability on dividend policy.
Literature Review
Signalling Theory
According to the concept of signal theory states that companies provide signals to parties outside the company aimed at increasing the value of company. Required information for disclosed by the company is information about social responsibility company or CSR. Companies carry out CSR disclosures in the hope that they can enhance the reputation and value of the company (Suryarini, 2018).
Agency Theory
It is the so-called principal is shareholders and what is meant by agents are professional/management/CEO, trusted by the principal to manage company. Principal goals and different agency goals can lead to conflict because managers are the main assumptions of agency theory companies tend to pursue personal goals, this can result in managers' tendency to focus on projects and Investment Company that generates high profits in the long run shorter than maximizing shareholder wealth through investing in long-term profitable projects (Apriliani & Natalylova, 2017).
Tax Differential Theory
A theory which states that investors prefer a company that retains most of its profits because of dividend income are taxed at a higher rate than capital gains and this can result in negative wealth for shareholders. Company growth describes the percentage growth company posts from year to year. This ratio shows the percentage increase in sales this year compared to last year. The higher this ratio, the better.
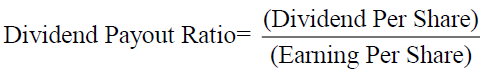
Dividend Policy
The definition of dividend policy is: The policy taken by company management to decide to pay a portion of the company's profits to shareholders instead of holding it as retained earnings to be invested in shareholders Gunawan, & Tobing (2018) rather than holding it as profit. Furthermore, the definition of dividend policy "dividend policy is an investment opportunity available, the availability and cost of alternative capital, and the preference of shareholders to receive current income or receive it in the future."
Corporate Social Responsibility
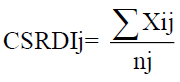
Corporate Social Responsibility (CSR) is a mechanism for an organization to voluntarily integrate environmental and social concerns into its operations and interactions with stakeholders, which exceeds organizational responsibility. In the field of law (Baidori, 2020). CSR disclosure is measured by CSRDI (Corporate Social Responsibility Disclosure Index) proxy based on indicators of GRI (Global Reporting Initiatives). The use of the GRI indicator due to the disclosure items contained in the GRI standards are international and have been recognized by many companies in the world. The measurement of the CSR disclosure index is carried out by method of content analysis (content analysis).
Free Cash Flow
Free cash flow is: Free cash flow measures financial performance calculated as operating cash flow minus capital expenditures. Free cash flow represents the cash that company is able to generate after laying out the money required to maintain or expand its asset base. Without cash, it's tough to develop new products, make acquisitions, pay dividends, and reduce debt.
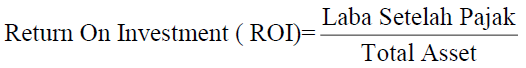
Profitability
Profitability is income for the current year and dividends from the previous year can affect dividend payments from the company. Profitability is the ability of a company to make a profit. The profitability ratio is a ratio to assess a company's ability to seek profit (Figure 1).

Figure 1 Research Design
Hypothesis
H1 : There is an effect of the Corporate Social Responsibility on the Dividend Policy
H2 : There is an effect of the Free Cash Flow on the Dividend Policy
H3: There is an effect of the Profitability on the Dividend Policy
H4: There is an effect of Corporate Social Responsibility, Free Cash Flow and Profitability on the Dividend Policy.
Research Methodology
Variable Operations
Variable Dependent (Y): Dividend Policy
Independent Variable (X): Corporate social responsibility (X1)
Free cash flow (X2); Operational Cash Flow = NOPAT+depreciation; Gross Investment = Investment Net+Depreciation; Free Cash Flow = Aliran Kas Operasional–Investasi Bruto Pada Modal Operasi; Free Cash Flow = NOPAT–Investasi Bersih Pada Modal Operasi; Profitability (X3).
Population and Sample
The population in this study are manufacturing companies listed on the Indonesia Stock Exchange in 2016-2020. While the sample of this study was determined by purposive sampling method in order to obtain 24 sample companies. In this analysis the company criteria used as examples are (1) Manufacturing companies listed on the Indonesia Stock Exchange released financial reports in 2016–2020 (2) In the presentation of the company’s financial statements using the rupiah currency (3) During the research year 2016 – 2020 the company did not experience any losses. (4) The company consistently distributes its dividends during the research year (Angelia & Toni, 2020).
Classic Assumption Test
Normality test
Normality test is done to see the data distributed normally or not. This research is using non-parametric Kolmogorov Smirnov statistic test. It is assumption that each variable normally distributed. If Sig. Asymp. Value (2-tailed) >0.05, it means data normally distributed.
Multicolinearity test
Multicolinearity test is a predictor where the independent variable was correlated each other. Multicolinearity test is used to test whether regression model was correlated among the independent variables or not.
Heteroscedasticity test
Heteroscedasticity test is used to test inequality variance from an observation residual to another observation residual. By using scatterplot pattern with ZPRED plot as a prediction value, and SRESID as a residual value. The regression is free from heteroscedasticity if there is no specific pattern in the scatterplot (Munawar, 2018).
Autocorrelation test
Autocorrelation testing aims to find out whether there is a correlation between the interruptions of the observation data from one observation to another in the linear regression model. A good regression model is one that does not occur.
Hypothesis Test
Simultaneous significant test (test statistic F)
The F test is a simultaneous regression relationship test which aims to determine whether all independent variables together have a significant effect on the dependent variable. This test is to determine the independent variables together significantly influence the dependent variable.
Partial test (test statistic t)
The t-test was used to partially test the hypothesis in order to show the effect of each independent variable individually on the dependent variable. The t-test is testing the regression coefficients of each independent variable on the dependent variable to find out how much influence the independent variable has on the dependent variable.
Coefficient of determination analysis (R2)
The coefficient of determination (R2) basically measures how far the model's ability to explain variations in the dependent variable is. The value of the coefficient of determination is between zero and one. R2 value that small shows the ability of the independent variable in explains very limited variables. In order to avoid this bias, the adjusted R2 value is used, where the adjusted R2 value can increase or decrease if there is an addition of one independent variable (Nerviana, 2016).
Results and Discussion
Descriptive Statistics
Based on Table 1, the results of descriptive statistical analysis are explained as follows:
| Table 1 Descriptive Statistical | ||||
| DPR | CSR | FCF | ROI | |
| Mean | 0.467182 | 0.244873 | 3.201811 | 0.142280 |
| Median | 0.344290 | 0.230770 | 0.543455 | 0.078710 |
| Maxium | 1.869160 | 0.384620 | 37.68300 | 0.688960 |
| Minimum | 0.074770 | 0.131870 | -1.853830 | 0.000500 |
| Std. Dev. | 0.368983 | 0.070935 | 6.469401 | 0.144864 |
| Observations | 120 | 120 | 120 | 120 |
1. The dependent variable dividend policy (DPR): The highest dividend policy in manufacturing companies of 1,869 occurs at PT Chitose International Tbk in 2020 and the lowest dividend policy of 0.075 occurred at PT Champion Pacific Indonesia Tbk in 2017. The average dividend policy in manufacturing companies was 0.467. The median value and standard deviation of dividend policy in manufacturing companies are 0.344 and 0.369, respectively.
2. Independent variable corporate social responsibility (CSR): The highest corporate social responsibility in manufacturing companies is 0.385 and the lowest corporate social responsibility is 0.132. The average corporate social responsibility in manufacturing companies is 0.245. The median value and standard deviation of corporate social responsibility in manufacturing companies are 0.231 and 0.071, respectively.
3. Independent variable free cash flow (FCF): The highest free cash flow in manufacturing companies of Rp. 37.68 trillion occurred at PT Astra International Tbk in 2020 and the lowest free cash flow of Rp. -1.85 trillion occurred at PT Kimia Farma Tbk in 2019. The average free cash flow in manufacturing companies is Rp. 3.20 trillion. The median value and standard deviation of free cash flow in manufacturing companies are Rp.543 billion and Rp.6.47 trillion, respectively.
4. Independent variable profitability (ROI): The highest profitability in manufacturing companies of 0.689 occurred at PT Supreme Cable Manufacturing Corporation Tbk in 2019 and the lowest profitability of 0.001 occurred at PT Chitose International Tbk in 2020. The average profitability in manufacturing companies was 0.142. The median value and standard deviation of profitability in manufacturing companies are 0.079 and 0.145, respectively.
Results of the Panel Data Regression Model Selection
The results of the Chow test in Table 2, show the probability value of the cross-section chi square of 0.0000 is smaller than alpha (0.05) so that Ha is accepted. So the appropriate method for conducting regression testing in this study is themodel fixed effect.
| Table 2 Chowtest Results | |||
| Effects Test | Statistics | df | Prob. |
| Cross-section F | 6.729803 | (23.93) | 0.0000 |
| Cross-section Chi-square | 117.595658 | 23 | 0.0000 |
| RedundantFixed Effects Tests Equation: Untitled Test cross-section fixed effects |
|||
Based on Table 3, it is known that the probability of cross-section random of 0.0724 is greater than alpha (0.05) so that Ho is accepted. So the appropriate method for conducting regression testing in research is themodel random effect.
| Table 3 Hausman Test | |||
| Test Summary | Chi-Sq. statistics | Chi-Sq. df | Prob |
| Cross-section random | 6.985518 | 3 | 0.0724 |
| Correlated Random Effects - Hausman Test Equation: Untitled Test cross-section fixed effects |
|||
Results of Panel Data Regression Model Selection
Based on the results of the model selection in Table 4, the Chow test shows that the best estimation method is the model fixed effect while the Hausman test shows the best model is the model random effect, so the Lagrange Multiplier test is carried out to show the best model for research The results of the Lagrange multiplier test show that the best estimation method is the model random effect, so the best estimation method used in this study is the model random effect.
| Table 4 Results of Model Selection | ||
| Testing | Hypothesis | Final Decision |
| Test Chow | Common Effect vs Fixed Effect | Fixed Effect |
| Hasuman Test | Random Effect vs Fixed Effect | Random Effect |
| LM Test | Common Effect vs Random Effect | Random Effect |
Classic Assumption Test
Multicollinearity test
Test results Table 5, shows the correlation coefficient between the independent variables corporate social responsibility (CSR), free cash flow (FCF) and profitability (ROI) is smaller (<) 0.80, so it can be concluded that the regression model and the three independent variables in the study did not have multicollinearity problems.
| Table 5 Multicollinearity Test | |||
| CSR | FCF | ROI | |
| CSR | 1 | 0.16660 | 0.39360 |
| FCF | 0.16660 | 1 | 0.09789 |
| ROI | 0.39360 | 0.09789 Multicollinearity | 1 |
Heteroscedasticity Test
Based on Table 6, it is known that the prob of each variable independentis corporate social responsibility (CSR), free cash flow (FCF) and profitability (ROI) has a value > alpha 0.05 of 0.8158, 0.3716 and 0.1644 so that it can be concluded that the regression model does not experience heteroscedasticity problems (Edi, 2018).
| Table 6 Heteroscedasticity Test Results | ||||
| Variable | Coefficient | Std. Error | t-Statistic | Prob. |
| C | 0.175836 | 0.072330 | 2.431022 | 0.0166 |
| CSR | -0.068642 | 0.293963 | -0.233506 | 0.8158 |
| FCF | -0.002825 | 0.003150 | -0.896921 | 0.3716 |
| ROI | 0.162159 | 0.115889 | 1.399263 | 0.1644 |
Autocorrelation Test
Based on Table 7, it is known that the value of dw is 1.9655 and the value of du in the Durbin Watson Table is 1.7536, so that a comparison of 1.7536<1.9655<2.2464 (4-1.7536) means that the data in the study does not experience problems autocorrelation.
| Table 7 Autocorrelation Test Results | |
| Durbin-Watson | DU |
| 1.9655 | 1.7536 |
| a = 5 % | N = 120, K = 3 |
Multiple Regression Analysis of Panel Data
Based on Table 8, the equation model using the method random effect can be formulated as follows:
| Table 8 Model Random Effect | |
| Variable | Coefficient |
| C | -1.190332 |
| CSR | 2.768935 |
| FCF | -0.002277 |
| ROI | 0.516618 |
DPR=-1.190+2.769 CSR-0.002 FCF+0.517 ROI
The above equation can be explained that:
1. Theconstant a is 1.190, meaning that if corporate social responsibility, free cash flow and profitability is 0, then dividend policy in manufacturing companies listed on the Indonesia Stock Exchange for the 2016- 2020 period of 1,190.
2. The coefficient of corporate social responsibility is 2,769, indicating that corporate social responsibility has a positive relationship to dividend policy. That is, if corporate social responsibility increases by 1 percent while other independent variables are fixed, then the dividend policy in manufacturing companies will increase by 276.9 percent.
3. The free cash flow coefficient is -0.002, indicating that free cash flow has a negative relationship with dividend policy. That is, if free cash flow decreases by 1 percent while other independent variables are fixed, then the dividend policy in manufacturing companies will increase by 0.02 percent.
4. The profitability coefficient is 0.517, indicating that profitability has a positive relationship to dividend policy. That is, if profitability increases by 1 percent while other independent variables are fixed, then the dividend policy in manufacturing companies will increase by 51.7 percent.
Hypothesis Test
T-test
Based on Table 9, the research hypothesis is:
| Table 9 T Statistical Test | ||||
| Variable | Coefficient | Std. Error | t-Statistic | Prob. |
| C | -1.190332 | 0.112666 | -10.56515 | 0.0000 |
| CSR | 2.768935 | 0.449392 | 6.161518 | 0.0000 |
| FCF | 0.004898 -0.464808 0.6429 | -0.002277 | ||
| ROI | 0.164723 3.136276 0.0022 | 0.516618 | ||
1. Hypothesis 1: Corporate social reponsibility positive effect and significant to dividend policy in manufacturing companies. The probability value of corporate social responsibility (CSR) <alpha 0.05 is 0.0000<0.05 and t count >t table is 6.1615>1.9806; this shows that corporate social responsibility has a significant effect on dividend policy. The regression coefficient of 2.769 indicates a positive direction. This means that corporate social responsibility has a positive and significant effect on dividend policy in manufacturing companies listed on the Indonesia Stock Exchange for the 2016-2020 periods. Based on statistical results, the first hypothesis proposed by the author is declared accepted.
2. Hypothesis 2: Free cash flow has a positive and significant effect on dividend policy in manufacturing companies. The probability value of free cash flow (FCF) >alpha 0.05 is 0.6429 >0.05 and t count < t table is 0.4648 < 1.9806, this shows that free cash flow has no significant effect on dividend policy. The regression coefficient of -0.002 indicates a negative direction. This means that free cash flow does not have a positive and significant effect on dividend policy in manufacturing companies listed on the Indonesia Stock Exchange for the 2016-2020 periods. Based on statistical results, the second hypothesis proposed by the author is declared rejected.
3. Hypothesis 3: Profitability has a positive and significant effect on dividend policy in manufacturing companies. Profitability probability value (ROI) <alpha 0.05 of 0.0022<0.05 and t count >t table of 3.1363>1.9806, this shows that profitability has a significant effect on dividend policy. The regression coefficient of 0.517 indicates a positive direction. This means that profitability has a positive and significant effect on dividend policy in manufacturing companies listed on the Indonesia Stock Exchange for the 2016-2020 periods. Based on the statistical results, the third hypothesis proposed by the author is declared accepted.
Simultaneous F-Test
Based on Table 10, the probability value of F-statistic is smaller than alpha (0.05) which is 0.0000 <0.05 and f count >f table is 19.37>2.68. This means that the independent variables of corporate social responsibility, free cash flow and profitability simultaneously affect the dividend policy of manufacturing companies listed on the Indonesia Stock Exchange for the 2016-2020 period in other words the model used in this study is appropriate/suitable for use.
| Table 10 Results of the F Statistic Test | |
| R-squared | 0.333791 |
| Adjusted R-squared | 0.316561 |
| SE of regression | 0.156464 |
| F-statistic | 19.37315 |
| Prob(F-statistic) | 0.000000 |
The Coefficient of Determination (R2)
Results the coefficient of determination in Table 11, shows the value of r square of 0.3338. The study used three independent variables, so the adjusted r square value was used to measure the effect of the independent variables on the dependent variable. The adjusted r square value of 0.3166 indicates that the proportion of the influence of corporate social responsibility, free cash flow and the profitability of dividend policy in manufacturing companies listed on the Indonesia Stock Exchange for the 2016-2020 period is 31.66 percent while the remaining 28.34 percent (100-31.66 percent) is influenced by other variables not examined in the study.
| Table 11 Coefficient of Determination (R2) | |
| R-squared | 0.333791 |
| Adjusted R-squared | 0.316561 |
| SE of regression | 0.156464 |
| F-statistic | 19.37315 |
| Prob(F-statistic) | 0.000000 |
Discussion
The Effect of Corporate Social Responsibility on Dividend Policy
The results of the research that have been carried out show the probability value of the corporate social responsibility (CSR) variable <critical probability value (α=5%) of 0.0000<0.05 and the value of t count >t table of 6.1615>1.9806, which shows that corporate social responsibility has a significant effect on dividend policy in manufacturing companies. The regression coefficient of corporate social responsibility shows a positive sign, where the higher the implementation of corporate social responsibility in the company, the greater the dividends that will be given to investors.
The Effect of Free Cash Flow on Dividend Policy
The results of the research that have been carried out show the probability value of the free cash flow (FCF) variable > the critical probability value (α=5%) of 0.6429>0.05 and the value of t count < t table of 0.4648<1.9806, which shows that free cash flow has no significant effect on dividend policy in manufacturing companies. The regression coefficient for free cash flow shows a negative sign, where the lower the free cash flow in the company, the greater the dividends that will be given to investors.
The Effect of Profitability on Dividend Policy
The results of the research that have been carried out show the probability value of the profitability variable (CSR) < critical probability value (α=5%) of 0.0022< 0.05 and the value of t arithmetic >t table of 3.1363 >1.9806, which indicates that profitability significant effect on dividend policy in manufacturing companies. The profitability regression coefficient shows a positive sign, where the higher the profitability of the company, the greater the dividends that will be given to investors.
Conclusion
1. Corporate social responsibility has a positive and significant effect on dividend policy in manufacturing companies.
2. Free cash flow has no positive and significant effect on dividend policy in manufacturing companies.
3. Profitability has a positive and significant effect on dividend policy in manufacturing companies.
4. Corporate social responsibility, free cash flow and profitability on dividend policy in manufacturing companies listed on the Indonesia Stock Exchange for the 2016-2020 periods have an influence of 21.14 percent. This means, the higher the company that implements corporate social responsibility, the low free cash flow and has a high profitability value, the greater the dividends that will be given to investors.
Implication
1 The theoretical implications for academics interested in the effects of corporate social responsibility, free cash flow and profitability to dividend policy. This research can also be done with a longer period of time and take a larger number of samples from this study so that it can produce better conclusions. This further research should consider other factors.
2 This research is expected to be a consideration for companies to look more at other factors in the company that can reduce dividend policy and investors if they want to invest in a company so that investors do not experience losses.
Suggestion
1. For further researchers, the data on the variables used should be given further attention so that the findings obtained are relatively good.
2. For further researchers, it is better to add variables which are rarely used in research, both internal variables and external variables that affect dividend policy.
References
Ahmad, G. N., Dewi, F. A., & Mardiyati, U. (2016). The influence of market to book value, annual tax, and risk towards dividend policy in banking company listed in Indonesia stock eexchange (IDX) Period 2010-2014. JRMSI-Jurnal Riset Manajemen Sains Indonesia, 7(1), 157-175.
Indexed at, Google Scholar, Cross Ref
Angelia, N., & Toni, N. (2020). The analysis of factors affecting dividend policy in food and beverage sector manufacturing companies listed in indonesia stock exchange in 2015-2017. Budapest International Research and Critics Institute-Journal (BIRCI-Journal), 902-910.
Indexed at, Google Scholar, Cross Ref
Apriliani, A., & Natalylova, K. (2017). Factors affecting dividend policy in manufacturing companies on the indonesia stock exchange. Journal of Business and Accounting, 19(1a-1), 49-57.
Baidori, B. (2020). Pengaruh insider ownership, collateralizable assets, growth in net assets and liquidity on dividend policy in manufacturing companies listed on the indonesia stock exchange for the period 2002–2006. Journal Application Management, 6(3), 474-482.
Bangun, N., Yuniarwati, Y., & Santioso, L. (2018). The influence of corporate governance, profitability, and foreign ownership on dividend policy in manufacturing companies listed on the Indonesia stock exchange 2014-2016. Accounting Journal, 22(2), 279-288.
Edi, W.A.N. (2018). Analysis of the influence of liquidity ratio, Leverage, profitability and ownership ratio managerial on dividend policy.
Indexed at, Google Scholar, Cross Ref
Gunawan, F. S., & Tobing, W. R. (2018). The effect of profitability, liquidity and investment opportunities on dividend policy. South East Asia Journal of Contemporary Business, Economics and Law, 15(5), 189-195.
Jayanti, I. S. D., & Puspitasari, A. F. (2017). Ownership structures and dividend policy in manufacturing companies in Indonesia. TIJAB (The International Journal of Applied Business), 1(1), 1-13.
Indexed at, Google Scholar, Cross Ref
Krisardiyansah. (2020). The effect of free cash flow, profitability, liquidity and leverage on dividend policy.
Munawar, A. (2018). The effect of leverage, dividend policy, effectiveness, efficiency, and firm size on firm value in plantation companies listed on IDX. International Journal of Science and Research, 8(10), 244-252.
Nerviana, R. (2016). The effect of financial ratios and company size on dividend policy. The Indonesian Accounting Review, 5(1), 23-32.
Indexed at, Google Scholar, Cross Ref
Suryarini, T. (2018). The effect of leverage and liquidity on cash dividend policy with profitability as moderator moderating. Accounting Analysis Journal, 7(1), 10-16.
Received: 07-Oct-2021, Manuscript No. JLERI-21-8796; Editor assigned: 09-Oct-2021, PreQC No. JLERI-21-8796(PQ); Reviewed: 23- Oct-2021, QC No. JLERI-21-8796; Revised: 23-Feb-2022, Manuscript No. JLERI-21-8796(R); Published: 02-Mar-2022