Original Articles: 2017 Vol: 16 Issue: 1
Analysis of Cross Border Acquisitions by Indian Information Technology Sector Firms (Part-1)
Anand Gaurav Chandrawanshi, Maulana Azad National Institute of Technology, Bhopal
Amit Banerji, Maulana Azad National Institute of Technology, Bhopal
Introduction
India happened to be among the top ten Outward Foreign Direct Investment sources in the period 2000-2007 and by 2008 India had become almost net outward Foreign Direct Investor country Chandrawanshi and Banerji (2014); Indian Outward Foreign Direct Investment has been a natural extension of their core competence developed over the decades. These core competencies were developed with increment growth in efficiencies and also a result of globalisation because of which Indian firms were exposed to global competition. Indian MNCs post liberalisation (1991) changed the course of business and turned to strategy of inorganic growth along with organic growth strategy, the former encouraged them to go outside geographical boundaries to seek new markets, technical know-how and strategic assets. A major change of shift of OFDI from manufacturing to services was observed during 2000, and Information Technology & Information Technology Enabled Services sector emerged as a sector with largest OFDI through Mergers and Acquisitions (M&As) activity.
Figure-1 shows trend of OFDI from India for last decade. There is a rise from 2001 to 2014 with CAGR of 22%, and highest recorded in 2009(Rs. 905 Bn.), followed by 2011(Rs. 782.57 Bn.). Sector wise distribution of OFDI from India indicates, companies from IT & ITES sector entered in maximum deals from 2005 to 2014 followed by Pharmaceutical sector (Grant Thornton 2014).

Figure 1.Outward Foreign Investment from India.
This trend of inorganic growth strategy by Indian firms motivated numerous researchers to look into the outcome of such cross border M&A activity in terms of profitability and other factors; whether Indian firms have been successful in achieving their targets though this route. To look into the issue, in this study, previous studies which were done globally and at domestic level were studied and then problems of existing methodologies were addressed. This study is however limited to financial aspect of M&A activity. Various studies have given varied outcomes and results. Some studies found, that acquisitions were not beneficial for them, and in some it was observed have a positive impact on profitability.
Literature Review
Numerous studies have been conducted to study the impact of M&As on performance of organizations which have undergone mergers and/or acquisitions, either in domestic or cross border. Extant studies have used following methodologies in more or less similar manner to study the impact of acquisition which are as follows(Table 1):
| Table 1: Literature Review | |||
| Author(s) | Study Period | Event Window | Inference |
|---|---|---|---|
| Asquith (1983) | 1962-1976 | (-1,0) | For a sample of 196 firms, positive abnormal returns were found for firms where targets were large (target firm’s equity is greater than 10%). |
| Healy et al (1990) | 1979-1983 | (-5,5) | Sample of 50 largest mergers; found positive announcement returns and increase in operating cash flow. |
| Agrawal et al (1992) | 1955-1987 | (0, 5 years) | Stockholders of acquiring firms had a statistically significant wealth loss of 10% over five years post-merger completion. |
| Kaplan and Weisbach (1992) | 1971-1982 | (-5,5) | 44% of large acquisition divested (acquired firms were sold off), however, among them 42% gained from selling off, and 34% of the divested acquisitions were considered unsuccessful, during the period of study (1971-1982) for a sample of 271 mergers and tender offers. The returns of acquiring firms were found lower concurrent with results of previous studies. |
| Rau and Vermaelen(1998) | 1980-1991 | (0,3 years) | Acquiring firms show negative abnormal returns and firms with tender offers show statistically significant but low positive abnormal returns. It was also observed that firms with low book-to-market ratio underperform as compared to high book-to-market ratio firms. |
| Cames et al (2001) | 1985-1995 | (0, 3 years to 5 years) | Cross border acquisitions observed to be value destroying activity for 361 US firms. Abnormal returns were found to be significantly negative for both three and five years’ period. It was observed that post announcement returns did not influence long term returns for acquirer firms. |
| Sudarsanam and Gao (2003) | 1990-1999 | (0, 3 years) | 386 M&As of high technology industry firms (Biotechnology, IT, Communication, Others) of UK for the period of 1990- 1999, looking for the strategic growth motives for undergoing M&A activities. The study observed that in long term, these acquisitions resulted shareholder’s value going down. |
| Moeller et al (2003) | 1980-2001 | (-1,1) | For a sample of 12023 firms, size of firm influenced abnormal returns of announcement of acquisition and it was found that small firms benefited with abnormal returns as compared to large firms in long run. It was also observed that mode of financing does not influence abnormal returns. |
| Conn and Cosh (2003) | 1984-1998 | (0,3 years) | In case of cross border acquisitions in high tech industries there were positive announcement returns and long term returns and for non-high tech firms there were negative post-acquisition returns. |
| Andre et al (2004) | 1998-2000 | N.A. | Decline in performance in the long run for both domestic and cross border acquisitions. The study had sample of 267 acquisitions done by 176 Canadian firms. |
| Schoenberg (2006) | 1988-1990 | (-10, 10) | Observed success rate of 50 % for acquisitions under four measures of post-acquisition performance Cumulative Abnormal returns (CAR), Managers Subjective Assessments, Experts informants’ subjective assessments, & Divestment Data. CAR of the acquiring firms was observed to be -0.02%. |
| Boateng et al (2008) | 2000-2004 | (-20,20) | CAR and Daily Abnormal Returns were value creating for the firms after acquisition announcement. In short run it was observed that sample firms had overall average positive CAR of 4.4274% (statistically significant at the 5 percent level). |
| Dutta and Jog (2009) | 1993-2002 | (-1 year , 3 years) | 1300 M&A events of Australian firms for the long run post-acquisition found inconsistent results with previous studies of negative abnormal returns for the acquirer firms. The study also argued that results of such studies may be a result of methodology adopted and techniques used. The study used both event time(Buy and Hold abnormal return) and a calendar-time approach (Fama and French 3 factor regression) and robustness test were also done for finding concrete results. |
| Kyriazis(2010) | 1993-2006 | (0, 3 years) | Average negative abnormal returns of 2% per month of the acquiring firms stocks over three years post-acquisition period. The study was based on 3-factor model given by Fama and French (1993). |
| Akben-Selcuk & Altio (2011) | 2003-2007 | (-5, 5) | A sample of 62 Turkish companies which were involved in M&A, found positive abnormal returns. |
| INDIAN STUDIES | |||
| Chakrabarti (2008) | 2000-2007 | (-1,+1) and (0, 3 years) | In the case of announcement or short run analysis, an increase in shareholders wealth of acquirer firms was observed (CAR was found 2.54%) . “The long run post-acquisition returns were positive but they were value reducing as compared to their previous returns”. |
| Delios et al (2009) | 1986-2006 | (-7,7) | Majority of firms in sample had a positive CAR between 2% - 3% for their stocks after the acquisition announcement. |
| Kohli & Mann (2012) |
1997-2008 | (-50,50) | Announcement returns for Indian cross border and domestic M&As for sample of 202 cross border and 68 domestic acquisitions, and found they created value for shareholders’ in short run. Cross border acquisition announcements created more value comparatively. The factors which influenced the returns were that technology intensive sector firms outperformed non technology sector target firms. |
| Mallikarjunappa and Nayak (2013) | 1998-2007 | A sample of 227 target companies and Abnormal Returns, Average Abnormal Returns and Cumulative Average Abnormal Returns were studied for 61 day window of announcement of M&A activity. It was found that shareholders’ of the target companies benefited with the M&A activity. | |
1) Event Study Methodology
2) Accounting returns analysis
3) Economic Value Added Analysis
4) Combined studies of Event study and Accounting return analysis
Event Study Methodology
In this methodology, studies were done to find the abnormal returns gained by shareholders as a result of acquisition announcement news and also in long run on shareholder’s wealth. Studies were also done regarding the profitability of the acquired firms.
Accounting Return Analysis
The studies conducted using this methodology looked in the post acquisition financial performance of acquiring firms through evaluating financial and profitability measures viz. Operating cash flow, Return on Assets, Returns on Equity, Returns on Net Worth, Return on Capital Employed etc. If is there a positive change in these measures of profitability in post acquisition period. Another approach which is followed is to compare the pre and post acquisition financial ratios to have a view, if there is a significant change in above said measures as a result of M&A activity.
Economic Value Added Analysis
EVA is an indicator developed by the Stern Stewart & CO., a consulting firm Kan & Ohno (2012). In acquiring firm as a result of M&A activity has been proposed by some researchers, EVA is the balance of capital earnings of an enterprise or its business segment in a certain period minus investment cost Xue S and Yang D (2006)(Table 2 and 3).
| Table 2: Literature Review |
||
| Author(s) | Study Period | Inference |
|---|---|---|
| Meeks(1977), (cited from Bruner 2002) | 1964-1972 | Decline in profitability of acquiring firms in terms of ROA following five years of acquisition was found and two third of sample demonstrated lower performance as compared to industry standard |
| Mueller (1980), (cited from Bruner 2002) | 1962-1972 | Post-acquisition profitability of sample firms was compared with pre acquisition profitability and no significant difference was observed. It was also found that non-acquiring firms performed better than their acquiring counterparts during the period of observation. |
| Ravenscraft and Scherer (1987), (cited from Bruner 2002) | 1950-1977 | Observed significant negative relationship between operating ROA and tender offer activity. Firms with tender offer activity were found 3.1% less profitable than firms without activity. |
| Healy et al (1992), (cited from Bruner 2002) | 1979-1984 | Asset productivity improved post-acquisition which improved operating cash flow in 50 sample firms of study as compared to their industry peers. Authors argued that operating cash flow improvement associated with announcement returns of stock on the merging firms. |
| Sharma & Ho (2002) | 1986-1999 | For a sample of 36 Australian acquisitions, it was observed that post-acquisition performance did not significantly improve for the sample firms during the observation period. It was also found that mode of financing or type of acquisition (conglomerate and non-conglomerate) does not significantly affect measures of post-acquisition operating performance. |
| Bertrand and Betschinger (2012) | 1999-2008 | Studied 120 acquisitions by Russian firms and found the acquiring firms’ profitability declined in both domestic and cross border acquisitions |
| Oduro and Ageyi (2013) | 1999-2010 | For sample of five firms involved in M&A activity, listed on Ghana Stock exchange experienced decreased profitability. The study observed that post-merger profitability (ROA and ROE) decreased as compared to pre-merger. |
| Bortoluzzo et al (2014) | 1994-2008 | Firms which undertook cross border acquisitions gain financial synergies and improvement in financial performance. Companies experienced improved financial performance till third acquisition and then a decline in performance was observed. |
| Abbas et al (2014) | 2006-20011 | Observed no significant change in performance of acquiring banks, for sample of 10 banks in Pakistan. |
| Ashfaq(2014) | 2000-2009 | Relative performance of firms deteriorated (insignificantly) after M&A activity; also the absolute performance of firms deteriorated, for sample of 16 firms of non-financial sectors (textile, pharmaceutical, cement, automobile, electronics) |
| Inoti et al (2014) | 2001-2010 | Observed no improvement in post-merger financial performance for a sample of 11 Kenyan listed firms. |
| INDIAN STUDIES | ||
| Pawaskar(2001) | 1992-1995 | For a sample of 36 domestic acquisitions, It was found that post-merger profitability did not improve for the acquirer firms, but size of assets and financial synergies increased Comparing the performance of the firms involved in merger with a firm which was not involved in merger showed that if no merger had taken place, the post-merger period profitability would have improved. |
| Mantravadi and Reddy (2008) | 1991-2003 | Firms from some industries (Banking & Finance, Pharmaceuticals) experienced improved performance post-merger and performance of firms of some industries declined (Agri-Products, Chemical, Electrical, Textile). |
| Ramakrishnan (2008) | 1996-2002 | Financial performance of firms had improved as compared to the pre-merger period. The study also observed that pre-merger performance significantly influences post-merger performance. |
| Kumar (2009) | 1999-2002 | For sample of 30 firms, found no improvement in post-merger performance of sample firms, although the study used ROCE, asset turnover ratio and solvency ratio for measuring post-merger profitability. All three measures show slight change in post-merger period but all the results were statistically insignificant. |
| Saboo and Gopi (2009) | 2000-2007 | Sample firms improved financial performance in domestic case and a decline was observed in case of cross border acquisitions. |
| Mishra and Chandra (2010) | 2001-2008 | For sample of 52 firms in pharmaceutical sector observed there is no significant effect of M&A on the profitability of firms. |
| Sinha and Gupta (2011) | 1993-2010 | Analyzed 80 cases of acquisitions and mergers in Indian Banking industry(both inbound and outbound), and found that liquidity of the firms decreased three years after merger and profitability was observed to increase in majority of cases. |
| Leepsa & Mishra(2012) | 2001-2010 | Liquidity of acquirer firms was found to decline and profitability increased. In case of relatively large sized target firms’ performance declined. For large size firms, profitability and liquidity improved and for small size firms there was an increase in both but statistically insignificant. |
| Kohli (2013) | 1997-2008 | Found a significant increase in profitability after acquisition on acquiring firms by comparing pre and post profitability ratios for sample of domestic M&A activity of 20 listed Indian firms. |
| Verma & Sharma (2014) | 2002-2008 | For a sample of 59 Indian telecom industry acquisitions, the operating performance variables did not showed any improvement after the M&A. |
| Rani et al (2015) | 2003-2008 | Observed an increase in financial performance of firms post M&A. The authors also analysed in terms of DuPont analysis and found higher profit is generated per unit net sales by the acquiring firms after the M&A. The higher profits (profit before interest and taxes and non-operating income) are generated primarily due to the better operating margins. |
| Tripathi and Lamba (2015) | 1998-2007 | For a sample of 272 foreign M&As done by Indian listed firms, concluded that profitability, liquidity and solvency declined after merger but the size of the acquiring firm is increased. |
| Table 3 : Literature Review | ||
| Author(s) | Year of Study | Inference |
|---|---|---|
| Sirower and O’Byrne | 1998 | Linked stock market returns of acquisition announcements and found high correlation among stock market predictions and operating performance of acquiring firms. The authors developed a benchmark, which can be used to measure the effects of acquisition on acquirer firm’s improvement in EVA. |
| Leepsa | 2015 | York (2004) using EVA as performance measure found that the operating performance declines after the acquisition similar to the performance of other companies in the industry. |
| Xiao & Tan | 2009 | EVA increased post-acquisition as compared to pre-merger and thus the firm’s performance can be stated to improve significantly in short term (when 2 and 3 years post M&A is compared with one year pre M&A i.e. 2001), but in long term i.e. 4 years after M&A the results were statistically insignificant. |
| Kan & Ohno | 2012 | Studied effects of merger on banking sector and found not all mergers resulted in improvement in EVA. It was also found that improvement comes gradually after merger not immediately. The authors found significant impact of merger after 5 years of activity. The period of study was 1989-2008. |
| Singh et al | 2012 | The cross border acquisitions made by Indian firms are value destroying. |
Combined Studies Of Event Study And Accounting Return Analysis
Some of the researchers tried to analyse cross border deals using both Event Study and Accounting Return Analysis to get a better understanding of acquisition’s impact in short run and long run as well(Table 4).
| TABLE-4 Literature Review | ||
| Author(s) | Year of Study | Inference |
|---|---|---|
| Faktorovich | 2008 | Compared domestic and cross border deals done by US firms and found that cross |
| border deals lag behind domestic ones in respect of profitability; 1 to 3 years post | ||
| acquisition. Also foreign deals performed below industry average in terms of | ||
| profitability. For stock market returns analysis, author concluded that cross border | ||
| deals outperformed domestic deal as far as five days returns of deal announcement is | ||
| concerned, and the factors which resulted this were the size of both acquirer and | ||
| target firms. | ||
| Chen and Lin | 2009 | Studied 42 cross border deals made by 31 Chinese firms and found only 50 % of the |
| sample firms showed improved performance after acquisition. Event study | ||
| methodology of same sample helped authors in concluding that the announcement of | ||
| such deals resulted in positive abnormal returns to shareholders. A regression run for | ||
| analysing possible variables which influence the CAR of firms was done, and a | ||
| result it was observed, state owned firms negatively impacted as they lacked | ||
| international experience. It was stated, “consistent with the findings by KPMG, | ||
| acquirers with lower P/E ratio and of smaller market capitalization (size) tended to | ||
| be more successful in these cross-border M&A deals, at 1% significance level. | ||
| Acquiring companies with low P/Es might not be as tempting to engage in deals | ||
| with higher risks since their stocks were undervalued in the market. Acquiring | ||
| companies with high P/Es, which were more likely to have already overvalued | ||
| stocks at the time of the deal, would have a more difficult time to further increase | ||
| the value of their stocks after a transaction” (Chen &Lin 2009). It was observed that | ||
| previous experience of acquirers also had a positive impact on returns of sample | ||
| deals. | ||
| Akben-Seluck and Altiok | 2011 | Concluded, stock returns of announcement of deals were above industry average, |
| and accounting returns study suggested that for acquirer companies in sample, post | ||
| acquisition performance declined as compared to pre-acquisition. Sample taken was | ||
| of 62 Turkish companies which acquired various companies during 2003-2007. | ||
Research Methodolgy
Data Sample
The impact of M&A depends on both internal and external environmental factors. Internal environmental factors involve resources and performance of acquiring firm, and external environmental factors include economic growth and degree of competition at home country, changes of political and cultural environment of host country etc Changqi & Ningling (2010). From the review of literature done in study, following research gaps were observed.
1) Not all the studies have exclusively studied cross border acquisitions made by Indian firms.
2) It is not certain that, the sample firms studied had not went for such any other inorganic activity viz. M&A or started any new venture or facility in any country in years following acquisition or any external environment factor viz. changes in government policy, tax rates, foreign currency exchange rates to say a few have affected the firm’s performance. Therefore, it is not necessary that the increase or decline in profitability is solely due to the M&A activity studied.
Thus this study attempts to find the impact of acquisition made by acquired firm on acquiring firm by looking into the contribution made by former on latter in terms of growth of Net Profit and whether the acquisition benefited the acquiring firm on profitability parameters viz., Net Profit Margin, ROA, ROE in long run i.e. 3 years post acquisition. For this purpose financial data of the acquiring companies is taken from the annual reports of relevant years using consolidated financial statements. All monetary figures are in Rupees Crore (1 Crore= 10 Million). The firms were shortlisted under two criteria:
1) Acquiring firm should be a public company listed in Indian Stock Exchanges, the reason for taking these firms are
a. Study is about OFDI from India
b. Public limited firms have the wherewithal to raise funds for acquisitions.
2) Acquisition should have been made during period of 2007 & 2008 or earlier but not before 2000, and not post 2008 because post 2008 deals will lead to insufficiency of data points.
Considering the above criteria, following deals were found, the source for information was Dealtracker published by Grant Thornton India of relevant years.
| TABLE 5 | ||||
| S.No. | Acquirer | Acquired | Year of Acquisition | Deal Size (US Million $) |
|---|---|---|---|---|
| HCL Technologies Limited | Liberata Financial Services | 2008 | 2 | |
| Mastek Technologies | Vector Insurance | 2007 | 9 | |
| MPhasis Technologies | Princeton | 2005 | 15 | |
| MPhasis Technologies | Eldorado | 2005 | 16.5 | |
| HCL Technologies Limited | Control Point Systems | 2008 | 21 | |
| Tata Consultancy Services | Comicron | 2006 | 23 | |
| Infosys Technologies | Expert Information Systems | 2003 | 24.9 | |
| NIIT Technologies | Room Solutions | 2007 | 25 | |
| 3i Infotech | J&B Software Inc | 2007 | 25.25 | |
| Tata Consultancy Services | Financial Network Services | 2006 | 26 | |
| Wipro Technologies | American Management Systems | 2002 | 26 | |
| Infosys Technologies | P-Financial Services Holdings B.V | 2008 | 28 | |
| Wipro Technologies | mPower | 2003 | 28 | |
| Mastek Ltd | Systems Task Group | 2008 | 29 | |
| Firstsource Technologies | BPM | 2007 | 30 | |
| Satyam Computers | Bridge Strategy Group | 2008 | 34.4 | |
| Mascon Global Ltd | Ebusinessware Inc | 2008 | 35 | |
| Hexaware Technologies | FocusFrame | 2006 | 35 | |
| HCL Technologies Ltd. | CapitalStream | 2008 | 39.5 | |
| Rolta India Ltd | TUSC | 2008 | 45 | |
| Quintegra Solutions | PA Corporation | 2007 | 49 | |
| Mascon Global Ltd | Jass & Associates Inc & SDG Corporation | 2008 | 55 | |
| Accentia Technologies | GSR Physicians | 2007 | 63 | |
| Megasoft Limited | Boston Consulting Group Inc. | 2007 | 65 | |
| Accentia Technologies | DenMed | 2007 | 66 | |
| 3i Infotech | Regulus Group | 2008 | 80 | |
| Tata Consultancy Services | TKS- TeknoSoft | 2007 | 80 | |
| HOV Services | BPO Lason | 2007 | 108 | |
| Subex Technologies Limited | Azure | 2007 | 140 | |
| Subex Azure Limited | Syndesis Limited | 2007 | 164.5 | |
| Firstsource Technologies | MedAssist | 2006 | 330 | |
| Wipro Technologies | InfoCrossing | 2007 | 600 | |
| HCL Technologies Limited | Axon Group plc | 2008 | 750 | |
| NIIT Technologies | Softec GmBh | 2008 | N.A. | |
Out of the shortlisted deals mentioned in Table-5, deals illustrated in Table-6 were considered for final sample because, in rest of the acquisitions identified the acquired companies were either merged into other subsidiary of acquiring company or were liquidated in short span of time (2 or 3 years), as a result data points were not available for analysis.
|
TABLE-6 |
||||
| S.No. | Acquirer | Acquired | Year of Acquisition | Deal Size (US Million |
| 1 | HCL Technologies Limited | Liberata Financial Services | 2008 | 2 |
| 2 | MPhasis Limited | Princeton | 2005 | 15 |
| 3 | HCL Technologies Limited | Control Point Systems | 2008 | 21 |
| 4 | Tata Consultancy Services | Comicron | 2006 | 23 |
| 5 | Infosys Technologies | Expert Information Systems | 2003 | 24.9 |
| 6 | NIIT Technologies | Room Solutions | 2007 | 25 |
| 7 | Tata Consultancy Services | Financial Network Services | 2006 | 26 |
| 8 | Megasoft Limited | Boston Consulting Group Inc | 2007 | 65 |
| 9 | Tata Consultancy Services | TKS- TeknoSoft | 2007 | 80 |
| 10 | Subex Technologies Limited | Azure | 2007 | 140 |
| 11 | Subex Azure Limited | Syndesis Limited | 2007 | 164.5 |
| 12 | FirstSource Limited | MedAssist | 2006 | 330 |
| 13 | HCL Technologies Limited | Axon Group plc | 2008 | 750 |
| 14 | NIIT Technologies | Softec GmBh | 2008 | N.A. |
| Source: Dealtracker and Saxena & Sen (2013) | ||||
Out of the deals listed inTable-6, the final eight deals selected for publication purpose are illustrated in Table-7.
| TABLE-7 | ||||
| S.no | Acquirer | Acquired Company | Year of Acquisition | Deal Size (in Million Dollars) |
|---|---|---|---|---|
| 1 | Tata Consultancy Services | Comicron | 2006 | 23 |
| 2 | Tata Consultancy Services | Financial Network Services | 2006 | 26 |
| 3 | Tata Consultancy Services | TKS- TeknoSoft | 2007 | 80 |
| 4 | Infosys Technologies | Expert Information Systems | 2003 | 24.9 |
| 5 | MPhasis Limited | Princeton | 2005 | 15 |
| 6 | Subex Technologies Limited | Azure | 2007 | 140 |
| 7 | Subex Azure Limited | Syndesis Limited | 2007 | 164.50 |
| 8 | Firstsource Limited | MedAssist | 2006 | 330 |
|
Source: Dealtracker and Saxena & Sen (2013) |
||||
For this part the following deals are included
1. Tata Consultancy Services acquired Comicron
2. Tata Consultancy Services acquired Financial Network Services
3. Tata Consultancy Services acquired TKS- TeknoSoft
4. Infosys Technologies acquired Expert Information Systems
Methodology
Methodology for this study consists of two measures for analysing the impact of acquired firm on acquiring firm. In the first part a statistical model is developed which attempts to find relationship between rate of Net Profit of acquired firms with the rate of change Net Profit of acquiring firm, and secondly Profitability analysis is done for analysing what are the repercussions of acquisition on the acquired firm post acquisition.
Statistical Model
For finding the contribution of acquired firm, firstly, this study attempts to find the relationship between rate of change of Net Profit of acquiring firm and acquired firm(s), by developing a model which establishes the relationship between parameters. For this purpose Ordinary Least Square (OLS) is used as Statistical tool. Software Packages SPSS 19 and EViews 7 were used. In the model, rate of change of Net Profit of acquiring firm is taken as Dependent Variable, starting from 2 years after acquisition till year 2014 and in some cases 2015, and rate of change of Net Profit of acquired firm is taken as Independent Variable. The reason for taking such parameters is, during the year of acquisition, firm may be in burden of heavy cash outflow or debt taken for purpose of conducting acquisition, so two years time is believed to be required for integrating the acquired firm completely. Another reason for taking Net Profit as a parameter is, it reflects the actual earnings made from investments made by any firm. Changqi & Ningling (2010), in their study used ROA as dependent variable to study the impact of cross border acquisition on firms and stated “The reason for using ROA of the two year after M & A is that, in the literature, it is generally accepted that mergers and acquisitions performance cannot be shown immediately until the second year after; costs typically increase in the year of mergers and acquisitions and the first year after it is an integration period when a lot of investments are still needed. So, ROAs in these two years are not good indicators.”
This study takes rate of change of Net Profit of acquiring and acquired firms as dependent and independent variables, which are derived as following
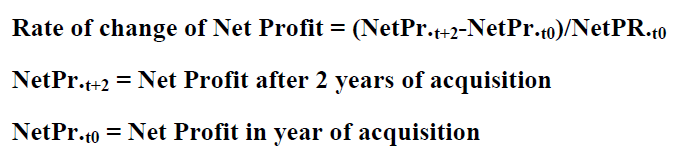
Similarly for years following acquisition variables are derived till 2014, for instance
 is Net Profit growth after 3 years of acquisition and so on.
1) Since the availability of data points were limited, the variables were Detrended only. Detrending was achieved by Polynomial fit through MS-Excel. Levin & Rubin (1997).
2) Further transformation of the variables was undertaken separately for each deal to achieve best fit model under OLS. Transformation of Dependent and Independent variables is based on the requirement of statistical results and according to it variables are transformed as NewX2, LnNewX, NewY, LnNewY etc. Durbin Watson Statistic must be in zone of no auto correlation or inconclusive Inconclusive (DW= 1.08 -1.36), No Auto Correlation (DW= 1.36-2.64) Bajpai (2010)
3) The significance of OLS being less than 10% preferably less than 5%.
4) Unstandardised coefficient with more than or 95% confidence not to range from positive to negative.
Profitability Analysis
For the profitability analysis, this study first looks into the contribution of acquired company in terms of revenues generated through it, as it reflects how much share does the acquired company has in the revenues of acquiring company. Further, this study looked in the contribution made by acquired firm, at the segmental level of the acquiring firm.
From the profitability point of view, how much the acquisition has impacted the acquiring firm, taking revenues only in consideration, is insufficient, so, ratio analysis of the acquiring firm has been done. Some international studies, Sharma & Ho (2002), Bertrand and Betschinger 2012, Oduro and Ageyi (2013), Bortoluzzo et al (2014) etc studied pre and post merger profitability. In Indian context Mantravadi and Reddy (2008), Ramakrishnan (2008), Saboo and Gopi(2009) etc studied pre and post M&A profitability for acquiring companies. The above studies have compared pre and post M&A ratios for analysing the impact of M&A. This study looks in profitability measures for acquiring firms 2 years before the acquisition and 3 years post acquisition period, to assess the impact of M&A in long run and also calculates CAGR of the ratios from year of acquisition to 3 years post M&A. This study uses only absolute financial data for analysis, derived from annual reports of companies under study.
For measuring overall profitability, Return on Equity (ROE) is taken as tool, which is universally accepted ratio for measuring profitability. ROE reflects how well the returns are generated on the shareholders’ money. For looking more into profitability ROE is decomposed using Du Pont analysis. DuPont Analysis breaks ROE into Return on Assets (ROA), Net Profit Margin, Asset Turnover and Financial Leverage, this technique was introduced by Du Pont Corporation. Using Du Pont Analysis it is possible to get a clearer picture of post M&As profitability, i.e. whether profit margin, asset turnover or Equity Multiplier has been improved or deteriorated post M&A. This study uses absolute values of components used in analysis. For assets, this study uses Gross Block of Assets given in Balance sheets of relevant acquiring companies retrieved from Annual reports of companies of relevant years Palepu & Healy (2014).

ROA, tells how the company has utilised its assets in generation of profits, as with acquisition there is certainly an increase in assets of acquiring firm, Financial Leverage on the other hand depicts, the usage of each rupee generated on account of shareholder’s investment.
The ROA can further decomposed as
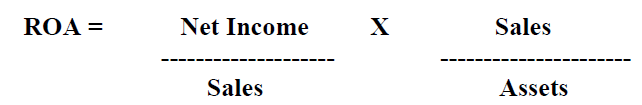
Net Profit Margin, Asset Turnover, ROA, Equity Multiplier and ROE of the acquiring companies depicts the impact of M&A post acquisition, as because of which factor the performance of acquiring company improved or deteriorated.
Results and Discussion
In this section, overall results of statistical analysis and profitability analysis of all the deals are presented, as shown in table- ; statistical model highlights of all deals studied are presented in Table-8.
| TABLE-8 : Statistical Results | ||||||||
| Deal | Dependent Variable | Independent Variable(s) | Unstandarized Coefficient | Coefficient | r | R2 | F-Stat | D.W. Stat |
|---|---|---|---|---|---|---|---|---|
| TCS acquired Comicron | NewY | Age | -3.249 | 0.249* | 0.96 | 0.92 | 43.268 | 2.705 |
| TCS acquired FNS Australia | NewY | Age | -3.249 | 0.249* | 0.95 | 0.91 | 43.268 | 1.795 |
| TCS acquired Teknosoft | NewY | NewX2 | -109.228 | -4.389* | 0.95 | 0.97 | 50.129 | 2.443 |
| Infosys acquired Expert Information Services | NewY | Ln NewX, NewX2 | -1232.335** | 48.189*, - 5.343E- 022* | 0.983 | 0.966 | 56.084 | 2.230 |
| Source- Author’s Analysis *- level of sig.<1%, **-level of sig.<5% | ||||||||
TCS acquired Comicrom
For this deal the statistical results suggest no relationship between dependent and independent variables, only age of TCS happens to play a significant role in statistical model. So it can be concluded that the post acquisition performance of TCS can be because of the age factor, a study by Fowler and Schmidt (1989), had found that age of organization improves the post acquisition financial performance of the acquiring firms. At the time of this study, TCS was at of 45 years of age.
TCS acquired FNS Australia
For this deal too, the statistical results suggest no relationship between dependent and independent variables, only age of TCS happens to play a significant role in statistical model. So it can be concluded for this deal is that the post acquisition performance of TCS can be because of its age.
TCS acquired TKS-Teknosoft
Since NewX has greater number of negative values in its original form, hence it was converted to its squared value and renamed NewX2. Linear regression was run with both NewX and NewX2; taking age of TCS as constant, and regression was run on SPSS 19. In the second variable input phase, New X and NewX2 were entered step-wise, after entering Age in first phase. Autocorrelation is absent as DW = 2.45. Step-wise entry removes multicollinearity from computation. After differentiating the best fit equation (NewY =7.67Age -4.39New X2 -109.23
ΔNewY = -8.78NewX {as Age and intercept are constant}
1% change in New X leads to approximately 9% change in rate of NewY in opposite direction.
The statistical results came out to be like, ΔNewY = -8.78NewX (as Age and intercept are constant), 1% change in New X leads to change of approximately 9% in NewY in opposite direction. The change in direction by 9% is symptomatic of comparison between two sets of figures, one starting with a low base and other starting with a higher base.
| Table 9 : Tata Consultancy Services | |||||
| Year | Net Income/Sales | Sales/ Assets | ROA | Assets/ Equity | ROE |
|---|---|---|---|---|---|
| 2005 | 20.36 | 254.11 | 51.74 | 110.32 | 57.08 |
| 2006 | 22.62 | 209.91 | 47.47 | 105.24 | 49.96 |
| 2007 | 22.77 | 193.82 | 44.13 | 108.93 | 48.07 |
| 2008 | 22.13 | 174.42 | 38.60 | 106.57 | 41.13 |
| 2009 | 19.10 | 166.85 | 31.86 | 106.17 | 33.83 |
| Infosys | |||||
| 2003 | 26.23 | 125.24 | 32.85 | 101.71 | 33.41 |
| 2004 | 25.63 | 145.16 | 37.20 | 102.88 | 38.27 |
| 2005 | 26.53 | 134.05 | 35.57 | 96.27 | 34.24 |
| 2006 | 25.82 | 135.36 | 34.94 | 100.98 | 35.29 |
| 2007 | 27.75 | 123.39 | 34.25 | 100.04 | 34.26 |
| 2008 | 27.91 | 121.00 | 33.77 | 100.00 | 33.77 |
Infosys acquired Expert Information Systems
The statistical analysis showed a strong correlation between the dependent variable (NewY) i.e. of rate of change of Net Profit of Infosys Technologies, independent variable rate of change of Net Profit of Infosys Technologies (Australia), (NewX, NewX2 , LnNewX). The variables are transformed to de trended values, to avoid collinearity. Along with detrended values NewX has been transformed to NewX2and natural log of NewX is taken (LnNewX), all the variables were entered using step wise method. Differentiating,
Δ(NewY) = 48.20/NewX-10.68E-022NewX
Differentiating the best fit equation indicates the change in dependent variable is induced by change in independent variable, but Since -10.68-022NewX is close to zero, hence this can be ignored leading to
Δ (NewY) = 48.20/NewX
As the independent variable is LnNewX, standard deviation of Standardized Coefficient must be looked, which suggests change in one unit of Standard Deviation in Independent Variable i.e. NewX leads to change of (e-0.728 ≈ 0.4849; -0.728 = Standard Coefficient) 0.4849 units in NewY. Incidentally the same is also true when the variables are interchanged. This also suggests that change in Independent Variable is not much influential for Dependent Variable.
Following section describes the profitability analysis part of the study, in which acquiring firms’ profitability returns in terms of revenue generation and changes in profitability measures three years post acquisition are compared with two years prior acquisition is done.
Profitability Analysis
For the profitability analysis, this study first looks into the contribution of acquired company in terms of revenues generated through it, as it reflects how much share does the acquired company has in the revenues of acquiring company. Further, this study looked in the contribution made by acquired firm, at the segmental level of the acquiring firm.
Tables- 10 to Table-15 gives the contributions made by acquired firms (Comicrom, FNS and TKS-Teknosoft) in total revenues of TCS and the contributions made by them at segmental level, it can be seen that a very less amount of share is made by the acquired firms at both consolidated and segmental levels.
|
TABLE-10 |
|||
|---|---|---|---|
| Year | Revenue(Comicrom) | Revenue (TCS) | Percentage |
| 2006 | 45.28 | 13377.8 | 0.34 |
| 2007 | 192.84 | 18914.26 | 1.02 |
| 2008 | 236.13 | 22863 | 1.03 |
| 2009 | 203.81 | 27813 | 0.73 |
| 2010 | 150.11 | 30029 | 0.50 |
| 2011 | 199.44 | 37928.31 | 0.53 |
| 2012 | 250.24 | 48893.83 | 0.51 |
| 2013 | 321.21 | 62989.48 | 0.51 |
| 2014 | 361.71 | 81809 | 0.44 |
| TABLE-11: | |||
|---|---|---|---|
| Year | Segment Revenue (Others) | Revenue(Comicrom) | Percentage |
| 2006 | n/a | 45.28 | n/a |
| 2007 | n/a | 192.84 | n/a |
| 2008 | n/a | 236.13 | n/a |
| 2009 | 6188.03 | 203.81 | 3.29 |
| 2010 | 6559.82 | 150.11 | 2.29 |
| 2011 | 8468.65 | 199.44 | 2.36 |
| 2012 | 11871.91 | 250.24 | 2.11 |
| 2013 | 14686.78 | 321.21 | 2.19 |
| 2014 | 18784.79 | 361.71 | 1.93 |
| TABLE-12 | |||
|---|---|---|---|
| Year | Revenue(FNS) | Revenue (TCS) | Percentage |
| 2006 | 27.2 | 13377.8 | 0.20 |
| 2007 | 235.3 | 18914.26 | 1.24 |
| 2008 | 274.25 | 22863 | 1.20 |
| 2009 | 4.48 | 27813 | 0.02 |
| 2010 | 129.65 | 30029 | 0.43 |
| 2011 | 34.02 | 37928.31 | 0.09 |
| 2012 | 86.26 | 48893.83 | 0.18 |
| 2013 | 57.08 | 62989.48 | 0.09 |
| 2014 | 66.69 | 81809 | 0.08 |
| TABLE-13 | |||
|---|---|---|---|
| Year | Segment revenue(BFSI) | Revenue(FNS) | Percentage |
| 2006 | 5077.72 | 27.2 | 0.54 |
| 2007 | 8200.26 | 235.3 | 2.87 |
| 2008 | 10091.24 | 274.25 | 2.72 |
| 2009 | 12047.18 | 4.48 | 0.04 |
| 2010 | 13488.85 | 129.65 | 0.96 |
| 2011 | 16526.6 | 34.02 | 0.21 |
| 2012 | 21062.22 | 86.26 | 0.41 |
| 2013 | 27146.25 | 57.08 | 0.21 |
| 2014 | 35112.41 | 66.69 | 0.19 |
| TABLE-14 | |||
|---|---|---|---|
| Year | Revenue(TeknoSoft) | Revenue (TCS) | Percentage |
| 2007 | 48.99 | 18914.26 | 0.26 |
| 2008 | 286.68 | 22863 | 1.25 |
| 2009 | 412.29 | 27813 | 1.48 |
| 2010 | 383.6 | 30029 | 1.28 |
| 2011 | 510.43 | 37928.31 | 1.35 |
| 2012 | 761.54 | 48893.83 | 1.56 |
| 2013 | 756.2 | 62989.48 | 1.20 |
| 2014 | 943.3 | 81809 | 1.15 |
| Source- Annual Reports | |||
| TABLE-15 | |||
|---|---|---|---|
| Year | Segment revenue(BFSI) | Revenue(Teknosoft) | Percentage |
| 2007 | 8200.26 | 48.99 | 0.60 |
| 2008 | 10091.24 | 286.68 | 2.84 |
| 2009 | 12047.18 | 412.29 | 3.42 |
| 2010 | 13488.85 | 383.6 | 2.84 |
| 2011 | 16526.6 | 510.43 | 3.09 |
| 2012 | 21062.22 | 761.54 | 3.62 |
| 2013 | 27146.25 | 756.2 | 2.79 |
| 2014 | 35112.41 | 943.3 | 2.69 |
| Source- Annual Reports | |||
For Infosys, Table-16 gives the contribution made by Expert Information Systems in total revenues of Infosys. It can be seen in table that contribution in revenue generation of Infosys by Expert Systems was not very high all through the years, but the acquired company had fairly contributed in revenue generation of Infosys. The contribution made by Expert Systems at the segmental level was not available to analyze because the acquired firm does not provide IT services for any specific sector or vertical instead it worked in domains of telecom, financial services, retail, and government services (Annual Report 2004).
| TABLE-16 | |||
|---|---|---|---|
| Year ended | Revenue(Infosys Australia) | Revenue(Infosys) | Percentage |
| 2005 | 302.23 | 7129.65 | 4.24 |
| 2006 | 321.22 | 9521 | 3.37 |
| 2007 | 446 | 13893 | 3.21 |
| 2008 | 556 | 16992 | 3.27 |
| 2009 | 549 | 21693 | 2.53 |
| 2010 | 711 | 22742 | 3.13 |
| 2011 | 984 | 27501 | 3.58 |
| 2012 | 1485 | 33734 | 4.40 |
| 2013* | 580 | 40352 | 1.44 |
| Source- Annual Reports *- In 2013 the acquired firm was liquidated and dividend of Rs 578 Crore was received | |||
The overall impact of the acquisitions made by the firms are observed in the view of change in profitability measures three years post acquisition as compared to two years prior acquisition keeping the year of acquisition as base year. The following section describes the results for every acquiring firm.
Tata Consultancy Services (TCS)
Ratio analysis of TCS reveals that Net Profit Margin, Sales Turnover Ratio, ROA and ROE decreased 3 years post acquisition by almost 5.5%, 7.3%, 12.5%, and 12% respectively. That means TCS had drastic increase in revenues and Net Profit after acquisitions but it was not able to generate profit out of sales after acquiring firms and turnover of assets were also decreased, and majorly shareholder’s wealth is observed to be deteriorated 3 years after acquisition and also showed a continuous downfall. The acquisitions done by TCS benefited it by providing various IP assets and new market penetration which is reflected in increase in revenues and increase in assets is also observed. In case of TCS, assets increased by 164% from 2006 to 2009 i.e. 3 years post acquisition, which showed that acquisitions not only increased its revenues, market penetration and client base but was also able to increase its wealth through assets. But decrease in Net Profit Margin, Sales Turnover Ratio, ROA and ROE showed operating inefficiency as TCS was not able to maximise utilization of the acquired assets and revenue increase. Although, it must be noted that in company’s annual reports assets are recorded on historical costs and not on the market value.
Infosys
Looking into the deal as a whole and its benefits, Infosys made a fruitful investment, as it was able to regain its investment in form of dividends from Infosys Technologies (Australia) in subsequent years and also gained market access and clients on behalf of the acquired company, along with its Intellectual property. From ratio analysis of Infosys it is visible, that post acquisition Infosys has maintained its Net Profit Margin and ROE ratios; however ROA slightly reduced but not deteriorated.
Conclusion
Results of this part of study suggest that, the rate of change of net profit of acquired firms is independent of rate of change of net profit of acquiring firms (TCS and Infosys). However, both the firms were able to expand their penetration in new geographies and increase their revenues. TCS acquired three firms in two years and increased its presence in Latin America, Europe and Australia, this helped in increasing the revenue manifolds but despite of increase in revenues and net profits, it was observed TCS had faced a downfall in all profitability measures three years post acquisition. Infosys made its maiden overseas acquisition and maintained its growth in terms of revenues, net profit and all profitability measures and was also able to ripe back the investments made in acquiring Expert Information Services. Although, in case of both acquiring firms it can be concluded that the acquired firms does not influence their growth. Limitations and directions of future research is discussed in Part-2 of the article.
References
- Abbas, Q., Hunjra, A.I., Saeed, R. & Ijaz, M.S. (2014). Analysis of pre and post-merger and acquisition financial performance of banks in Pakistan. Information Management and Business Review, 6(4), 177.
- Agrawal, A., Jaffe, J.F. & Mandelker, G.N. (1992). The post-merger performance of acquiring firms: A re-examination of an anomaly. The Journal of Finance, 47(4), 1605-1621.
- Ahammad, M.F. & Glaister, K.W. (2013). The pre-acquisition evaluation of target firms and cross border acquisition performance. International Business Review, 22(5), 894-904.
- Andre, P., Kooli, M. & L'her, J.F. (2004). The long-run performance of mergers and acquisitions: Evidence from the Canadian stock market. Financial Management, 33(4), 27-43
- Ashfaq, K., Usman, M., Hanif, Z. & Yousaf, T. (2014). Investigating the impact of merger & acquisition on post-merger financial performance (Relative & Absolute) of companies (Evidence from Non-Financial Sector of Pakistan). Research Journal of Finance and Accounting, 5(13), 88–102.
- Akben-Selcuk, E. & Altiok-Yilmaz, A. (2011). The impact of mergers and acquisitions on acquirer performance: Evidence from Turkey. Business and Economics Journal, 22, 1-8.
- Asquith, P., Bruner, R.F. & Mullins, D.W. (1983). The gains to bidding firms from merger. Journal of Financial Economics, 11(1), 121-139.
- Bajpai, N. (2010). Business Statistics. Pearson Education (P) Limited, NewDelhi
- Bertrand, O. & Betschinger, M.A. (2012). Performance of domestic and cross-border acquisitions: Empirical evidence from Russian acquirers. Journal of Comparative Economics, 40(3), 413-437.
- Boateng, A., Qian, W. & Tianle, Y. (2008). Cross-border M&As by Chinese firms: An analysis of strategic motives and performance. Thunderbird International Business Review, 50(4), 259-270.
- Bortoluzzo, A.B., Garcia, M.P.D.S., Boehe, D.M. & Sheng, H.H. (2014). Performance in cross-border mergers and acquisitions: An empirical analysis of the Brazilian case. Revista de Administração de Empresas, 54(6), 659-671.
- Bruner, R.F. (2002). Does M&A pay? A survey of evidence for the decision-maker. Journal of Applied Finance, 12(1), 48-68.
- Cameron C.A. & Trivedi P.K. (2009). Microeconomics: Methods and Applications. New York, Cambridge University Press.
- Carnes, T., Black, E. & Jandik, T. (2001). The long-term success of cross-border mergers and acquisitions.
- Capron, L. & Chen, J.C. (2007). Acquisitions of private vs. public firms: Private information, target selection, and acquirer returns. Strategic Management Journal, 28(9), 891-911.
- Chakrabarti, R. (2007). Do Indian Acquisitions Add Value? ICRA Bulletein Money & Finance. 61–74.
- Chandrawanshi, A.G. & Banerji, A. (2014). Review of Outward Foreign Direct Investment from India Post Liberalization. American Journal of Business Research, 7(1), 19-44.
- Changqi, W. & Ningling, X. (2010). Determinants of cross-border merger & acquisition performance of Chinese enterprises. Procedia-Social and Behavioral Sciences, 2(5), 6896–6905.
- Chen, Y. & Lin, C. (2009). Performance of Cross-Border Mergers and Acquisitions (M&A’s) By Chinese Firms. Journal of Business Strategy, 145–184.
- Conn, R. & Cosh, A. (2003). The Impact on U.K. Acquirers of Domestic, Cross-Border, Public and Private Acquisitions. ESRC Centre for Business Research, University of Cambridge Working Paper No 276.
- Datta, D.K. (1991). Organizational fit and acquisition performance: Effects of post-acquisition integration. Strategic management journal, 12(4), 281-297.
- Delios, A., Gaur, A.S. & Kamal, S. (2009). International acquisitions and the globalization of firms from India. Expansion of trade and FDI in Asia: Strategic and policy challenges, 58-76.
- Deng, P. & Yang, M. (2014). Cross-border mergers and acquisitions by emerging market firms: A comparative investigation. International Business Review, 24(1), 157–172.
- Dutta, S. & Jog, V. (2009). The long-term performance of acquiring firms: A re-examination of an anomaly. Journal of Banking & Finance, 33(8), 1400-1412.
- Faktorovich, M. (2008). Globalization: How Successful are Cross-border Mergers and Acquisitions?. Glucksman Institute for Research in Securities Markets, 28-57.
- Firstsource Solutions (2008). Annual Report 2008. Retrieved from http://www.firstsource.com/us/investors-financial-results2008.
- Firstsource Solutions (2009). Annual Report 2009. Retrieved from http://www.firstsource.com/us/investors-financial-results2009.
- Firstsource Solutions (2011). Annual Report 2011. Retrieved from http://www.firstsource.com/us/investors-financial-results2011
- Firstsource Solutions (2012). Annual Report 2012. Retrieved from http://www.firstsource.com/us/investors-financial-results2012
- Firstsource Solutions (2013). Annual Report 2013. Retrieved from http://www.firstsource.com/us/investors-financial-results2013
- Firstsource Solutions (2014). Annual Report 2014. Retrieved from http://www.firstsource.com/us/investors-financial-results2014
- Fowler, K.L. & Schmidt, D.R. (1989). Determinants of tender offer post-acquisition financial performance. Strategic Management Journal, 10(4), 339-350.
- Grant Thornton (2007). DealTracker. Annual edition 2007.
- Grant Thornton (2008). DealTracker. Annual edition 2008.
- Grant Thornton (2009). DealTracker. Annual edition 2009.
- Grant Thornton (2010). DealTracker. Annual edition 2010.
- Grant Thornton (2011). DealTracker. Annual edition 2011.
- Grant Thornton (2012). DealTracker. Annual edition 2012.
- Grant Thornton (2013). DealTracker. Annual edition 2013.
- Grant Thornton (2014). DealTracker. Annual edition 2014.
- Healy, P.M., Palepu, K.G. & Ruback, R.S. (1992). Does corporate performance improve after mergers?. Journal of financial economics, 31(2), 135-175.
- Infosys Technologies (2005) Annual Report 2005. Retrieved from https://www.infosys.com/investors/reports-filings/annual-report/Pages/index.aspx
- Infosys Technologies (2006) Annual Report 2006. Retrieved from https://www.infosys.com/investors/reports-filings/annual-report/Pages/index.aspx
- Infosys Technologies (2007) Annual Report 2007. Retrieved from https://www.infosys.com/investors/reports-filings/annual-report/Pages/index.aspx
- Infosys Technologies (2008) Annual Report 2008. Retrieved from https://www.infosys.com/investors/reports-filings/annual-report/Pages/index.aspx
- Infosys Technologies (2009) Annual Report 2009. Retrieved from https://www.infosys.com/investors/reports-filings/annual-report/Pages/index.aspx
- Infosys Technologies (2010) Annual Report 2010. Retrieved from https://www.infosys.com/investors/reports-filings/annual-report/Pages/index.aspx
- Infosys Technologies (2011) Annual Report 2011. Retrieved from https://www.infosys.com/investors/reports-filings/annual-report/Pages/index.aspx
- Infosys Technologies (2012) Annual Report 2012. Retrieved from https://www.infosys.com/investors/reports-filings/annual-report/Pages/index.aspx
- Infosys Technologies (2013) Annual Report 2013. Retrieved from https://www.infosys.com/investors/reports-filings/annual-report/Pages/index.aspx
- Infosys Technologies (2014) Annual Report 2014. Retrieved from https://www.infosys.com/investors/reports-filings/annual-report/Pages/index.aspx
- Inoti, G.G., Onyuma, S.O. & Muiru, M.W. (2014). Impact of acquisitions on the financial performance of the acquiring companies in Kenya: A case study of listed acquiring firms at the Nairobi securities exchange. Journal of Finance and Accounting, 2, 108-115.
- Kan, K. & Ohno, T. (2012). Merger of major banks from the EVA standpoint. Public Policy Review, 8(5), 737-774.
- Kaplan, S. & Weisbach, M. (1992). The success of Acquisitions: Evidence from Divestitures. The Journal of Finance, 47(1), 107-138
- Kohli, R. (2013). Analyzing the long run financial performance of cross border acquisitions of Indian acquiring companies. 37–43.
- Kohli, R. & Mann, B.J.S. (2012). Analyzing determinants of value creation in domestic and cross border acquisitions in India. International Business Review, 21(6), 998-1016.
- Kumar, R. (2009). Post-merger corporate performance: An Indian perspective. Management Research News, 32(2), 145-157.
- Kumar, R. & Rajib, P. (2007). Characteristics of Merging Firms in India: An Empirical Examination. Vikalpa, 32(1), 27–44.
- Kyriazis, D. (2010). The long-term post acquisition performance of Greek acquiring firms. International Research Journal of Finance and Economics, 43, 69-79.
- Leepsa, N. Misra, C.S. (2012). Post-Acquisition Performance of Indian Manufacturing Companies: An Empirical Analysis. Asia-Pacific Finance and Accounting Review, 1(1), 17-33.
- Leepsa, N.M. (2015). Review of Past Studies on Post M&A Performance in Manufacturing Sector: The Road Not Taken in India. Paper Presented to the World Finance & Banking Symposium, Singapore, 12-13.
- Mallikarjunappa, T. & Nayak, P. (2013). A Study of Wealth Effects of Takeover Announcements in India on
- Target Company Shareholders. Vikalpa, 38(3), 23-49.
- Mantravadi, D.P. & Reddy, A.V. (2008). Post-merger performance of acquiring firms from different industries in India. International Research Journal of Finance and Economics, 22,192–203.
- Meeks, G. (1977). Disappointing Marriage: A Study of the Gains From Merger. Cambridge University Press: Cambridge
- Mishra, P. & Chandra, T. (2010). Mergers, acquisitions and firms’ performance: Experience of Indian pharmaceutical industry. Eurasian Journal of Business and Economics, 3(5), 111-126.
- Moeller, S.B., Schlingemann, F.P. & Stulz, R.M. (2004). Firm size and the gains from acquisitions. Journal of Financial Economics, 73(2), 201–228.
- MPhasiS Limited (2007). Annual Report 2007. Retrieved from http://www.mphasis.com/financial-results.html MPhasiS Limited (2008).
- Annual Report 2008. Retrieved from http://www.mphasis.com/financial-results.html MPhasiS Limited (2009).
- Annual Report 2009. Retrieved from http://www.mphasis.com/financial-results.html MPhasiS Limited (2010).
- Annual Report 2010. Retrieved from http://www.mphasis.com/financial-results.html MPhasiS Limited (2011).
- Annual Report 2011. Retrieved from http://www.mphasis.com/financial-results.html MPhasiS Limited (2012).
- Annual Report 2012. Retrieved from http://www.mphasis.com/financial-results.html MPhasiS Limited (2013).
- Annual Report 2013. Retrieved from http://www.mphasis.com/financial-results.html MPhasiS Limited (2014).
- Annual Report 2014. Retrieved from http://www.mphasis.com/financial-results.htmlMPhasiS Limited (2015).
- Mueller, D.C. (1980). The determinants and effects of mergers: An international comparison. 24.
- Narayan, P.K. (2005). The saving and investment nexus for China: Evidence from cointegration tests. Applied Economics, 37(17), 1979–1990.
- Oduro, I. Agyei, S. (2013). Mergers & Acquisition and Firm Performance: Evidence from the Ghana Stock Exchange. Research Journal of Finance and Accounting, 4(7). 99-107
- Palepu, K.G. & Healy, P.M. (2013). Financial Analysis, in, Business Analysis & Valuation: Using Financial Statements (5e). Delhi: Cengage.
- Pawaskar, V. (2001). Effect of mergers on corporate performance in India. Vikalpa, 26(1), 19-32.
- Ramakrishnan, K. (2008).Long-term post-merger performance of firms in India. Vikalpa, 33(2), 47-63.
- Rani, N., Surendra, S.Y. & Jain, P.K. (2015). Financial performance analysis of mergers and acquisitions: Evidence from India. International Journal of Commerce and Management, 25(4), 402–423.
- Rau, P.R. & Vermaelen, T. (1998). Glamour, value and the post-acquisition performance of acquiring firms. Journal of financial economics, 49(2), 223-253.
- Ravenscraft, D.J. & Scherer, F.M. (1987). Mergers, sell-offs and economic efficiency. Brookings Institution Press.
- Saboo, S. & Gopi, S. (2009). Comparison of Post-Merger performance of Acquiring Firms (India) involved in Domestic and Cross-border acquisitions. MPRA paper.
- Satish, K. & Lalit, K.B. (2012). The Impact of Mergers and Acquisition on Corporate Performance in India.
- Management Decision, 46(10), 1531–1543.
- Saxena, R. & Sen, A. (2013). Overseas acquisitions by Indian IT firms to rise in 2013. Retrieved from http://www.livemint.com/Industry/POGRV2grJStAumVRqr18pN/Overseas-acquisitions-by-Indian-IT-firms-to-rise-in-2013.html.
- Sharma, D.S. & Ho, J. (2002). The impact of acquisitions on operating performance: Some Australian evidence. Journal of Business Finance & Accounting, 29(1-2), 155-200.
- Schoenberg, R. (2006), Measuring the performance of corporate acquisitions: An empirical comparison of alternative metrics. British Journal of Management, 17(4), 361-370.
- Singh, P., Suri, P. & Sah, R. (2012). Economic value added in Indian cross border mergers. International Journal of Business Research, 12(2).
- Sinha, P. & Gupta, S. ( 2011). Mergers and Acquisitions: A pre-post analysis for the Indian financial services sector MPRA Paper No. 31253.
- Subex Limited (2007). Annual Report 2007. Retrieved from http://www.subex.com/annual-reports/
- Subex Limited (2008). Annual Report 2008. Retrieved from http://www.subex.com/annual-reports/
- Subex Limited (2009). Annual Report 2009. Retrieved from http://www.subex.com/annual-reports/
- Subex Limited (2010). Annual Report 2010. Retrieved from http://www.subex.com/annual-reports/
- Subex Limited (2011). Annual Report 2011. Retrieved from http://www.subex.com/annual-reports/
- Subex Limited (2012). Annual Report 2012. Retrieved from http://www.subex.com/annual-reports/
- Subex Limited (2013). Annual Report 2013. Retrieved from http://www.subex.com/annual-reports/
- Subex Limited (2014). Annual Report 2014. Retrieved from http://www.subex.com/annual-reports/
- Sudarsanam, P.S. & Gao, L. (2004). Value Creation in UK High Technology Acquisitions. SSRN Electronic Journal, 1–47.
- Tata Consultancy Services (2006). Annual Report 2006. Retrieved from http://www.tcs.com/investors/financial_info/Pages/default.aspx
- Tata Consultancy Services (2007). Annual Report 2007 Retrieved from http://www.tcs.com/investors/financial_info/Pages/default.aspx
- Tata Consultancy Services (2008). Annual Report 2008. Retrieved from http://www.tcs.com/investors/financial_info/Pages/default.aspx
- Tata Consultancy Services (2009). Annual Report 2009. Retrieved from http://www.tcs.com/investors/financial_info/Pages/default.aspx
- Tata Consultancy Services (2010). Annual Report 2010. Retrieved from http://www.tcs.com/investors/financial_info/Pages/default.aspx
- Tata Consultancy Services (2011). Annual Report 2011. Retrieved from http://www.tcs.com/investors/financial_info/Pages/default.aspx
- Tata Consultancy Services (2012). Annual Report 2012. Retrieved from http://www.tcs.com/investors/financial_info/Pages/default.aspx
- Tata Consultancy Services (2013). Annual Report 2013. Retrieved from http://www.tcs.com/investors/financial_info/Pages/default.aspx
- Tata Consultancy Services (2014). Annual Report 2014. Retrieved from http://www.tcs.com/investors/financial_info/Pages/default.aspx
- Tripathi, V. & Lamba, A. (2015). Does Financial Performance Improve Post Cross Border Merger and Acquisitions?: A Detailed Study of Indian Acquirer Firms' Financial Performance Across Target Economy's Development Status and Financial Crisis. Research Journal of Social Science & Management, 4(9), 325–342.
- Verma, N. & Sharma, R (2004). Impact of Mergers & Acquisitions on Firms’ Long Term Performance: A Pre & Post Analysis of the Indian Telecom Industry. IRACST- International Journal of Research in Management & Technology (IJRMT), 4(1), 11-19.
- Woolridge, J.M (2013). Introductory Econometrics: A Modern Approach. Cengage
- Xiao, X. & Tan, L. (2009). Research of M&A Performance of Listed Companies in China Based on EVA. In Electronic Commerce and Business Intelligence, 2009. ECBI 2009. International Conference on (pp. 337-340).
- Xue, S. & Yang, D. (2006). Introduction to EVA Theoretical System and Analysis of Its Applicability in China. Science & Technology Information, 136-138.