Original Articles: 2017 Vol: 16 Issue: 1
Analysis of Cross Border Acquisitions by Indian Information Technology Sector Firms (Part-2)
Anand Gaurav Chandrawanshi, Maulana Azad National Institute of Technology
Amit Banerji, Maulana Azad National Institute of Technology
Introduction
India happened to be among the top ten Outward Foreign Direct Investment sources in the period 2000-2007 and by 2008 India had become almost net outward Foreign Direct Investor country Chandrawanshi and Banerji (2014); Indian Outward Foreign Direct Investment has been a natural extension of their core competence developed over the decades. These core competencies were developed with increment growth in efficiencies and also a result of globalisation because of which Indian firms were exposed to global competition. Indian MNCs post liberalisation (1991) changed the course of business and turned to strategy of inorganic growth along with organic growth strategy, the former encouraged them to go outside geographical boundaries to seek new markets, technical know-how and strategic assets. A major change of shift of OFDI from manufacturing to services was observed during 2000, and Information Technology & Information Technology Enabled Services sector emerged as a sector with largest OFDI through Mergers and Acquisitions (M&As) activity.
Figure-1 shows trend of OFDI from India for last decade. There is a rise from 2001 to 2014 with CAGR of 22%, and highest recorded in 2009(Rs. 905 Bn.), followed by 2011(Rs. 782.57 Bn.). Sector wise distribution of OFDI from India indicates, companies from IT & ITES sector entered in maximum deals from 2005 to 2014 followed by Pharmaceutical sector (Grant Thornton 2014).

Figure 1.Outward Foreign Investment from India.
This trend of inorganic growth strategy by Indian firms motivated numerous researchers to look into the outcome of such cross border M&A activity in terms of profitability and other factors; whether Indian firms have been successful in achieving their targets though this route. To look into the issue, in this study, previous studies which were done globally and at domestic level were studied and then problems of existing methodologies were addressed. This study is however limited to financial aspect of M&A activity. Various studies have given varied outcomes and results. Some studies found, that acquisitions were not beneficial for them, and in some it was observed have a positive impact on profitability.
Literature Review
Numerous studies have been conducted to study the impact of M&As on performance of organizations which have undergone mergers and/or acquisitions, either in domestic or cross border. Extant studies have used following methodologies in more or less similar manner to study the impact of acquisition which are as follows:
1) Event Study Methodology
2) Accounting returns analysis
3) Economic Value Added Analysis
4) Combined studies of Event study and Accounting return analysis
Event Study Methodology
In this methodology, studies were done to find the abnormal returns gained by shareholders as a result of acquisition announcement news and also in long run on shareholder’s wealth. Studies were also done regarding the profitability of the acquired firms shows in table 1.
Accounting Return Analysis
The studies conducted using this methodology looked in the post-acquisition financial performance of acquiring firms through evaluating financial and profitability measures viz. Operating cash flow, Return on Assets, Returns on Equity, Returns on Net Worth, Return on Capital Employed etc shows in table 2. If is there a positive change in these measures of profitability in post-acquisition period. Another approach which is followed is to compare the pre and post-acquisition financial ratios to have a view, if there is a significant change in above said measures as a result of M&A activity.
Economic Value Added Analysis
EVA is an indicator developed by the Stern Stewart & CO., a consulting firm Kan & Ohno (2012). In acquiring firm as a result of M&A activity has been proposed by some researchers, EVA is the balance of capital earnings of an enterprise or its business segment in a certain period minus investment cost Xue S and Yang D (2006) shows in table 3.
| Table 1: Literature Review | |||
| Author(s) | Study Period | Event Window | Inference |
|---|---|---|---|
| Asquith (1983) | 1962-76 | (-1,0) | For a sample of 196 firms, positive abnormal returns were found for firms where targets were large (target firm’s equity is greater than 10%). |
| Healy et al (1990) | 1979-83 | (-5,5) | Sample of 50 largest mergers; found positive announcement returns and increase in operating cash flow. |
| Agrawal et al (1992) |
1955-87 | (0, 5 years) | Stockholders of acquiring firms had a statistically significant wealth loss of 10% over five years post-merger completion. |
| Kaplan and Weisbach (1992) | 1971-82 | (-5,5) | 44% of large acquisition divested (acquired firms were sold off), however, among them 42% gained from selling off, and 34% of the divested acquisitions were considered unsuccessful, during the period of study (1971-1982) for a sample of 271 mergers and tender offers. The returns of acquiring firms were found lower concurrent with results of previous studies. |
| Rau and Vermaelen(1998) | 1980-91 | (0,3 years) | Acquiring firms show negative abnormal returns and firms with tender offers show statistically significant but low positive abnormal returns. It was also observed that firms with low book-to-market ratio underperform as compared to high book-to ?market ratio firms. |
| Cames et al (2001) | 1985-95 | (0, 3 years to 5 years | Cross border acquisitions observed to be value destroying activity for 361 US firms. Abnormal returns were found to be significantly negative for both three and five years’ period. It was observed that post announcement returns did not influence long term returns for acquirer firms. |
| Sudarsanam and Gao (2003) | 1990-99 | (0, 3 years) | 386 M&As of high technology industry firms (Biotechnology, IT, Communication, Others) of UK for the period of 1990- 1999, looking for the strategic growth motives for undergoing M&A activities. The study observed that in long term, these acquisitions resulted shareholder’s value going down. |
| Moeller et al (2003) | 1980-01 | (-1,1) | For a sample of 12023 firms, size of firm influenced abnormal returns of announcement of acquisition and it was found that small firms benefited with abnormal returns as compared to large firms in long run. It was also observed that mode of financing does not influence abnormal returns. |
| Conn and Cosh (2003) | 1984-98 | (0,3 years) | In case of cross border acquisitions in high tech industries there were positive announcement returns and long term returns and for non-high tech firms there were negative post-acquisition returns. |
| Andre et al (2004) | 1998-00 | N.A. | Decline in performance in the long run for both domestic and cross border acquisitions. The study had sample of 267 acquisitions done by 176 Canadian firms. |
| Schoenberg (2006) | 1988-90 | (-10, 10) | Observed success rate of 50 % for acquisitions under four measures of post-acquisition performance Cumulative Abnormal returns(CAR), Managers Subjective Assessments, Experts informants subjective assessments, & Divestment Data. CAR of the acquiring firms was observed to be -0.02%. |
| Boateng et al (2008) | 2000-04 | (-20,20) | CAR and Daily Abnormal Returns were value creating for the firms after acquisition announcement. In short run it was observed that sample firms had overall average positive CAR of 4.4274% (statistically significant at the 5 percent level). |
| Dutta and Jog (2009) | 1993-02 | (-1 year , 3 years) | 1300 M&A events of Australian firms for the long run post-acquisition found inconsistent results with previous studies of negative abnormal returns for the acquirer firms. The study also argued that results of such studies may be a result of methodology adopted and techniques used. The study used both event time (Buy and Hold abnormal return) and a calendar-time approach (Fama and French 3 factor regression) and robustness test were also done for finding concrete results. |
| Kyriazis(2010) | 1993-06 | (0, 3 years) | Average negative abnormal returns of 2% per month of the acquiring firms stocks over three years post-acquisition period. The study was based on 3-factor model given by Fama and French (1993). |
| Akben-selcuk & altiok (2011) | 2003-07 | (-5, 5) | A sample of 62 turkish companies which were involved in m&a, found positive abnormal returns. |
| Indian Studies | |||
| Chakrabarti (2008) | 2000-07 | (-1,+1) and (0, 3 years) | In the case of announcement or short run analysis, an increase in shareholders wealth of acquirer firms was observed (CAR was found 2.54%). “The long run post-acquisition returns were positive but they were value reducing as compared to their previous returns”. |
| Delios et al (2009) | 1986-06 | (-7,7) | Majority of firms in sample had a positive CAR between 2% - 3% for their stocks after the acquisition announcement. |
| Kohli & mann (2012) |
1997-08 | (-50,50) | Announcement returns for Indian cross border and domestic m&as for sample of 202 cross border and 68 domestic acquisitions, and found they created value for shareholders’ in short run. Cross border acquisition announcements created more value comparatively. The factors which influenced the returns were that technology intensive sector firms outperformed non technology sector target firms. |
| Mallikarjunappa and Nayak (2013) | 1998-07 | A sample of 227 target companies and Abnormal Returns, Average Abnormal Returns and Cumulative Average Abnormal Returns were studied for 61 day window of announcement of M&A activity. It was found that shareholders’ of the target companies benefited with the M&A activity. | |
| Table 2 :Literature Review | ||
| Author(s) | Study Period | Inference |
|---|---|---|
| Meeks (1977), (cited from Bruner 2002) | 1964-72 | Decline in profitability of acquiring firms in terms of ROA following five years of acquisition was found and two third of sample demonstrated lower performance as compared to industry standard |
| Mueller (1980), (cited from Bruner 2002) | 1962-72 | Post-acquisition profitability of sample firms was compared with pre acquisition profitability and no significant difference was observed. It was also found that non-acquiring firms performed better than their acquiring counterparts during the period of observation. |
| Ravenscraft and Scherer (1987), (cited from Bruner 2002) | 1950-77 | Observed significant negative relationship between operating ROA and tender offer activity. Firms with tender offer activity were found 3.1% less profitable than firms without activity. |
| Healy et al (1992), (cited from Bruner 2002) | 1979-84 | Asset productivity improved post-acquisition which improved operating cash flow in 50 sample firms of study as compared to their industry peers. Authors argued that operating cash flow improvement associated with announcement returns of stock on the merging firms. |
| Sharma & Ho (2002) | 1986-99 | For a sample of 36 Australian acquisitions, it was observed that post-acquisition performance did not significantly improve for the sample firms during the observation period. It was also found that mode of financing or type of acquisition (conglomerate and non-conglomerate) does not significantly affect measures of post-acquisition operating performance. |
| Bertrand and Betschinger (2012) | 1999-08 | Studied 120 acquisitions by Russian firms and found the acquiring firms’ profitability declined in both domestic and cross border acquisitions. |
| Oduro and Ageyi (2013) | 1999-10 | For sample of five firms involved in M&A activity, listed on Ghana Stock exchange experienced decreased profitability. The study observed that post-merger profitability (ROA and ROE) decreased as compared to pre-merger. |
| Bortoluzzo et al (2014) | 1994-08 | Firms which undertook cross border acquisitions gain financial synergies and improvement in financial performance. Companies experienced improved financial performance till third acquisition and then a decline in performance was observed. |
| Abbas et al (2014) | 2006-11 | Observed no significant change in performance of acquiring banks, for sample of 10 banks in Pakistan. |
| Ashfaq(2014) | 2000-09 | Relative performance of firms deteriorated (insignificantly) after M&A activity; also the absolute performance of firms deteriorated, for sample of 16 firms of non-financial sectors (textile, pharmaceutical, cement, automobile, electronics) |
| Inoti et al (2014) | 2001-10 | Observed no improvement in post-merger financial performance for a sample of 11 Kenyan listed firms. |
| INDIAN STUDIES | ||
| Pawaskar(2001) | 1992-95 | For a sample of 36 domestic acquisitions, It was found that post-merger profitability did not improve for the acquirer firms, but size of assets and financial synergies increased Comparing the performance of the firms involved in merger with a firm which was not involved in merger showed that if no merger had taken place, the post-merger period profitability would have improved. |
| Mantravadi and Reddy (2008) | 1991-03 | Firms from some industries (Banking & Finance, Pharmaceuticals) experienced improved performance post-merger and performance of firms of some industries declined (Agri-Products, Chemical, Electrical, Textile). |
| Ramakrishnan (2008) | 1996-02 | Financial performance of firms had improved as compared to the pre-merger period. The study also observed that pre-merger performance significantly influences post-merger performance. |
| Kumar (2009) | 1999-02 | For sample of 30 firms, found no improvement in post-merger performance of sample firms, although the study used ROCE, asset turnover ratio and solvency ratio for measuring post-merger profitability. All three measures show slight change in post-merger period but all the results were statistically insignificant. |
| Saboo and Gopi (2009) | 2000-07 | Sample firms improved financial performance in domestic case and a decline was observed in case of cross border acquisitions. |
| Mishra and Chandra (2010) | 2001-08 | For sample of 52 firms in pharmaceutical sector observed there is no significant effect of M&A on the profitability of firms. |
| Sinha and Gupta (2011) | 1993-10 | Analysed 80 cases of acquisitions and mergers in Indian Banking industry(both inbound and outbound), and found that liquidity of the firms decreased three years after merger and profitability was observed to increase in majority of cases. |
| Leepsa & Mishra(2012) | 2001-10 | Liquidity of acquirer firms was found to decline and profitability increased. In case of relatively large sized target firms’ performance declined. For large size firms, profitability and liquidity improved and for small size firms there was an increase in both but statistically insignificant. |
| Kohli (2013) | 1997-08 | Found a significant increase in profitability after acquisition on acquiring firms by comparing pre and post profitability ratios for sample of domestic M&A activity of 20 listed Indian firms. |
| Verma & Sharma (2014) | 2002-08 | For a sample of 59 Indian telecom industry acquisitions, the operating performance variables did not showed any improvement after the M&A. |
| Rani et al (2015) | 2003-08 | Observed an increase in financial performance of firms post M&A. The authors also analysed in terms of DuPont analysis and found higher profit is generated per unit net sales by the acquiring firms after the M&A. The higher profits (profit before interest and taxes and non-operating income) are generated primarily due to the better operating margins. |
| Tripathi and Lamba (2015) | 1998-07 | For a sample of 272 foreign M&As done by Indian list firms, concluded that profitability, liquidity and solvency declined after merger but the size of the acquiring firm is increased. |
Combined Studies of Event Study and Accounting Return Analysis
Some of the researchers tried to analyse cross border deals using both Event Study and Accounting Return Analysis to get a better understanding of acquisition’s impact in short run and long run as well shows in table 4.
| Table 3: Literature Review | ||
|---|---|---|
| Author(s) | Year of Study | Inference |
| Sirower and O’Byrne | 1998 | Linked stock market returns of acquisition announcements and found high correlation among stock market predictions and operating performance of acquiring firms. The authors developed a benchmark, which can be used to measure the effects of acquisition on acquirer firm’s improvement in EVA. |
| Leepsa | 2015 | York (2004) using EVA as performance measure found that the operating performance declines after the acquisition similar to the performance of other companies in the industry. Using the EVA measure, it is found that there is decline in performance by Indian firms going for cross border deals (Singh, et al., 2012). |
| Xiao & Tan | 2009 | EVA increased post-acquisition as compared to pre-merger and thus the firm’s performance can be stated to improve significantly in short term (when 2 and 3 years post M&A is compared with one year pre M&A i.e. 2001), but in long term i.e. 4 years after M&A the results were statistically insignificant. |
| Kan & Ohno | 2012 | Studied effects of merger on banking sector and found not all mergers resulted in improvement in EVA. It was also found that improvement comes gradually after merger not immediately. The authors found significant impact of merger after 5 years of activity. The period of study was 1989-2008. |
| Singh et al | 2012 | The cross border acquisitions made by Indian firms are value destroying. |
| Table 4 : Literature Review | ||
| Author(s) | Year of Study | Inference |
|---|---|---|
| Faktorovich | 2008 | Compared domestic and cross border deals done by US firms and found that cross border deals lag behind domestic ones in respect of profitability; 1 to 3 years post-acquisition. Also foreign deals performed below industry average in terms of profitability. For stock market returns analysis, author concluded that cross border deals outperformed domestic deal as far as five days returns of deal announcement is concerned, and the factors which resulted this were the size of both acquirer and target firms. |
| Chen and Lin | 2009 | Studied 42 cross border deals made by 31 Chinese firms and found only 50 % of the sample firms showed improved performance after acquisition. Event study methodology of same sample helped authors in concluding that the announcement of such deals resulted in positive abnormal returns to shareholders. A regression run for analysing possible variables which influence the CAR of firms was done, and a result it was observed, state owned firms negatively impacted as they lacked international experience. It was stated, “consistent with the findings by KPMG, acquirers with lower P/E ratio and of smaller market capitalization (size) tended to be more successful in these cross-border M&A deals, at 1% significance level. Acquiring companies with low P/Es might not be as tempting to engage in deals with higher risks since their stocks were undervalued in the market. Acquiring companies with high P/Es, which were more likely to have already overvalued stocks at the time of the deal, would have a more difficult time to further increase the value of their stocks after a transaction” (Chen &Lin 2009). It was observed that previous experience of acquirers also had a positive impact on returns of sample deals. |
| Akben-Seluck and Altiok | 2011 | Concluded, stock returns of announcement of deals were above industry average, and accounting returns study suggested that for acquirer companies in sample, post-acquisition performance declined as compared to pre-acquisition. Sample taken was of 62 Turkish companies which acquired various companies during 2003-2007. |
Research Methodolgy
Data Sample
The impact of M&A depends on both internal and external environmental factors. Internal environmental factors involve resources and performance of acquiring firm, and external environmental factors include economic growth and degree of competition at home country, changes of political and cultural environment of host country etc Changqi & Ningling (2010). From the review of literature done in study, following research gaps were observed.
1) Not all the studies have exclusively studied cross border acquisitions made by Indian firms.
2) It is not certain that, the sample firms studied had not went for such any other inorganic activity viz. M&A or started any new venture or facility in any country in years following acquisition or any external environment factor viz. Changes in government policy, tax rates, foreign currency exchange rates to say a few have effected the firm’s performance. Therefore, it is not necessary that the increase or decline in profitability is solely due to the M&A activity studied.
| Table 5 Deal Tracker Information |
||||
|---|---|---|---|---|
| S.No. | Acquirer | Acquired | Year of Acquisition | Deal Size (US Million $) |
| 1 | HCL Technologies Limited | Liberata Financial Services | 2008 | 2 |
| 2 | Mastek Technologies | Vector Insurance | 2007 | 9 |
| 3 | MPhasis Technologies | Princeton | 2005 | 15 |
| 4 | MPhasis Technologies | Eldorado | 2005 | 16.5 |
| 5 | HCL Technologies Limited | Control Point Systems | 2008 | 21 |
| 6 | Tata Consultancy Services | Comicron | 2006 | 23 |
| 7 | Infosys Technologies | Infosys Technologies | 2003 | 24.9 |
| 8 | NIIT Technologies | Room Solutions | 2007 | 25 |
| 9 | 3i Infotech | J&B Software Inc | 2007 | 25.25 |
| 10 | Wipro Technologies | American Management Systems | 2002 | 26 |
| 11 | Infosys Technologies | P-Financial Services Holdings B.V | 2008 | 28 |
| 12 | Wipro Technologies | mPower | 2003 | 28 |
| 13 | Mastek Ltd | Systems Task Group | 2008 | 29 |
| 14 | Firstsource Technologies | BPM | 2007 | 30 |
| 15 | Satyam Computers | Bridge Strategy Group | 2008 | 34.4 |
| 16 | Mascon Global Ltd | Ebusinessware Inc | 2008 | 35 |
| 17 | Hexaware Technologies | FocusFrame | 2006 | 35 |
| 18 | HCL Technologies Ltd. | CapitalStream | 2008 | 39.5 |
| 19 | Rolta India Ltd | TUSC | 2008 | 45 |
| 20 | Quintegra Solutions | PA Corporation | 2007 | 49 |
| 21 | Mascon Global Ltd | Jass & Associates Inc & SDG Corporation | 2008 | 55 |
| 22 | Accentia Technologies | GSR Physicians | 2007 | 63 |
| 23 | Accentia Technologies | DenMed | 2007 | 66 |
| 24 | 3i Infotech | Regulus Group | 2008 | 80 |
| 25 | Tata Consultancy Services | TKS- TeknoSoft | 2007 | 80 |
| 26 | HOV Services | BPO Lason | 2007 | 108 |
| 27 | Subex Technologies Limited | Azure | 2007 | 140 |
| 28 | Subex Azure Limited | Syndesis Limited | 2007 | 164.5 |
| 29 | Firstsource Technologies | MedAssist | 2006 | 330 |
| 30 | Wipro Technologies | InfoCrossing | 2007 | 600 |
| 31 | HCL Technologies Limited | Axon Group plc | 2008 | 750 |
| 32 | NIIT Technologies | Softec GmBh | 2008 | N.A. |
Thus this study attempts to find the impact of acquisition made by acquired firm on acquiring firm by looking into the contribution made by former on latter in terms of growth of Net Profit and whether the acquisition benefited the acquiring firm on profitability parameters viz., Net Profit Margin, ROA, ROE in long run i.e. 3 years post acquisition. For this purpose financial data of the acquiring companies is taken from the annual reports of relevant years using consolidated financial statements. All monetary figures are in Rupees Crore (1Crore=10 Million). The firms were shortlisted under two criteria:
1) Acquiring firm should be a public company listed in Indian Stock Exchanges, the reason for taking these firms are
a. Study is about OFDI from India
b. Public limited firms have the wherewithal to raise funds for acquisitions.
2) Acquisition should have been made during period of 2007 & 2008 or earlier but not before 2000, and not post 2008 because post 2008 deals will lead to insufficiency of data points.
Considering the above criteria, following deals were found, the source for information was Deal Tracker published by Grant Thornton India of relevant years.
| Table 5 | ||||
|---|---|---|---|---|
| S.No. | Acquirer | Acquired | Year ofAcquisition | Deal Size (USMillion $) |
| 1 | HCL TechnologiesLimited | Liberata Financial Services | 2008 | 2 |
| 2 | Mastek Technologies | Vector Insurance | 2007 | 9 |
| 3 | MPhasis Technologies | Princeton | 2005 | 15 |
| 4 | MPhasis Technologies | Eldorado | 2005 | 16.5 |
| 5 | HCL TechnologiesLimited | Control Point Systems | 2008 | 21 |
| 6 | Tata ConsultancyServices | Comicron | 2006 | 23 |
| 7 | Infosys Technologies | Expert Information Systems | 2003 | 24.9 |
| 8 | NIIT Technologies | Room Solutions | 2007 | 25 |
| 9 | 3i Infotech | J&B Software Inc | 2007 | 25.25 |
| 10 | Tata ConsultancyServices | Financial Network Services | 2006 | 26 |
| 11 | Wipro Technologies | American Management Systems | 2002 | 26 |
| 12 | Infosys Technologies | P-Financial Services HoldingsB.V | 2008 | 28 |
| 13 | Wipro Technologies | mPower | 2003 | 28 |
| 14 | Mastek Ltd | Systems Task Group | 2008 | 29 |
| 15 | FirstsourceTechnologies | BPM | 2007 | 30 |
| 16 | Satyam Computers | Bridge Strategy Group | 2008 | 34.4 |
| 17 | Mascon Global Ltd | Ebusinessware Inc | 2008 | 35 |
| 18 | Hexaware Technologies | FocusFrame | 2006 | 35 |
Out of the shortlisted deals mentioned in Table 5, deals illustrated in Table 6 were considered for final sample because, in rest of the acquisitions identified the acquired companies were either merged into other subsidiary of acquiring company or were liquidated in short span of time (2 or 3 years), as a result data points were not available for analysis.
| Table 6 | ||||
|---|---|---|---|---|
| S.No. | Acquirer | Acquired | Year of Acquisition | Deal Size (US Million $) |
| 1 | HCL Technologies Limited | Liberata Financial Services | 2008 | 2 |
| 2 | MPhasis Limited | Princeton | 2005 | 15 |
| 3 | HCL Technologies Limited | Control Point Systems | 2008 | 21 |
| 4 | Tata Consultancy Services | Comicron | 2006 | 23 |
| 5 | Infosys Technologies | Expert Information Systems | 2003 | 24.9 |
| 6 | NIIT Technologies | Room Solutions | 2007 | 25 |
| 7 | Tata Consultancy Services | Financial Network Services | 2006 | 26 |
| 8 | Tata Consultancy Services | TKS- TeknoSoft | 2007 | 80 |
| 9 | Subex Technologies Limited | Azure | 2007 | 140 |
| 10 | Subex Azure Limited | Syndesis Limited | 2007 | 164.5 |
| 11 | FirstSource Limited | MedAssist | 2006 | 330 |
| 12 | HCL Technologies Limited | Axon Group plc | 2008 | 750 |
| 13 | NIIT Technologies | Softec GmBh | 2008 | N.A. |
Out of the deals listed inTable 6, the final eight deals selected for publication purpose are illustrated in Table 7.
| Table 7 | ||||
| S.no | Acquirer | Acquired | Year of Acquisition | Deal Size (in Million Dollars) |
|---|---|---|---|---|
| 1 | Tata Consultancy Services | Comicron | 2006 | 23 |
| 2 | Tata Consultancy Services | Financial Network Services | 2006 | 26 |
| 3 | Tata Consultancy Services | TKS- TeknoSoft | 2007 | 80 |
| 4 | Infosys Technologies | Expert Information Systems | 2003 | 24.9 |
| 5 | MPhasis Limited | Princeton | 2005 | 15 |
| 6 | Subex Technologies Limited | Azure | 2007 | 140 |
| 7 | Subex Azure Limited | Syndesis Limited | 2007 | 164.50 |
| 8 | Firstsource Limited | MedAssist | 2006 | 330 |
| Source: Dealtracker and Saxena & Sen (2013) | ||||
| Table 8: Statistical results | ||||||||
| Deal | Dependent Variable | Independent Variable(s) | Unstandarized Coefficient | Coefficient | r | R2 | F- Stat | D.W. Stat |
|---|---|---|---|---|---|---|---|---|
| Firstsource acquired MedAssist | InvNewY | NewX2 | -.012 | - 0.0000002394*** | 0.814 | 0.663 | 5.906 | 2.888 |
| MPhasis acquired Princeton | NewY | NewX | 818.191 | 8.77E-13*** | 0.746 | 0.557 | 5.027 | 1.261 |
| Subex acquired Azure | NewY | NewX8, InvNewX8 | -15510.695 | 3.792E-14** , 7.730E-20** | 0.910 | 0.827 | 7.196 | 1.527 |
| Subex Acquired Syndesis | LognegNewY | NewX | 2.532 | -0.004*** | 0.391 | 0.153 | 0.543 | 1.539 |
For this part of paper the following deals are included-
1. MPhasis Limited acquired Princeton
2. Subex Technologies Limited acquired Azure
3. Subex Azure Limited acquired Syndesis Limited
4. Firstsource Limited acquired MedAssist
Along with this, this part includes Panel Data Analysis of all the eight deals.
Methodology
Methodology for this study consists of two measures for analysing the impact of acquired firm on acquiring firm. In the first part a statistical model is developed which attempts to find relationship between rates of Net Profit of acquired firms with the rate of change Net Profit of acquiring firm, and secondly Profitability analysis is done for analysing what are the repercussions of acquisition on the acquired firm post acquisition.
Statistical Model
For finding the contribution of acquired firm, firstly, this study attempts to find the relationship between rate of change of Net Profit of acquiring firm and acquired firm(s), by developing a model which establishes the relationship between parameters. For this purpose Ordinary Least Square (OLS) is used as Statistical tool. Software Packages SPSS 19 and eviews 7 were used. In the model, rate of change of Net Profit of acquiring firm is taken as Dependent Variable, starting from 2 years after acquisition till year 2014 and in some cases 2015, and rate of change of Net Profit of acquired firm is taken as Independent Variable. The reason for taking such parameters is, during the year of acquisition, firm may be in burden of heavy cash outflow or debt taken for purpose of conducting acquisition, so two years time is believed to be required for integrating the acquired firm completely. Another reason for taking Net Profit as a parameter is, it reflects the actual earnings made from investments made by any firm. Changqi & Ningling (2010), in their study used ROA as dependent variable to study the impact of cross border acquisition on firms and stated “The reason for using ROA of the two year after M & A is that, in the literature, it is generally accepted that mergers and acquisitions performance cannot be shown immediately until the second year after; costs typically increase in the year of mergers and acquisitions and the first year after it is an integration period when a lot of investments are still needed. So, roas in these two years are not good indicators.”
This study takes rate of change of Net Profit of acquiring and acquired firms as dependent and independent variables, which are derived as following
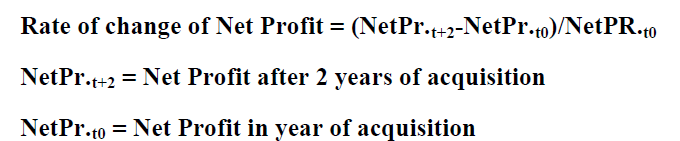
Similarly for years following acquisition variables are derived till 2014, for instance
 is Net Profit growth after 3 years of acquisition and so on.
1) Since the availability of data points were limited, the variables were Detrended only. Detrending was achieved by Polynomial fit through MS-Excel. Levin & Rubin (1997).
2) Further transformation of the variables was undertaken separately for each deal to achieve best fit model under OLS. Transformation of Dependent and Independent variables is based on the requirement of statistical results and according to it variables are transformed as NewX2, LnNewX, NewY, LnNewY etc. Durbin Watson Statistic must be in zone of no auto correlation or inconclusive Inconclusive (DW= 1.08 -1.36), No Auto Correlation (DW= 1.36-2.64) Bajpai (2010).
3) The significance of OLS being less than 10% preferably less than 5%.
4) Unstandardised coefficient with more than or 95% confidence not to range from positive to negative.
5) Panel data are cross-sectional and time-series. There are multiple entities, each of which has repeated measurements at different time periods. Panel data may have group effects, time effects, or the both, which are analyzed by fixed effect and random effect models, depending upon availability of data points. Panel data models examine fixed and/or random effects of entity or time. The main difference between fixed and random effect models lies in the role of dummy variables. If dummies are considered as a part of the intercept, this is a fixed effect model. In a random effect model, the dummies act as an error term. OLS regressions with dummies are fixed effect models.
Profitability Analysis
For the profitability analysis, this study first looks into the contribution of acquired company in terms of revenues generated through it, as it reflects how much share does the acquired company has in the revenues of acquiring company. Further, this study looked in the contribution made by acquired firm, at the segmental level of the acquiring firm.
From the profitability point of view, how much the acquisition has impacted the acquiring firm, taking revenues only in consideration, is insufficient, so, ratio analysis of the acquiring firm has been done. Some international studies, Sharma & Ho (2002), Bertrand and Betschinger 2012, Oduro and Ageyi (2013), Bortoluzzo et al., (2014) etc.., studied pre and post-merger profitability. In Indian context Mantravadi and Reddy (2008), Ramakrishnan (2008), Saboo and Gopi (2009) etc.., studied pre and post M&A profitability for acquiring companies. The above studies have compared pre and post M&A ratios for analysing the impact of M&A. This study looks in profitability measures for acquiring firms 2 years before the acquisition and 3 years post acquisition period, to assess the impact of M&A in long run and also calculates CAGR of the ratios from year of acquisition to 3 years post M&A. This study uses only absolute financial data for analysis, derived from annual reports of companies under study.
For measuring overall profitability, return on equity (roe) is taken as tool, which is universally accepted ratio for measuring profitability. Roe reflects how well the returns are generated on the shareholders’ money. For looking more into profitability roe is decomposed using dupont analysis. Dupont analysis breaks roe into return on assets (roa), net profit margin, asset turnover and financial leverage, this technique was introduced by du pont corporation. Using dupont analysis it is possible to get a clearer picture of post m&as profitability, i.e. whether profit margin, asset turnover or equity multiplier has been improved or deteriorated post m&a. This study uses absolute values of components used in analysis. For assets, this study uses gross block of assets given in balance sheets of relevant acquiring companies retrieved from annual reports of companies of relevant years palepu & healy (2014).

ROA, tells how the company has utilised its assets in generation of profits, as with acquisition there is certainly an increase in assets of acquiring firm, Financial Leverage on the other hand depicts, the usage of each rupee generated on account of shareholder’s investment.
The ROA can further decomposed as
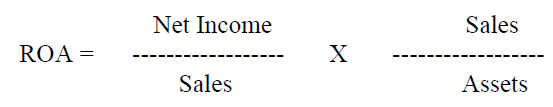
Net Profit Margin, Asset Turnover, ROA, Equity Multiplier and ROE of the acquiring companies depicts the impact of M&A post acquisition, as because of which factor the performance of acquiring company improved or deteriorated.
Results and Discussion
In this section, overall results of statistical analysis and profitability analysis of all the deals are presented, as shown in table 8; statistical model highlights of all deals studied are presented.
Firstsource Acquired Medassist
Statistical analysis shows an association between the rate of change of net profit of parent company and of the acquired company, the best fit model equation came out as

InvNewY is Inverse of NewY (detrended values of OldY (rate of change of net profit of acquiring company; Firstsource) and NewX2 is square of New X (rate of change of net profit of acquired company; MedAssist), which detrended values of NewX.
Differentiating the above equation we get
Δ InvNewY= -0.0000004788NewX,
It is visible that the change in rate of change of net profit of MedAsssist has a negligible impact on growth of the parent company.
It can be inferred that statistically there is no direct influence on the rate of change of net profit of Firstsource Solutions, by rate of change of net profit of acquired MedAssist Holdings.
Mphasis Acquired Princeton
Durbin Watson stat value is 1.261, which indicates in-conclusive auto-correlation, the rate of change of Net Profit of MPhasiS is found influenced by a negligible factor of rate of change of Net Profit of Princeton, thus there it can be inferred that there is negligible impact on growth of acquiring company by growth of acquired firm.
Subex Acquired Azure
On account of statistical analysis, it was observed that there is not any significant relationship between the growth of parent’s growth and acquired entity’s growth.
A one unit change in NewX (detrended rate of change of net profit of Subex (UK)), results in a change in opposite direction in rate of NewY (detrended relative change in profits of Subex Azure).
Based on above predictor, it can be inferred that the rate of change of net profit of Azure (UK), has no impact on the rate of change of net profit Subex Azure Ltd. The same is supported by balance sheet and P&L analysis of company’s annual reports.
Subex Acquired Syndesis
Regression analysis in this case fails to give any best fit model as the value of Independent variable (NewX) fluctuates from negative to positive integer values (-.020 -.013) the only statistical result of importance is Karl Person’s coefficient r = 0.391. However the model equation is given as follows:-
Logneg NewY= 2.532-0.004 NewX
As per the table 9, the standard coefficient is -0.391, converted in real terms it came out 0.4063≈ 0.41, and coefficient of independent variable (-0.004) when converted in real terms (taking anti log) depicts that 1% change in rate of change of net profit of acquired company causes a change of 0.990832 unit in rate of change of net profit of acquiring company in a negative direction (10-0.004≈ 0.990832) i.e. In dependent variable. The negative sign of the coefficient of independent variable indicates the negative relationship with the dependent variable, i.e. both the variables moves in opposite directions. Even if the coefficient of independent variable is assumed to be zero, then also the acquiring company would have made net profit growth of almost 0.41 units (log 2.532= 0.4034637013).
Following section describes the profitability analysis part of the study, in which acquiring firms’ profitability returns in terms of revenue generation and changes in profitability measures three years post acquisition are compared with two years prior acquisition is done.
|
Table 9 |
|||||
| FIRST SOURCE | |||||
|---|---|---|---|---|---|
| 2006 | 4.42 | 96.72 | 4.28 | 131.21 | 5.61 |
| 2007 | 11.83 | 64.36 | 7.61 | 118.99 | 9.06 |
| 2008 | 10.52 | 62.07 | 6.53 | 270.10 | 17.64 |
| 2009 | 1.76 | 63.05 | 1.11 | 201.49 | 2.23 |
| 2010 | 6.99 | 70.10 | 4.90 | 195.68 | 9.58 |
| 2011 | 6.98 | 68.83 | 4.80 | 205.37 | 9.87 |
| MPHASIS | |||||
| 2006 | 15.94 | 141.52 | 22.56 | 101.70 | 22.94 |
| 2007 | 10.23 | 174.09 | 17.81 | 100.95 | 17.98 |
| 2008 | 10.54 | 208.43 | 21.96 | 101.02 | 22.18 |
| 2009 | 21.31 | 181.53 | 38.69 | 100.18 | 38.76 |
| 2010 | 21.66 | 150.58 | 32.61 | 101.40 | 33.07 |
| SUBEX | |||||
| 2005 | 2.208 | 7.52 | 16.59 | 124.90 | 20.73 |
| 2006 | 0.209 | 99.43 | 20.74 | 100.76 | 20.90 |
| 2007 | 0.198 | 20.23 | 4.01 | 200.42 | 8.04 |
| 2008 | -0.140 | 28.89 | -4.05 | 222.96 | -9.03 |
| 2009 | -0.337 | 35.12 | -11.84 | 317.57 | -37.62 |
| 2010 | 0.238 | 50.24 | 11.98 | 320.58 | 38.40 |
Profitability Analysis
For the profitability analysis, this study first looks into the contribution of acquired company in terms of revenues generated through it, as it reflects company has in the revenues of acquiring company. Further, this study looked in the contribution made by acquired firm, at the segmental level of the acquiring firm.
Table-10 reflects how much share does the acquired company (MedAssist) has in the revenues of Firstsource. As it is visible that MedAssist had fairly high contribution in total revenues of FirstSource except in the year of acquisition. This may be because of better utilisation of MedAssist resources by FirstSource.
| Table 10 | |||
| Year | Revenue(FirstSource) | Revenue(MedAssist) | Percentage |
|---|---|---|---|
| 2008 | 1333.72 | 28.9 | 2.17 |
| 2009 | 1779.19 | 551.33 | 30.99 |
| 2010* | 1991.8 | 0 | 0.00 |
| 2011 | 2069.5 | 691.7 | 33.42 |
| 2012 | 2261.1 | 730 | 32.29 |
| 2013 | 2864.93 | 822.38 | 28.71 |
| 2014 | 3107.88 | 939.2 | 30.22 |
| Source-Annual Reports | |||
Further, Table-11 gives, the contribution made by acquired firm, at the segmental level of the Firstsource.
| Table 11 | |||
| Year | Segment Revenue (Healthcare) | Revenue(MedAssist) | Percentage |
|---|---|---|---|
| 2008 | 369.14 | 28.9 | 7.83 |
| 2009 | 698.82 | 551.33 | 78.89 |
| 2010 | 732.18 | 0 | 0.00 |
| 2011 | 718.36 | 691.7 | 96.29 |
| 2012 | 772.29 | 730 | 94.52 |
| 2013 | 900.72 | 822.38 | 91.30 |
| 2014 | 1016.49 | 939.2 | 92.40 |
| Source- Annual Reports All figures in Rs. Cr. * for year 2010, annual report was not available. | |||
Table -12 illustrates the percentage of revenue of Princeton in consolidated revenies of MPhasisS, Table-13 shows that, MPhasiS Consulting Ltd, i.e. the acquired company was not observed as major contributor in consolidated revenues of MPhasiS nor in the Application Services segment of MPhasiS. However Application Services segment may include revenue of various other subsidiaries of acquiring company. From segmental point of view also, the acquired company had a small share in the total revenues of segment as it can illustrated in Table-13
| Table 12 | |||
| Year | Revenue(Princeton) | Revenue(MPhasiS) | Percentage |
|---|---|---|---|
| 2007 | 51.11 | 1760.81 | 2.90 |
| 2008 | 59.5 | 2423.07 | 2.46 |
| 2009 | 43.73 | 4263.88 | 1.03 |
| 2010 | 46.55 | 5036.17 | 0.92 |
| 2011 | 31.05 | 5097.96 | 0.61 |
| 2012 | 28.8 | 5525.35 | 0.52 |
| 2013 | 23.91 | 5936.77 | 0.40 |
| 2014* | 9.47 | 2646.03 | 0.36 |
| Source- Annual Reports | |||
| Table 13 | |||
|---|---|---|---|
| Year | Segment Revenue(Application Services) | Revenue(Princeton) | Percentage of Revenue |
| 2007 | 1200.51 | 51.11 | 4.26 |
| 2008 | 1581.11 | 59.5 | 3.76 |
| 2009 | 2732.57 | 43.73 | 1.60 |
| 2010 | 3349.65 | 46.55 | 1.39 |
Information derived from annual reports of the acquiring company indicates that Azure (acquired company) was a major contributor in the total revenues of Subex Ltd. and therefore it can be interpreted that acquisition of Azure Solutions Ltd. certainly enabled Subex to expand its business and increasing its client base.
| Table 14 | |||
| Year | Total Revenue (Subex Azure ) | Total Revenue (Subex (UK) | Percentage |
|---|---|---|---|
| 2007 | 3710.92 | 1415.88 | 38.15 |
| 2008 | 5408.9 | 1521.27 | 28.13 |
| 2009 | 6034.8 | 3113.66 | 51.60 |
| 2010 | 4630.78 | 2892.44 | 62.46 |
| 2011 | 4925.92 | 3217.75 | 65.32 |
| 2012 | 4887.9 | 3809.53 | 77.94 |
| 2013 | 3314.71 | 3215.2 | 97.00 |
| 2014 | 3444.92 | 3238.087 | 94.00 |
|
Source- Annual Reports |
|||
Subex (UK), was a major contributor in segment of telecom products of Subex Azure Ltd, as observed from the annual reports of the company shows in table 15. The acquiring company reported its segment information in two categories of “Products” and “Services”. The operations of Subex (UK) falls into “Products” segment of the parent company which includes various Telecom software products.
| Table 15 | |||
| Year | Revenue(Azure) | Segment Revenue (Tele Products) | Percentage |
|---|---|---|---|
| 2007 | 141.85 | 228.77 | 62.01 |
| 2008 | 152.12 | 361.85 | 42.04 |
| 2009 | 160.6 | 438.49 | 36.63 |
| 2010 | 289.3 | 382.95 | 75.55 |
| 2011 | 321.77 | 418.18 | 76.95 |
| 2012 | 381 | 429.5 | 88.71 |
| 2013 | 312.52 | 307.34 | 101.69 |
| 2014 | 323.8 | 340.05 | 95.22 |
| Source- Annual Reports | |||
It is observed that despite making more than 50% of the total consolidated revenues of the parent company the profit of the year for Subex (UK), was very less in comparison of total revenue generated by Subex (UK), this perhaps may be due to high operating costs incurred.
With acquisition of Syndesis, management of Subex Azure was looking forward for expansion of its growth in area of telecom software domain, but the figures from annual reports showed a different picture. However the share of acquired company was noticeable in the consolidated revenues of acquiring company but, due to high operational costs the former always incurred a loss till 2013 shows in table 16.
| Table 16 | |||
| Year | Revenue(Syndesis) | Revenue(Subex) | Percentage |
|---|---|---|---|
| 2008 | 152.576 | 485.5 | 31.43 |
| 2009 | 148.16 | 558.48 | 26.53 |
| 2010 | 98.47 | 463.07 | 21.26 |
| 2011 | 120.54 | 482.75 | 24.97 |
| 2012 | 91.19 | 477.82 | 19.08 |
| 2013 | 27.28 | 331.47 | 8.23 |
| 2014 | 28.12 | 340.05 | 8.27 |
| source - Annual Reports | |||
| Table 17 | |||
| Year | Revenue(Syndesis) | Segment Revenue (Telecom Products) | Percentage |
|---|---|---|---|
| 2008 | 152.576 | 361.85 | 42.17 |
| 2009 | 148.16 | 438.49 | 33.79 |
| 2010 | 98.47 | 382.95 | 25.71 |
| 2011 | 120.54 | 418.18 | 28.82 |
| 2012 | 91.19 | 429.5 | 21.23 |
| 2013 | 27.28 | 307.34 | 8.88 |
| 2014 | 28.12 | 340.05 | 8.27 |
|
Source- Annual Reports |
|||
The overall impact of the acquisitions made by the firms are observed in the view of change in profitability measures three years post acquisition as compared to two years prior acquisition keeping the year of acquisition as base year. The following section describes the results for every acquiring firm and explained in Table 17.
Firstsource
After 2008, in which the acquisition was made, there was a constant reduction in all parameters of profitability. In 2009, specifically, there is a drastic decrease in Net Profit Margin, ROA and ROE, which, perhaps was a result of global recession as major clients of Firstsource were USA based. But in subsequent years also, reduction in all profitability measures is observed in (13% in Net Profit Margin, 9.83% in ROA and 17.6% in ROE). Firstsource was unable to utilise its assets to generate Net Income, which reflects inefficient use of assets, Net profit margin is also observed declining as compared to year of acquisition and one year before acquisition but higher than 2 years before acquisition. ROE is also reduced post acquisition, on account of reduction in ROA and Financial leverage.
MPhasiS
From the results obtained in statistical analysis and observations made from annual reports of MPhasiS it can be concluded that MPhasiS Consulting Ltd. (formerly Princeton) the acquired company did not influence the acquiring company’s profitability. However MPhasiS did not lose anything by acquiring Princeton because it was able to enter into new geographic market. From financial profitability point of view it was not beneficial for MPhasiS to acquire Princeton as the total profit generated by Princeton was nearly Rs. 15 Crore and the cost of acquisition of which was Rs 64 Crore. The overall profitability of MPhasiS improved one year post acquisition. The ROA and ROE increased by 22 % and Net Profit Margin increased by 28% three years after acquisition. But it is also notable that along with acquisition of Princeton, MPhasiS in the same year also acquired Eldorado Computing Inc., USA for nearly $ 17 Million and Electronic Data Systems Corporation (EDS) acquired majority stake in MPhasiS and EDS India (subsidiary of Electronic Data Systems Corporation) was merged with MPhasiS. The acquisition of MPhasiS by EDS and MPhasiS acquiring Princeton and Eldorado enabled both companies to expand their presence globally.
Subex
From the years of acquisition (2007 and 2008) of Azure and Syndesis, continuous decline in profit of the acquiring company is observed. The operating costs of Subex Azure had gone higher throughout the years post acquisition which reflects inefficiency in operations. This is supported by observing Net Profit Margin, ROA and ROE, which went negative continuously for 2 years post acquisition (-0.140, -0.337; -4.05, -11.84; -9.03, -37.62; respectively) but both of these parameters were found positive 2 two years prior acquisitions. But three years post acquisition all the parameters turned positive. It means post acquisition Subex Azure was not able to handle the operations and the debt taken to finance these acquisitions especially of Syndesis.
Panel Data Analysis
To study the combined effect of acquisition deal on rate of change of net profit of acquirer (dependent variable, NewY), by rate of change of net profit of acquired firm (independent variable, NewX), along with some other aspects which came with the acquisition of subsidiary to the parent company, panel data was constructed which included dummy variables which were recognised to be earned by the acquirer companies from the acquired companies (subsidiaries after acquisition). The dummy variables introduced in panel data were shortlisted as the additional benefits which the acquirers expect to gain post acquisition (annual reports of various companies) apart from assets and employees are-
1. Acquisition of Intellectual Property Rights (IPRs)
2. Entry in new geographic area/new markets
3. Entry in new business segment/ vertical
In the model, G means entry in new geographic area/new markets and N means entry in new business segment/ vertical.
Cameron and Trivedi (2009) gave explanation for using dummy variables in pooled model as follows.
A linear model for panel data permits the intercepts and slop coefficients to vary over both individual and time time, shown in Table 18.

Here, yit is dependent variable, and xit is a Kx1vector of independent variables, εit is error term. This model is too general and it is not estimable as there are more parameters to estimate than observations. Further restrictions need to be placed on the context to which ait and bit vary with i and t, and on the behaviour of error term.
| Table 18 | |||
| Estimator of b | Pooled | Assumed ModelRandom Effects | Fixed Effects |
|---|---|---|---|
| Pooled OLS | Consistent | Consistent | Inconsistent |
| Fixed Effects | Consistent | Consistent | Consistent |
| Random Effects | Consistent | Consistent | Inconsistent |
Pooled Model
The most restrictive model is pooled model that specifies constant coefficients, the usual assumption for cross-section analysis, so that

If this model is correctly specified and regressors are uncorrelated with error term then it can be consistently estimated using Pooled OLS. The error term is likely to be correlated over time for a given individual, however in which case the usual reported standard errors should not be used as they can be greatly downward biased. Furthermore, the pooled estimator is inconsistent if the fixed effects model, defined in the following is appropriate.
Individual and Time Dummies
A simple variant of the model (1) permits intercepts to vary across individuals and over time while slope parameters do not. Then

where the N individual dummies, dj, it equal one if i = j and equal zero otherwise, the (T-1) time dummies ds, it equal one if t=s and equal zero otherwise, and it is assumed that xit does not include and intercept ( if an intercept is included then one of the N individual dummies must be dropped). This model has N+ (T-1) +dim [x] parameters that can be consistently estimated if both N→∞ and T→∞. We focus on short panels where N→∞ but T does not. Then μs can be consistently estimated, so the (T-1) time dummies are simply incorporated into regressors xit.
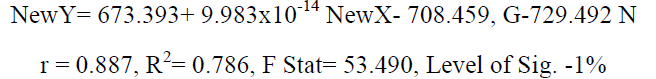
The panel data was analysed using pooled regression method and following results are obtained in Table 19:
The model equation came out to be
| Table 19 : Model Summary | |||||||
| Model | R | R Square | Adjusted R Square | Std. Error of the Estimate | Change Statistics | ||
|---|---|---|---|---|---|---|---|
| R Square Change | F Change | df1 | |||||
| 1 | .887a | .786 | .772 | 255.05005438 | .786 | 53.930 | 3 |
| Table 20: Model Summary | ||||
| Change Statistics | ||||
|---|---|---|---|---|
| Model | df2 | Sig. F Change | ||
| 1 | 44 | .000 | 2.106 | |
| Source- Author’s Analysis | ||||
| Table 21: Coefficients | |||||||
|---|---|---|---|---|---|---|---|
| Unstandardized Coefficients | Standardized Coefficients | ||||||
| Model | B | Std. Error | Beta | T | Sig. | ||
| 1 | (Constant) | 673.393 | 93.941 | 7.168 | .000 | ||
| NewX | 9.983E-14 | .000 | .404 | 5.349 | .000 | ||
| G | -708.459 | 95.584 | -.632 | -7.412 | .000 | ||
| N | -729.492 | 94.552 | -.640 | -7.715 | .000 | ||
The dependent variable was found significantly correlated with independent variable, but one unit change in NewX has a negligible effect on NewY, the factors Entry in new geographical area and Entry in new business segment does not significantly influence NewY [T Stat( -7.412, -7.715)]. The results of Panel Data Analysis, coincides with the results obtained in Statistical Analysis of individual deals given in Table 20. The result also suggests that the factors for which Indian IT firms internationalized (entry in new markets and entry in new verticals), does not influence positively the growth of the acquiring firms and shown clearly in Table 21. This argument is supported by looking into the profitability measures in the study, which suggests that the acquiring firms’ profitability had been deteriorated post acquisition in medium to long run.
Following points are also noteworthy:
1. Subex Azure 2009 data was an outlier (at least in dependent variable) and hence was removed.
2. IPR as a dummy variable showed low confidence and was not considered. In regression
3. Newx and Newy in pooled data exhibit normal distribution.
Discussion
In contrast to previous studies, this study has proposed ‘deal based’ study of cross border acquisitions to study the impact of acquisitions on the acquiring firms. Unlike previous studies, in which the impact of acquisitions were analysed by measuring the post-acquisition profitability of acquiring firms in short or long term by considering the growth or decline in firm’s performance only as a result of M&A activity ignoring the fact that any change in firm’s profitability is not solely dependent on M&A activity but a number of external and internal factors influences any firm’s performance. Several studies suggested role of various factors in acquiring firms’ profitability, some of the studies are; Datta (1991) studied a sample of 191 acquisitions of more than $1 million of U.S. manufacturing and mining sectors during the period January 1980-March 1984 concluded that difference in management styles influence acquisition performance. Higgs (1999) argued that reasons for success can be present in either Product/market relatedness or strategic similarity between a firm’s business units. It was observed that greater the degree of strategic similarity among business units, the better is the performance. Author’s sample consisted of 1,100 firms which had indulged in M&A activities between 1970 and 1989. Ahammad & Glaister (2013) concluded pre-acquisition analysis of acquired firms also influences the acquisition performance and a thorough analysis conducted prior to acquisition improves performance of acquiring firm. Clelland et al (2006) studied 250 corporations with 1762 manufacturing facilities with regard to attaining competitive advantage through resource based view. It was observed that for value creation in a competitive environment that acquisition of external strategic assets could either result in a cost advantage or a differentiation advantage relative to competitors. McCrea and Betts (2008) in continuation of development of competitive advantage work/research explored the concept of corporate entrepreneurship in light of threat coming in through M&A s in particular with regard to new product development. Lack of corporate entrepreneurship culture as a matter of strategic tool can significantly result in loss of competitive advantage. Indian companies, though initiated by entrepreneurs but corporate entrepreneurship as a culture is a missing element. This can in global context is a negative factor Capron & Chen (2007) outlined that the ownership of acquired firm also influence acquiring firm’s performance. One of the conclusions is that private acquiring firms get better results when they acquire public firms and acquiring firms being public firms get benefit from acquiring private firms. The study had a sample of 101 firms out of which fifty two were publicly held and forty were private and remaining nine ignored as they were state owned. This study therefore attempted to find the significant relationship between the acquiring and acquired firms’ financial performance to conclude whether the acquisition activity undertaken by a firm actually contributes to profitability.
Limitations and Directions of Future Research
M&A activity is not merely a financial decision rather it is a strategic decision which reflects long term vision of acquiring firm. Porter’s Diamond model is often used for successful internationalisation of firms. Factor conditions, Government and Strategy have major factors in growth of cross border acquisitions by Indian IT industry firms. Acquisitions, especially cross border are more complex in nature and bear more complexities in integrating acquired firms as compared to domestic M&As; therefore the post-acquisition profitability analysis becomes more complex. This study attempted to find the impact of individual acquired firms and thus proposed a methodology in which direct relationship between the acquiring firm and acquired firm is observed. However, the limitations of this study are it uses only financial parameters for analysis. Role of regulators and Foreign Institutions are also left out because these are relatively recent events in Indian corporate sector.
The acquisition of firm must be thought in terms of both strategic and organizational fit as quoted by Jemison and Sitkin (1986). The future studies can include some more parameters such as Human Resource aspects, such as attrition rate in both acquiring and acquired firms’ pre and post-acquisition may influence the acquisition performance. As it was empirically tested by Datta (1991) that difference in management styles influence acquisition performance and coordination at top management level also influence the post-acquisition performance as found by Krishnan et al (1997). Thus it can be important factor which may influence the post-acquisition profitability.
The acquiring firm’s pre acquisition performance may also influence the post-acquisition performance as argued by Nnandi (2014) that acquiring firm’s capital strength and cost efficiency were most important factors influencing profitability in cross-border mergers. It must be noted that the acquiring firm’s capability to integrate the acquired firm also influences the post-acquisition profitability in case of cross border acquisitions. An important point raised by Hahn and Powers (2010) in a study of M&A s in banking sector in USA was that mixing of cost leadership strategies with product differentiation left those banks with depressed ROAs. This is an important point, which is in resonance with overall observations from the research done on M&A s activities by Indian IT companies.As it was founded in this study; Subex Azure was not able to handle the operations post acquisition, especially in acquisition of Syndesis.
Experience in acquisitions of acquiring firm had been a factor which was found influencing the post-acquisition profitability. Fowler and Scmidt (1989), found age of acquiring firm important in post-acquisition success but it must be noted that consistent findings for this factor does not exist King et al (2004). Zollo and Singh (2004) found knowledge codification strongly and positively influences acquisition performance, rather than acquisition experience. It was also argued that level of integration was found significant post-merger performance but replacement in top management in the acquired firm negatively impacts performance, ceteris paribus. Perhaps, the age of acquired firm must also be considered in analysing the post-acquisition profitability as the firms being acquired must have achieved various economies of scale with time, which can influence the acquiring firm’s profitability post acquisition. King et al (2004) concluded that most commonly studied factors in M&A researches (Conglomerate acquisitions, related acquisitions, mode of payment and prior acquisition experience) do not impact post acquisition performance.
Moreover, it must be noted that from the above discussion, it appears that it will not be advisable to conclude that changes in acquiring firm’s performance is solely dependent on M&A activity as many factors influence the profitability of firm. A firm undergoes M&A for attaining inorganic growth; thus for analysing post acquisition performance strategic factors along with the organisational factors must be included in the approach. As this study tried to find direct impact of the acquired firm on the acquiring firm attempts must be made to study direct impact of acquired firms with including more of the strategic and organisational factors.
Conclusion
This study attempted to assess the impact of the cross border acquisitions on the acquiring Indian IT firms, through finding out, if the change in net income growth of them is influenced by the change in net income growth of acquired firm(s) and measuring the profitability measures changed post acquisition. For the sample firms it can be concluded that the acquired firms did not contribute in the growth of the acquiring companies because the statistical results suggest, negligible effect of rate of change of net profit of acquired firm on rate of change of net profit of acquiring firm. The main reason for these firms to internationalise was to acquire strategic assets including, IP assets, technical know-how, new market areas. Thus the main motive of the firms was not to gauge profits out of them rather was to expand their outreach at the global level in terms of geography and working verticals. So Indian IT firms used the revenues generated from the acquired firms to expand internally in gaining expertise in software verticals and increasing market penetration. For example, one year after the acquisition TCS opened its solution centre in Ecuador, named Tata Solution Centre, Ecuador fthrough its subsidiaries, TCS BPO Chile S.A (previously Comicrom) and TCS Inversiones Chile Limitada. The new facility was setup to provide services in banking sector of Latin America and China as, TCS got new projects in the regions. Infosys after acquiring Expert Information Systems, got support of acquired firm in designing and building business solutions for existing clients and the acquired firm was dissolved in 2013 after receiving the dividend. In case of Firstsource, MedAssist was acquired as strategic move to create long term value by entering in Revenue Cycle Management Services vertical in which MedAssist was a leading provider. In case of MPhasiS, Princeton enabled it to enter into new market segments and acquire new clients. Subex on the other hand acquired Azure Solutions with a strategy of entering in new segment of Interconnect Billing and entering into Service Fulfilment by acquiring Syndesis. The study’s results show that TCS, Firstsource and Subex were not able to fully utilize the strategic resources which they acquired along with the companies in terms of reduced Net Profit Margin, ROA and ROE with exceptions being Infosys and MPhasiS, although the revenues and Net profits increased for all the acquiring firms in long term. Overall, it can be inferred that the acquired firms are not the driving force of growth for Indian IT sector firms which made overseas acquisitions. However the acquiring firms were able to expand their global presence and client base.
References
- "1">Abbas, Q., Hunjra, A.I., Saeed, R. & Ijaz, M.S. (2014). Analysis of pre and post-merger and acquisition financial performance of banks in Pakistan. Information Management and Business Review, 6 (4), 177.
- "2">Agrawal, A., Jaffe, J.F. & Mandelker, G.N. (1992). The post-merger performance of acquiring firms: A re-examination of an anomaly. The Journal of Finance, 47(4), 1605-1621.
- "3">Ahammad, M.F. & Glaister, K.W. (2013). The pre-acquisition evaluation of target firms and cross border acquisition performance. International Business Review, 22(5), 894-904.
- "4">Andre, P., Kooli, M. & L'her, J.F. (2004). The long-run performance of mergers and acquisitions: Evidence from the Canadian stock market. Financial Management, 33(4), 27-43.
- "5">Ashfaq, K., Usman, M., Hanif, Z. & Yousaf, T. (2014). Investigating the impact of merger & acquisition on post-merger financial performance (relative & absolute) of companies (evidence from non-financial sector of pakistan). Research Journal of Finance and Accounting, 5(13), 88?102.
- "6">Akben-Selcuk, E. & Altiok-Yilmaz, A. (2011). The impact of mergers and acquisitions on acquirer performance: Evidence from Turkey. Business and Economics Journal, 22, 1-8.
- "7">Asquith, P., Bruner, R.F. & Mullins, D.W. (1983). The gains to bidding firms from merger. Journal of Financial Economics, 11(1), 121-139.
- "8">Bajpai, N. (2010). Business Statistics. Pearson Education (P) Limited: NewDelhi.
- "9">Bertrand, O. & Betschinger, M.A. (2012). Performance of domestic and cross-border acquisitions: Empirical evidence from Russian acquirer?s. Journal of Comparative Economics, 40(3), 413-437.
- "10">Boateng, A., Qian, W. & Tianle, Y. (2008). Cross-border M&As by Chinese firms: An analysis of strategic motives and performance. Thunderbird International Business Review, 50(4), 259-270.
- "11">Bortoluzzo, A.B., Garcia, M.P.D.S., Boehe, D.M. & Sheng, H.H. (2014). Performance in cross-border mergers and acquisitions: An empirical analysis of the Brazilian case. Revista de Administração de Empresas, 54(6), 659-671.
- "12">Bruner, R.F. (2002). Does M&A pay? A survey of evidence for the decision-maker. Journal of Applied Finance, 12(1), 48-68.
- "13">Cameron, C.A. & Trivedi, P.K. (2009). Microeconomics: Methods and applications. New York: Cambridge University Press.
- "14">Carnes, T., Black, E. & Jandik, T. (2001). The long-term success of cross-border mergers and acquisitions. Available at SSRN 270288, (501). Retrieved from http://papers.ssrn.com/sol3/papers.cfm?abstract_id=270288http://doi.org/10.2139/ssrn.270288
- "15">Capron, L. & Shen, J.C. (2007). Acquisitions of private vs. public firms: Private information, target selection, and acquirer returns. Strategic Management Journal, 28(9), 891-911.
- "16">Chakrabarti, R. (2007). Do Indian Acquisitions Add Value? ICRA Bulletein Money & Finance. Retrieved from http://citeseerx.ist.psu.edu/viewdoc/download?doi=10.1.1.687.7778&rep=rep1&type=pdf, 61-74
- "17">Chandrawanshi, A.G. & Banerji, A. (2014). Review of Outward Foreign Direct Investment from India Post Liberalization. American Journal of Business Research, 7(1), 19-44
- "18">Changqi, W. & Ningling, X. (2010). Determinants of cross-border merger & acquisition performance of Chinese enterprises. Procedia - Social and Behavioral Sciences, 2(5), 6896?6905.
- "19">Chen, Y. & Lin, C. (2009). Performance of Cross-Border Mergers and Acquisitions (M&a?s) By Chinese Firms. Journal of Business Strategy, 145?184.
- "20">Clelland, I.J., Douglas, T.J. & Henderson, D.A. (2006). Testing resource-based and industry factors in a multi-level model of competitive advantage creation. Academy of Strategic Management Journal, 5, 1-24.
- "21">Conn, R. & Cosh, A. (2003). The Impact on U.K. Acquirers of Domestic, Cross-Border, Public and Private Acquisitions. ESRC Centre for Business Research, University of Cambridge Working Paper No 276.
- "22">Joze Damijan, J., Kostevc, C. & Rojec, M. (2011). Post-acquisition performance of firms acquired in cross-border acquisitions: theoretical considerations and empirical evidence. - El. knjiga. - Ljubljana: Faculty of Social Sciences, 2011. Electronic book series CIR analyses. Retrieved from http://knjigarna.fdv.si/s/u/pdf/410.pdf
- "23">Daniels, J.D., Radebaugh, H.L., Sullivan, P.D. & Salwan, P. International Business: Environment & Operations 12e. Perason
- "24">Datta, D.K. (1991). Organizational fit and acquisition performance: Effects of post-acquisition integration. Strategic Management Journal, 12(4), 281-297.
- "25">Delios, A., Gaur, A.S. & Kamal, S. (2009). International acquisitions and the globalization of firms from India. Expansion of trade and FDI in Asia: Strategic and policy challenges, 58-76.
- "26">Deng, P. & Yang, M. (2014). Cross-border mergers and acquisitions by emerging market firms: A comparative investigation. International Business Review, 24(1), 157?172.
- "27">Dutta, S. & Jog, V. (2009). The long-term performance of acquiring firms: A re-examination of an anomaly. Journal of Banking & Finance, 33(8), 1400-1412.
- "28">Erel, I., Jang, Y. & Weisbach, M.S. (2015). Do acquisitions relieve target firms? financial constraints?. The Journal of Finance, 70(1), 289-328.
- "29">Faktorovich, M. (2008). Globalization: How Successful are Cross-border Mergers and Acquisitions?. Glucksman Institute for Research in Securities Markets. 28-57. Retrieved fromhttp://www.stern.nyu.edu/sites/default/files/assets/documents/uat_024315.pdf
- "30">Feys, C. & Manigart, S. (2010). The post-acquisition performance of acquired entrepreneurial firms. Frontiers of Entrepreneurship Research, 30(1), 2.
- "31">Firstsource Solutions (2008). Annual Report 2008. Retrieved from http://www.firstsource.com/us/investors-financial-results2008
- "32">Firstsource Solutions (2009). Annual Report 2009. Retrieved from http://www.firstsource.com/us/investors-financial-results2009
- "33">Firstsource Solutions (2011). Annual Report 2011. Retrieved from http://www.firstsource.com/us/investors-financial-results2011
- "34">Firstsource Solutions (2012). Annual Report 2012. Retrieved from http://www.firstsource.com/us/investors-financial-results2012
- "35">Firstsource Solutions (2013). Annual Report 2013. Retrieved from http://www.firstsource.com/us/investors-financial-results2013
- "36">Firstsource Solutions (2014). Annual Report 2014 Retrieved from http://www.firstsource.com/us/investors-financial-results2014
- "37">Fowler, K.L. & Schmidt, D.R. (1989). Determinants of tender offer post-acquisition financial performance. Strategic Management Journal, 10(4), 339-350.
- "38">Grant Thornton (2007). DealTracker. Annual edition 2007
- "39">Grant Thornton (2008). DealTracker. Annual edition 2008
- "40">Grant Thornton (2009). DealTracker. Annual edition 2009
- "41">Grant Thornton (2010). DealTracker. Annual edition 2010
- "42">Grant Thornton (2011). DealTracker. Annual edition 2011
- "43">Grant Thornton (2012). DealTracker. Annual edition 2012
- "44">Grant Thornton (2013). DealTracker. Annual edition 2013
- "45">Grant Thornton (2014). DealTracker. Annual edition 2014
- "46">Hahn, W. & Powers, T.L. (2010). Strategic plan quality, implementation capability, and firm performance. Academy of Strategic Management Journal, 9(1), 63.
- "47">Healy, P.M., Palepu, K.G. & Ruback, R.S. (1992). Does corporate performance improve after mergers?. Journal of financial economics, 31(2), 135-175.
- "48">Higgs, R.C. (1999). Corporate Acquisitions and Mergers: An Alternative Inquiry into the Relationship Between Corporate Diversification and Performance. Academy of Strategic and Organizational Leadership Journal, 3(2) 39-54.
- "49">Infosys Technologies (2005) Annual Report 2005. Retrieved from https://www.infosys.com/investors/reports-filings/annual-report/Pages/index.aspx
- "50">Infosys Technologies (2006) Annual Report 2006. Retrieved from https://www.infosys.com/investors/reports-filings/annual-report/Pages/index.aspx
- "51">Infosys Technologies (2007) Annual Report 2007. Retrieved from https://www.infosys.com/investors/reports-filings/annual-report/Pages/index.aspx
- "52">Infosys Technologies (2008) Annual Report 2008. Retrieved from https://www.infosys.com/investors/reports-filings/annual-report/Pages/index.aspx
- "53">Infosys Technologies (2009) Annual Report 2009. Retrieved from https://www.infosys.com/investors/reports-filings/annual-report/Pages/index.aspx
- "54">Infosys Technologies (2010) Annual Report 2010. Retrieved from https://www.infosys.com/investors/reports-filings/annual-report/Pages/index.aspx
- "55">Infosys Technologies (2011) Annual Report 2011. Retrieved from https://www.infosys.com/investors/reports-filings/annual-report/Pages/index.aspx
- "56">Infosys Technologies (2012) Annual Report 2012. Retrieved from https://www.infosys.com/investors/reports-filings/annual-report/Pages/index.aspx
- "57">Infosys Technologies (2013) Annual Report 2013. Retrieved from https://www.infosys.com/investors/reports-filings/annual-report/Pages/index.aspx
- "58">Infosys Technologies (2014) Annual Report 2014. Retrieved from https://www.infosys.com/investors/reports-filings/annual-report/Pages/index.aspx
- "59">Inoti, G.G., Onyuma, S.O. & Muiru, M.W. (2014). Impact of acquisitions on the financial performance of the acquiring companies in Kenya: A case study of listed acquiring firms at the Nairobi securities exchange. Journal of Finance and Accounting, 2, 108-115.
- "60">Jemison, D.B. & Sitkin, S.B. (1986). Corporate acquisitions: A process perspective. Academy of Management Review 11, 145-163.
- "61">Kan, K. & Ohno, T. (2012). Merger of major banks from the EVA standpoint. Public Policy Review, 8(5), 737-774.
- "62">Kaplan, S. & Weisbach, M. (1992). The success of acquisitions: Evidence from divestitures. The Journal of Finance, 47(1), 107-138
- "63">King, D.R., Dalton, D.R., Daily, C.M. & Covin, J.G. (2004). Meta-analyses of post-acquisition performance: Indications of unidentified moderators. Strategic management journal, 25(2), 187-200.
- "64">Kohli, R. (2013). Analyzing the long run financial performance of cross border acquisitions of Indian acquiring companies. 37?43.
- "65">Kohli, R. & Mann, B.J.S. (2012). Analyzing determinants of value creation in domestic and cross border acquisitions in India. International Business Review, 21(6), 998-1016.
- "66">Krishnan, H.A., Miller, A. & Judge, W.Q. (1997). Diversification and top management team complementarity: Is Performance improved by merging similar or dissimilar teams?. Strategic Management Journal 18(5), 361-374.
- "67">Kumar, R. (2009). Post-merger corporate performance: An Indian perspective. Management Research News, 32(2),145-157.
- "68">Kumar, R. & Rajib, P. (2007). Characteristics of Merging Firms in India: An Empirical Examination. Vikalpa, 32(1), 27?44.
- "69">Kyriazis, D. (2010). The long-term post-acquisition performance of Greek acquiring firms. International Research Journal of Finance and Economics, 43, 69-79.
- "70">Leepsa, N. & Misra, C.S. (2012). Post-Acquisition Performance of Indian Manufacturing Companies: An Empirical Analysis. Asia-Pacific Finance and Accounting Review, 1(1), 17-33.
- "71">Leepsa, N.M. (2015). Review of Past Studies on Post M&A Performance in Manufacturing Sector: The Road Not Taken in India. Paper Presented to the World Finance & Banking Symposium, Singapore. 12-13.
- "72">Mallikarjunappa, T. & Nayak, P. (2013). A Study of Wealth Effects of Takeover Announcements in India on Target Company Shareholders. Vikalpa, 38(3), 23-49.
- "73">Mann, B.J.S. & Kohli, R. (2011). Target shareholders' wealth creation in domestic and cross-border acquisitions in India. International Journal of Commerce and Management, 21(1), 63-81.
- "74">Mantravadi, D.P. & Reddy, A.V. (2008). Post-merger performance of acquiring firms from different industries in India. International Research Journal of Finance and Economics, 22, 192?203.
- "75">McCrea, E. & Betts, S.C. (2008). Failing to learn from failure: An exploratory study of corporate entrepreneurship outcomes. Academy of Strategic Management Journal, 7, 111-133
- "76">Meeks, G. (1977). Disappointing Marriage: A Study of the Gains From Merger, Cambridge University Press. Cambridge.
- "77">Mishra, P. & Chandra, T. (2010). Mergers, acquisitions and firms? performance: Experience of Indian pharmaceutical industry. Eurasian Journal of Business and Economics, 3(5), 111-126.
- "78">Moeller, S.B., Schlingemann, F.P. & Stulz, R.M. (2004). Firm size and the gains from acquisitions. Journal of Financial Economics, 73(2), 201-228.
- "79">MPhasiS Limited (2007). Annual Report 2007. Retrieved from http://www.mphasis.com/financial-results.html
- "80">MPhasiS Limited (2008). Annual Report 2008. Retrieved from http://www.mphasis.com/financial-results.html
- "81">MPhasiS Limited (2009). Annual Report 2009. Retrieved from http://www.mphasis.com/financial-results.html
- "82">MPhasiS Limited (2010). Annual Report 2010. Retrieved from http://www.mphasis.com/financial-results.html
- "83">MPhasiS Limited (2011). Annual Report 2011. Retrieved from http://www.mphasis.com/financial-results.html
- "84">MPhasiS Limited (2012). Annual Report 2012. Retrieved from http://www.mphasis.com/financial-results.html
- "85">MPhasiS Limited (2013). Annual Report 2013. Retrieved from http://www.mphasis.com/financial-results.html
- "86">MPhasiS Limited (2014). Annual Report 2014. Retrieved from http://www.mphasis.com/financial-results.html
- "87">Mphasis Limited (2005) New Release Retrieved from http://www.mphasis.com/downloads/Press%20Releases/NewsRelease_Princeton.htm
- "88">Mueller, D.C. (1980). The determinants and effects of mergers: An international comparison. 24.Narayan, P.K. (2005). The saving and investment nexus for China: Evidence from cointegration tests. Applied Economics, 37(17), 1979?1990.
- "89">Nnadi, M.A. & Tanna, S. (2014). Post-acquisition profitability of banks: a comparison of domestic and cross-border acquisitions in the European Union. Global Business and Economics Review, 16(3), 310-331.
- "90">Oduro, I. & Agyei, S. (2013). Mergers & Acquisition and Firm Performance: Evidence from the Ghana Stock Exchange. Research Journal of Finance and Accounting, 4(7), 99-107.
- "91">Palepu, K.G. & Healy, P.M. (2013). Financial Analysis in Business Analysis & Valuation: Using Financial Statements (5e). Delhi: Cengage
- "92">Pawaskar, V. (2001). Effect of mergers on corporate performance in India. Vikalpa, 26(1), 19-32.
- "93">Pham, L.H. (2014). An Analysis of Pre and Post-Acquisition Financial Performance of Target Czech Banks: A Comparative Analysis. Journal of Eastern European and Central Asian Research (JEECAR), 1(2), 1-11.
- "94">Ramakrishnan, K. (2008). Long-term post-merger performance of firms in India. Vikalpa, 33(2), 47-63.
- "95">Rani, N., Surendra, S.Y. & Jain, P.K. (2015). Financial performance analysis of mergers and acquisitions: evidence from India. International Journal of Commerce and Management, 25(4), 402?423.
- "96">Rau, P.R. & Vermaelen, T. (1998). Glamour, value and the post-acquisition performance of acquiring firms. Journal of Financial Economics, 49(2), 223-253.
- "97">Ravenscraft, D.J. & Scherer, F.M. (1987). Mergers, sell-offs, and economic efficiency. Brookings Institution Press.
- "98">Saboo, S. & Gopi, S. (2009). Comparison of Post-Merger performance of Acquiring Firms (India) involved in Domestic and Cross-border acquisitions. MPRA paper, 19.
- "99">Satish, K. & Lalit, K.B. (2012). The Impact of Mergers and Acquisition on Corporate Performance in India. Management Decision, 46(10), 1531?1543.
- "100">Saxena, R. & Sen, A. (2013). Overseas acquisitions by Indian IT firms to rise in 2013.
- "101">Sharma, D.S. impact of acquisitions on operating performance: Some Australian evidence. Journal of Business Finance & Accounting, 29(1-2), 155-200.
- "102">Schoenberg, R. (2006). Alternative Metrics. British Journal of Management, 17(4), 361-370.
- "103">Sinha, P. & Gupta, S. (2011). Mergers and Acquisitions: A pre-post analysis for the Indian financial services sector. MPRA Paper No. 31253.
- "104">Sirower, M.L. & O'Byrne, S.F. (1998). The Measurement of Post-Acquisition Performance: Toward a Value-Based Benchmarking Methodology. Journal of Applied Corporate Finance, 11(2), 107-121.
- "105">Subex Limited (2007). Annual Report 2007. Retrieved from http://www.subex.com/annual-reports/
- Subex Limited (2008). Annual Report 2008. Retrieved from http://www.subex.com/annual-reports/
- Subex Limited (2009). Annual Report 2009. Retrieved from http://www.subex.com/annual-reports/
- Subex Limited (2010). Annual Report 2010. Retrieved from http://www.subex.com/annual-reports/
- "109">Subex Limited (2011). Annual Report 2011. Retrieved from http://www.subex.com/annual-reports/
- "110">Subex Limited (2012). Annual Report 2012. Retrieved from http://www.subex.com/annual-reports/
- "111">Subex Limited (2013). Annual Report 2013. Retrieved from http://www.subex.com/annual-reports/
- "112">Subex Limited (2014). Annual Report 2014. Retrieved from http://www.subex.com/annual-reports/
- "113">Sudarsanam, P.S. & Gao, L. (2004). Value Creation in UK High Technology Acquisitions. SSRN Electronic Journal, (December), 1?47.
- "114">Tata Consultancy Services (2006). Annual Report 2006. Retrieved from http://www.tcs.com/investors/financial_info/Pages/default.aspx
- "115">Tata Consultancy Services (2007). Annual Report 2007 Retrieved from http://www.tcs.com/investors/financial_info/Pages/default.aspx
- "116">Tata Consultancy Services (2008). Annual Report 2008. Retrieved fromhttp://www.tcs.com/investors/financial_info/Pages/default.aspx
- "117">Tata Consultancy Services (2009). Annual Report 2009. Retrieved fromhttp://www.tcs.com/investors/financial_info/Pages/default.aspx
- "118">Tata Consultancy Services (2010). Annual Report 2010. Retrieved from http://www.tcs.com/investors/financial_info/Pages/default.aspx
- "119">Tata Consultancy Services (2011). Annual Report 2011. Retrieved fromhttp://www.tcs.com/investors/financial_info/Pages/default.aspx
- "120">Tata Consultancy Services (2012). Annual Report 2012. Retrieved from http://www.tcs.com/investors/financial_info/Pages/default.aspx
- "121">Tata Consultancy Services (2013). Annual Report 2013. Retrieved fromhttp://www.tcs.com/investors/financial_info/Pages/default.aspx
- "122">Tata Consultancy Services (2014). Annual Report 2014. Retrieved from http://www.tcs.com/investors/financial_info/Pages/default.aspx
- "123">Tripathi, V. & Lamba, A. (2015). Does Financial Performance Improve Post Cross Border Merger and Acquisitions?. A Detailed Study of Indian Acquirer Firms' Financial Performance Across Target Economy's Development Status and Financial Crisis. Research Journal of Social Science & Management, 4(9), 325?342.
- "124">Verma, N. & Sharma, R. (2004). Impact of Mergers & Acquisitions on Firms? Long Term Performance: A Pre & Post Analysis of the Indian Telecom Industry. IRACST- International Journal of Research in Management & Technology (IJRMT), 4(1). 11-19.
- "125">Woolridge, J.M. (2013). Introductory Econometrics: A Modern Approach. Cengage.
- "126">Xiao, X. & Tan, L. (2009). Research of M&A Performance of Listed Companies in China Based on EVA. In Electronic Commerce and Business Intelligence, 2009. ECBI 2009, International Conference on (pp. 337-340).
- "127">Xue, S. & Yang, D. (2006). Introduction to EVA Theoretical System and Analysis of Its Applicability in China.Science & Technology Information, 136-138.
- "128">Yang, J. (2012). Interpreting Coefficients in Regression with Log-Transformed Variables. StatNews #83 Cornell Statistical Consulting Unit.
- "129">Zollo, M. & Singh, H. (2004). Deliberate learning in corporate acquisitions: Post-acquisition strategies and integration capability in US bank mergers. Strategic Management Journal, 25(13), 1233-1256.