Research Article: 2017 Vol: 16 Issue: 3
Analysis of the Causal Relationships among Factors Affecting Community Well-Being for Living Based on Systems Thinking: The Cases of Korean Local Communities
Young Chool Choi, Chungbuk National University
Ji Hyun Jang, Sangmyung University
Keywords
Community, System Thinking, Casual Relationship.
Introduction
Leading classical economists argue that an increase in income is one of the most important factors affecting the increasing of happiness. However, Easterlin (1974) argues that from a whole-society point of view, an increase in national income is not proportional to an increase in happiness. Following Easterlin’s proposition, a great deal of research has been carried out investigating the factors associated with happiness over a short time-period. As a result of research on happiness conducted from a sociological, economic and public administration point of view, similar terms to happiness, such as ‘well-being’, ‘quality of life’ and ‘life satisfaction’, have been generated. Although the factors which these terms have primarily emphasized have been different, in the real world it is not easy to differentiate between them. Of these similar terms, this paper addresses ‘community well-being’, which currently occupies the attention of a number of scholars but which has nevertheless not been discussed in depth. In so doing it attempts to identify the causal structure of the factors associated with community well-being and to put forward a number of theoretical and policy-related suggestions for increasing it.
Theoretical Discussion and Literature Review
Similar Terms: Happiness, Well-Being, Quality of Life, Life Satisfaction
The classical origin of happiness relates back to the idea of hedonism. Hedonism in ancient times was divided into physical and spiritual pleasure and was approached from an individual rather than a collective point of view. That is to say, happiness was primarily linked to the maximization of pleasure from an individual point of view. Happiness has been a topic of interest for many centuries, from the period of Ancient Greek philosophy, through post-Enlightenment Western European moral philosophy, up to current quality-of-life and well-being research in the social, political and economic sciences. Nowadays, happiness as a concept seems to be readily embraced by a majority of people and appears to be more valued than the pursuit of money, moral goodness or the idea of going to heaven (Michalos, 2008; Barendregt et al., 2016; Broyd et al., 2016; Currie, 2015; Diener et al., 2015; Ferreira et al., 2015).
Quality of life (QOL) relates to the general well-being of individuals and societies, outlining the negative and positive features of life. It observes life satisfaction, including everything from physical health, education, family, employment and wealth, to religious beliefs, finance and the environment. QOL applies in a wide range of contexts, including in the fields of international development, healthcare, politics and employment. It should not be confused with the concept of standard of living, which is based primarily on income. The World Health Organisation (WHO) defines quality of life as being concerned with life-aims, expectations and standards reflecting one’s individual life circumstances. This definition is a comprehensive one and embraces individuals’ physical health, psychological state, degree of dependency, social relations and personal interests (Garg, 2017; Leon & Liew, 2017: Lv & Xie, 2017: Madsen & Holmberg, 2015; Sanjuán et al., 2016; Tovel & Carmel, 2016; Verduyn et al., 2017; Vozikaki, et al., 2017; Winkler et al., 2015; Wu & Tam, 2015).
Life satisfaction represents one’s own assessment of one’s own life. One is ‘satisfied’ when there is little or no discrepancy between the present and what is thought to be an ideal or deserved situation. By contrast, dissatisfaction is the result of a substantial discrepancy between present conditions and the ideal standard. Dissatisfaction can also be a result of comparing oneself with others.
The term ‘well-being’ is not a historical concept, but a comparatively recently-appearing social ideology emphasizing health. The key element underlying well-being is health. In the early stage of the concept’s history, the concept of health, defined as the absence of illness, was based on the biomedical model, but in recent times it is more closely linked to the social model, emphasizing social and environmental context (Jones, 1994). In 1974, WHO insisted that well-being is not restricted to health but comprehends physical, psychological, spiritual, mental and social aspects, as well as subjective and objective aspects? ‘Well-being’ is a general term for the condition of an individual or group. A high level of well-being means that the individual or group’s condition is in some sense positive. It may be characterized as follows:
1. First, well-being embraces material and psychological aspects.
2. Second, it relates more closely to the positive and balanced conditions of life of individuals and groups.
3. Third, it emphasizes the balanced and objective aspects of life.
4. Fourth, it is related not only to individuals but to place as well.
5. Fifth, it is also concerned with people’s standards of living in terms of subjective and objective aspects and also with physical and psychological aspects.
Therefore, ‘well-being’ differs in its implications from other terms, in that it is closely related to community.
Community Well-Being
As discussed above, the meanings of closely related terms such as ‘happiness’, ‘quality of life’ and ‘well-being’ are difficult to differentiate. However, from a public administration point of view, ‘well-being’ is the most important, since while happiness and life satisfaction relate to psychology and quality of life relates to economics and other related disciplines, ‘well-being’ is linked to public administration. This is because well-being is closely connected with the subjective and objective conditions of life and these conditions can be improved via public policy. Second, well-being is also closely concerned with a spatial unit such as community. As the discipline of public administration aims to improve both of these two aspects, we can say that community well-being is closely related to public administration. From this perspective, then, community well-being may be defined as that state in which a community containing local residents meets the subjective and objective conditions of life and also is positive in terms of the two conditions of life1.
The concept of community requires further definition. What does ‘community’ mean? McMillan & Chavis (1986) suggest that it contains four elements: membership, influence, integration and fulfilment of needs and shared emotional connection. Among other things, we can say that a community is a small or large social unit (a group of people) who have something in common, such as norms, religion, values or identity. Communities often share a sense of place, being situated in a given geographical area or in a virtual space through communication platforms. Durable relations that extend beyond immediate geographical ties also define a sense of community.
To sum up, community is a spatial unit within which residents have emotional identity and unity regarding local issues and have responsibility for solving their common problems. Residents within a community are expected to be concerned with their community and their emotional identity relative to each other and are also required to be willing to bear financial burdens on matters facing them. In other words, a community is a spatial unit in which residents have collective responsibility or collective consciousness around resolving common issues. The spatial range of communities differs from country to country, from, for example, village or town through to international organization (e.g. the European Economic Community). Since well-being, in this paper, cannot properly be addressed at the international level but rather at a village or town level, the spatial range of community here is located at local authority level.
Literature Review
Previous works on community well-being based on the definition of the term ‘community’ given above have been few, although there have been many more works addressing concepts related to well-being such as happiness, quality of life and life satisfaction. The characteristics of previous research works on happiness or quality of life may be summarized as follows. First, research on happiness and quality of life at an individual level has often proceeded from a psychological and economic point of view. Second, research methods such as regression and the structural equation method have been primarily used to discover the relationships between independent and dependent variables in analysing factors affecting happiness and quality of life, with the consequence that causal and structural relationships among variables associated with community well-being have not been systematically analysed. In particular, in order for community well-being to be improved and fully understood, the causal relationships among the variables affecting it both directly and indirectly should be analysed. However, such studies have been rare. This study aims to bridge the gap between the two situations. In order to identify the variables affecting community well-being, we can refer to the variables affecting happiness and quality of life, etc. According to numerous studies. Campbell, 1971; Easterlin, 1974; Cheng, 1988; Ryff, 1989; Averill & More, 1993; Max-Neef, 1995; Schalock, 2004; Seligman et al., 2005; Kahneman & Deaton, 2010; Morrison, 2011;Atkinson et al., 2012; Kee et al., 2014; Lee et al., 2014; OECD, 2014)addressing these similar factors, the factors associated with happiness, quality of life and life satisfaction are diverse, ranging from individual income, education, employment, etc. to health, security, transportation, environment, self-realization, friend-relationships and socialization. Considering these factors, this paper also reflects the community aspects of social capital, civil consciousness and other community-related factors.
Research Design
Research Methodology
This research employs a systems thinking approach to discover the causal relationships among variables affecting community well-being. The systems thinking approach assumes that a system changes over time, because it consists of diverse sub-systems, which are they made up of sub-sub-systems in which diverse elements interact in complex ways. It assumes that sub-systems sometimes cause new problems and sometimes solve them, interacting in dynamic ways (Coyle, 1999). In this regard, the systems thinking approach assumes that once we identify the causal relationships among the variables operating within a system, we can identify policy leverages underlying the system and thus solve problems facing the system. This research employs this method.
Variables
Table 1 shows the names of the variables included in the analysis and the ways in which they can be measured.
| Table 1 Variables Affecting Community Well-Being |
|||
| Name of Variable | Explanation of Variable | Acronym of Variable | Measurement |
| Chief of local government | positivity of local government chief towards community well-being | chief | 1-10 (subjective judgement) |
| Local economy | current state of local economy | locecono | Actual data |
| Population | population of community | popul | Actual data |
| Integrity of public servants | integrity of public servants working for residents | pubserv | questionnaire survey |
| Employment rate | current employment rate | employ | Actual data |
| Degree of communication between residents and public organization | degree of good communication between community residents and public organizations | commu | 1-10 (subjective judgement) |
| Autonomy of local finance | level of autonomy of local finance | locfin | Actual data |
| Level of leisure facilities | level of leisure facilities to be accessed | leisu | 1-10 (subjective judgement) |
| Crime rate | crime rate | crime | Actual data |
| Attraction of community | attraction of community to induce population influx | attract | 1-10 (subjective judgement) |
| Social capital of community | level of social capital of community residents | social | 1-10 (subjective judgement) |
| Level of transportation | Level of transportation (e.g. state of roads) | transp | 1-10 (subjective judgement) |
| Level of cultural facilities | level of facilities for cultural events | cultur | 1-10 (subjective judgement) |
| Level of refuse disposal | level of refuse collection and disposal | refuse | 1-10 (subjective judgement) |
| Level of environment | level of environmental state | envir | 1–10 (subjective judgement) |
| Level of healthcare | level of healthcare and facilities | health | 1-10 (subjective judgement) |
| Level of social welfare | level of social welfare conditions | welfar | 1-10 (subjective judgement) |
| Vitalization of civic organization | registration rate | civil | 1-10 (subjective judgement) |
| Educational environment | level of educational facilities and environment | educat | 1-10 (subjective judgement) |
| Voluntary activities | vitalization of voluntary activities | volun | 1-10 (subjective judgement) |
| Conflict within community | level of conflicts within community | conflict | 1-10 (subjective judgement) |
| Level of community well-being | level of community well-being | comwell | questionnaire survey |
| Target of community well-being | community well-being target to be met | comwell target | 1-10 (subjective judgement) |
| Gap between current community well-being and target | gap between community well-being target and current state of community well-being | comwell gap | Actual data |
As noted above, some of the data in Table 1, such as employment rate, can be obtained as actual data and some cannot. In cases when actual data cannot easily be obtained, such as with chief of local government, qualitative data can be utilized as a proxy variable. In this case, questionnaire survey data or data obtained by focus group interview (FGI) can be used as a proxy variable. However, in this study actual or qualitative data are not used, since this study focuses primarily on identifying causal relationships among variables via a causal loop diagram.
Construction of Causal Map and Causal Loop Diagrams
Much of the art of system dynamics modeling consists of discovering and representing the feedback processes, which, along with stock and flow structure, time delays and nonlinearities, determine the dynamics of a system (Sterman, 2000). Here, ‘causal map’ means an entire causal map including all variables included in a system and ‘causal loop diagram’ means loop diagram including reinforcing loop (positive feedback loop) and balancing loop (negative feedback loop). Positive feedback loops are called reinforcing loops and are denoted by a+ or R, while negative feed loops are sometimes called balancing loops and are denoted by a- or B. In the following, we will discuss the causal loop diagram depicting causal relationships among variables affecting community well-being. A causal map outlining the entire relationships between variables is shown in Figure 1. The entire causal map of community well-being consists of many relationships among variables.
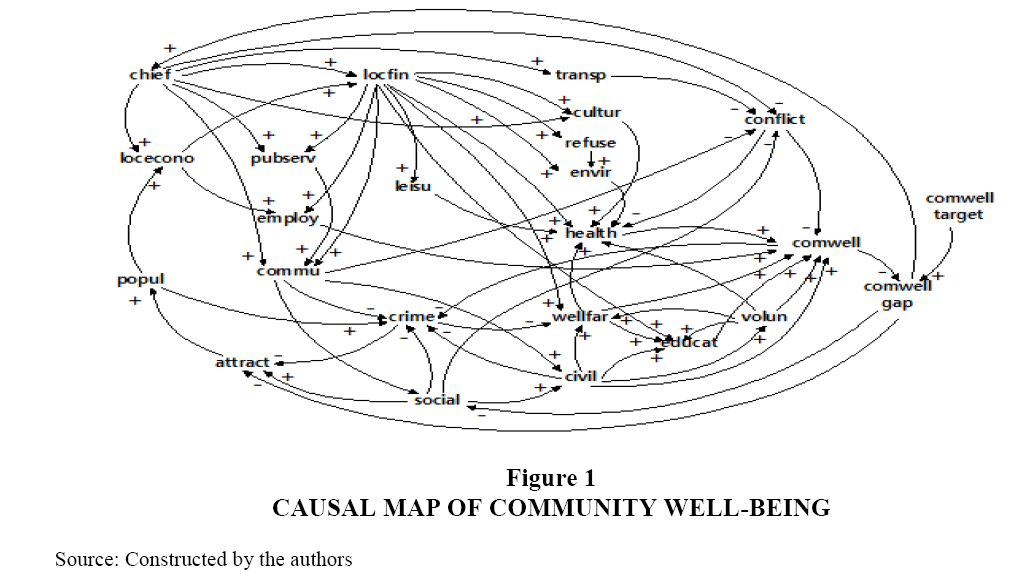
Figure 1: Causal Map of Community Well-Being
Reinforcing loops (positive feedback loops) and balancing loops (negative feedback loops) are discovered and explained by the causal map. The arrows indicate the causal relationships. The “+”signs at the arrowhead indicate that the effect is positively related to the cause: for example, an increase in the variable popul (population) causes the level of loceco (local economy) to rise above what it would have been and vice versa (a decrease in the variable popul (population) causes loceco (local economy) to fall below what it would have been). More simply, if the number of “-” signs in a loop are even, the loop is a reinforcing loop and contrariwise, if it is odd, the loop is a balancing loop.
Balancing Loop of the Head of Local Government (B1)
This loop (B1) assumption is clearly explained in Figure 2:
1. The more positive in his/her outlook the head of local government is, the more transparent the community will be;
2. The more transparent the community, the less conflictual it will be;
3. The more conflictual the community, the lower its well-being will be;
4. The higher the well-being of the community, the smaller will be the gap between the target to be met and the current state of the community’s well-being;
5. The bigger the gap between the target to be met and the community’s current state of well-being, the more positive the head of local government will be.
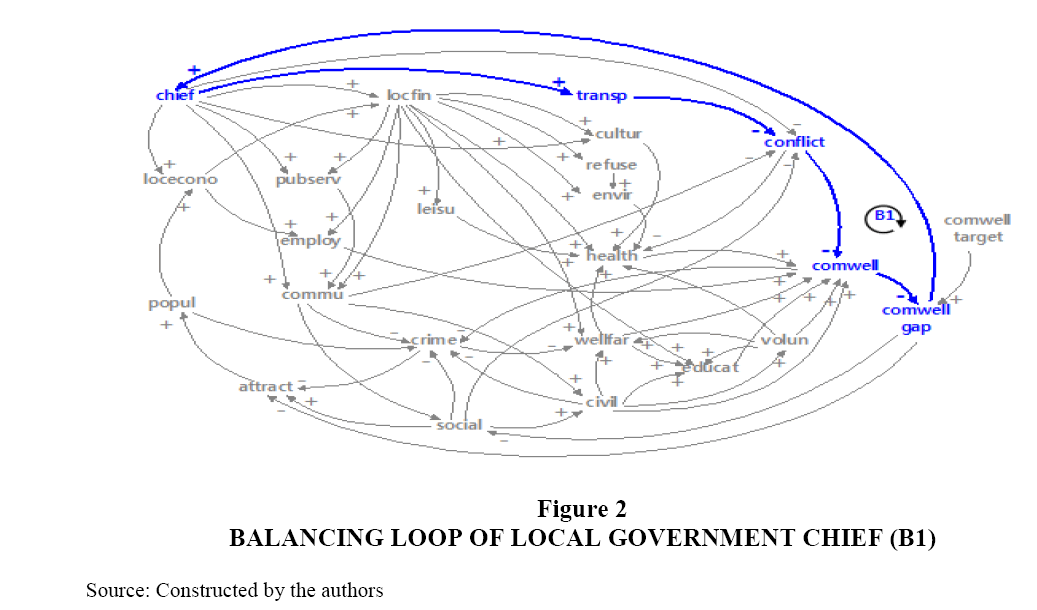
Figure 2: Balancing Loop of Local Government Chief (B1)
Balancing Loop of Community’s Attraction (B2)
This loop (B2) assumption is clearly explained in Figure 3:
1. The more attractive the community is, the larger will be its population;
2. The larger the community’s population, the more crime it will have;
3. The more crime the community has, the less attractive it will be as a community.
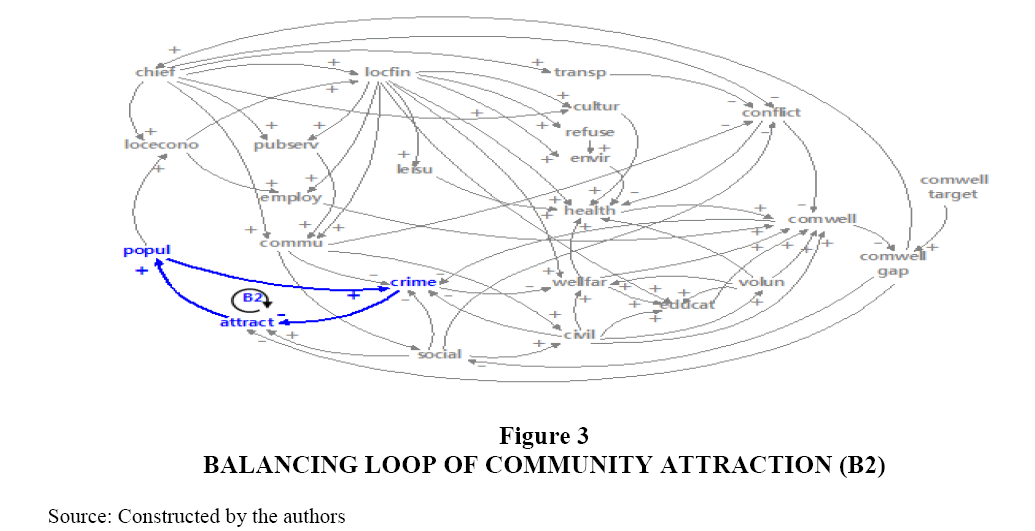
Figure 3: Balancing Loop of Community Attraction (B2)
Balancing Loop of Gap between Targets to be met in Community Well-Being and the Current State of Well-Being in a Community (B3)
This loop (B3) assumption is clearly explained in Figure 4:
1. The higher the target for community well-being is, the larger will be the gap between the target and the current state of well-being in the community;
2. The larger the gap, the less attractive the community will be;
3. The more attractive the community is, the larger will be its population;
4. The larger the community’s population, the higher its crime rate will be;
5. The higher the crime rate of the community is, the lower will be its level of social welfare;
6. The higher the community’s level of social welfare, the higher will be its levels of education, health and community well-being;
7. The higher the community’s well-being, the smaller will be the gap between the target to be met and the current state of the community’s well-being.
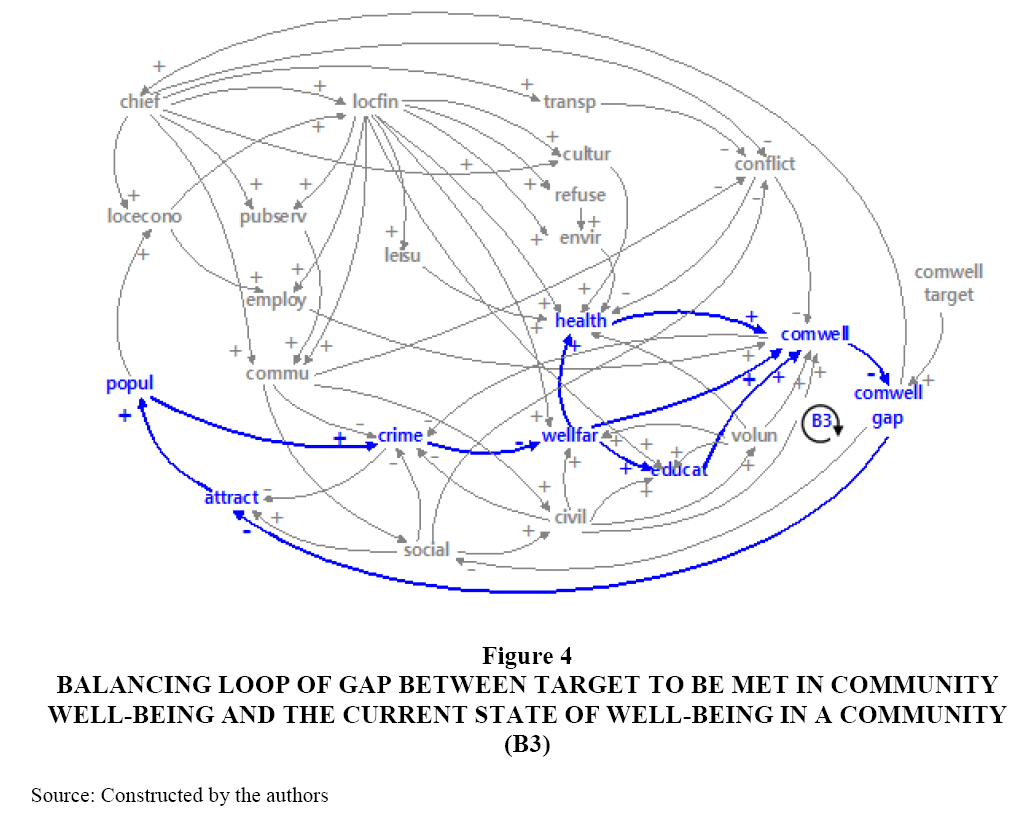
Figure 4: Balancing Loop of Gap Between Target to Be Met in Community Well-Being and the Current State of Well-Being in a Community (B3)
Balancing Loop of Public Servants’ Integrity (B4)
This loop (B4) assumption is clearly explained in Figure 5:
1. The stronger the integrity of the public servants working for the community, the stronger will be the communication between its residents and its public organizations;
2. The stronger the communication between the community’s residents and public organizations, the less conflictual the community will be;
3. The more conflictual the community, the lower the well-being of the community will be;
4. The higher the well-being in the community, the smaller will be the gap between the target to be met and the current state of well-being in the community;
5. The higher the gap, the more positive the head of local government will be regarding community well-being.
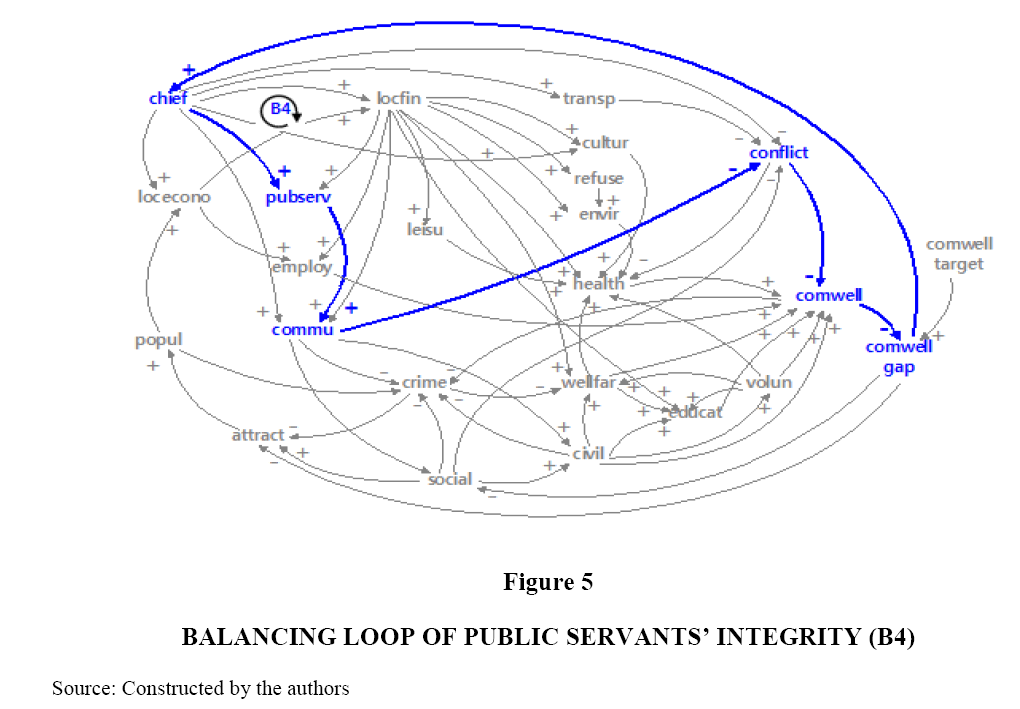
Figure 5: Balancing Loop of Public Servants’ Integrity (B4)
Balancing Loop of Local Finance and Community Well-Being Target (B5)
This loop (B5) assumption is clearly explained in Figure 6:
1. The stronger the community’s local finance, the higher the level of culture in the community will be;
2. The higher the level of culture, the higher the level of healthcare in the community will be;
3. The higher the level of healthcare, the higher will be the level of well-being in the community;
4. The higher the level of well-being in the community, the smaller will be the gap between the target to be met and the current state of well-being in the community;
5. The higher the gap, the more positive the head of local government will be;
6. The more positive the head of local government, the stronger will be the local finance;
7. The stronger the local finance, the higher will be the level of culture in the community.
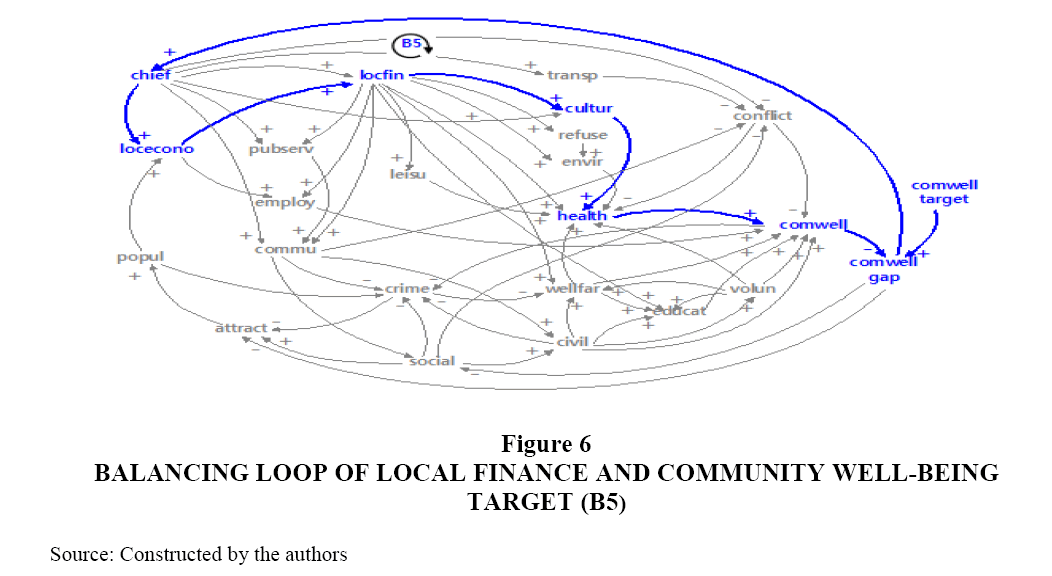
Figure 6: Balancing Loop of Local Finance and Community Well-Being Target (B5)
Reinforcing Loop of Local Economy (R1)
This loop (R1) assumption is clearly explained in Figure 7:
1. The stronger the local economy, the better will be the community’s local finance and employment rate, which leads to a high level of community well-being;
2. The higher the level of community well-being, the smaller will be the gap between the target and the current state of community well-being;
3. The larger the gap, the less attractive the community will be;
4. The more attractive the community, the larger will be its population.
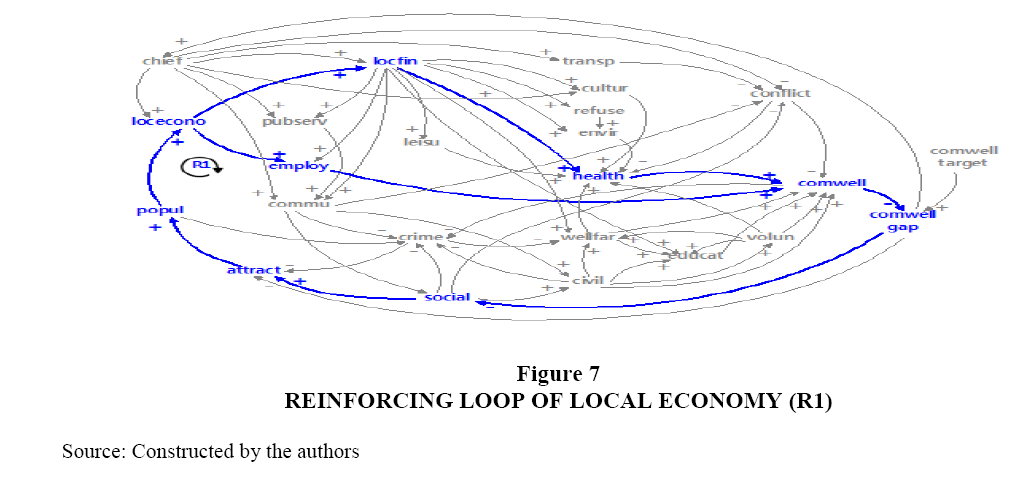
Figure 7: Reinforcing Loop of Local Economy (R1)
Reinforcing Loop of Local Social Capital (R2)
This loop (R2) assumption is clearly explained in Figure 8:
1. The higher the level of the community’s social capital, the less conflictual the community will be;
2. The more conflictual the community, the lower its well-being will be;
3. The higher the community’s well-being, the lower the gap will be;
4. The larger the gap, the lower will be the level of the community’s social capital.
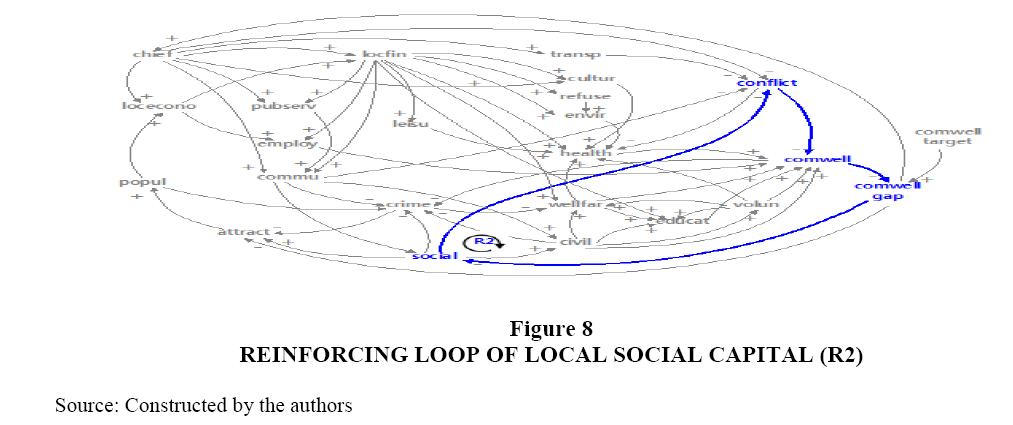
Figure 8: Reinforcing Loop of Local Social Capital (R2)
Reinforcing Loop of Local Employment (R3)
This loop (R3) assumption is clearly explained in Figure 9:
1. The higher the employment rate of the community, the higher its well-being will be;
2. The higher the community’s well-being, the smaller will be the gap between the target to be met and the current state of the community’s well-being;
3. The larger the gap, the less attractive the community will be;
4. The more attractive the community, the larger the population it will have;
5. The larger the population of the community, the stronger will be its local economy;
6. The stronger the community’s local economy, the higher its employment rate will be.
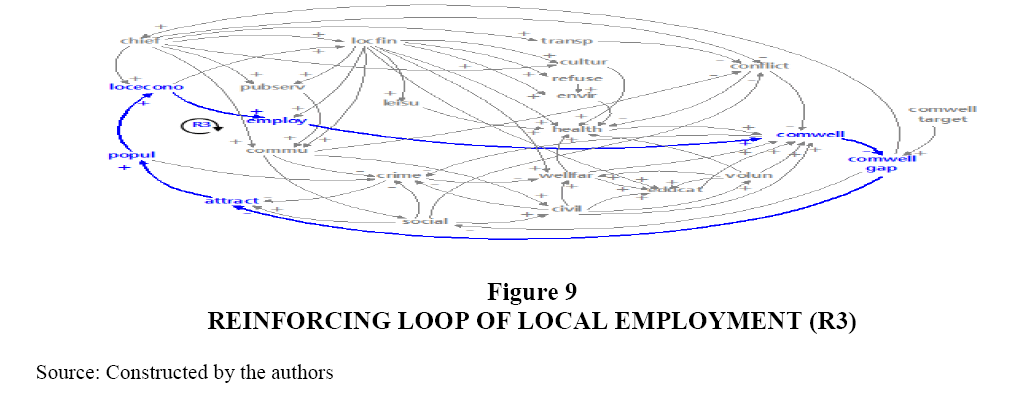
Figure 9: Reinforcing Loop of Local Employment (R3)
Reinforcing Loop of Civil Society (R4)
This loop assumption is clearly explained in Figure 10:
1. The stronger the civil society, the stronger will be the voluntary activities in the community;
2. The stronger the voluntary activities, the higher will be the community’s well-being;
3. The higher the community’s well-being, the smaller the gap will be;
4. The larger the gap, the lower the social capital of the community will be;
5. The higher the social capital of the community, the stronger its civil society will be.
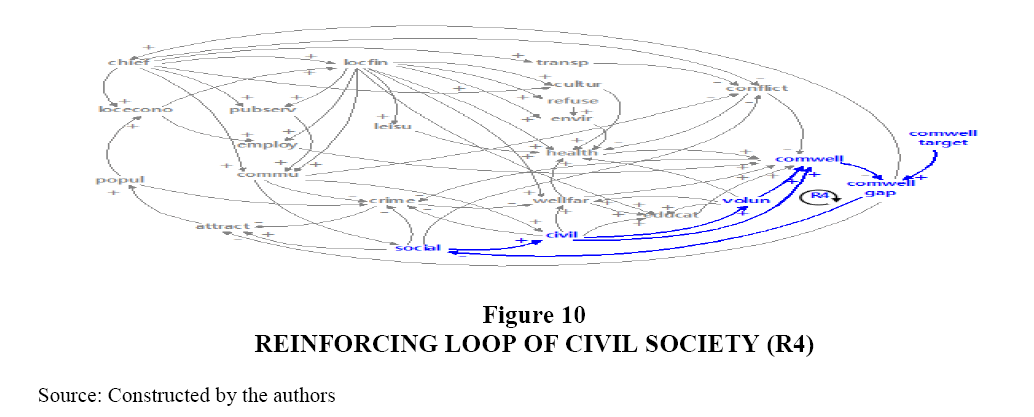
Figure 10: Reinforcing Loop of Civil Society (R4)
Reinforcing Loop of Local Social Welfare (R5)
This loop (R5) assumption is clearly explained in Figure 11:
1. The stronger the social welfare of the community, the higher its well-being will be;
2. The higher the well-being of the community, the smaller the gap between the target to be met and the current state of the community’s well-being;
3. The larger the gap, the lower the social capital of the community will be;
4. The higher the community’s social capital, the lower its crime rate will be;
5. The higher the community’s crime rate, the lower its levels of social welfare will be.
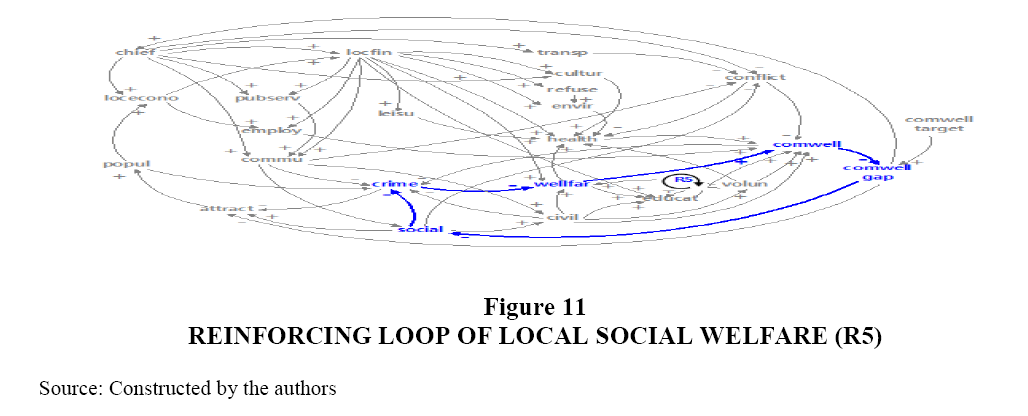
Figure 11: Reinforcing Loop of Local Social Welfare (R5)
Conclusion
This paper has attempted to define the concept ‘community well-being’ in a clear way, differentiating it from the similar concepts such as happiness, life satisfaction and quality of life and then to construct a causal map containing entire variables affecting community well-being and thus to produce many causal loop diagrams (reinforcing loops and balancing loops) allowing us to discover the relationships among the variables. The reinforcing loops (positive feedback loops) and the balancing loops (negative feedback loops) provide us with information about: what sub-systems are constituted in a whole system; what routes are ahead of the dependent variable; what points are important in achieving the dependent variable (community well-being); what factors can be used as policy levers to arrive at the dependent variable; and how to use resources economically and efficiently to achieve the aims of the system.
The systems thinking approach employed in this analysis, which has not been utilized up until now in relation to community well-being, shows that there are five balancing loops (negative feedback loops) and five reinforcing loops (positive feedback loops) within the causal model explaining community well-being. In addition, it provides information as to which variables can be controlled in the system of community well-being and where and how policymakers can intervene to elevate community well-being. Finally, it is hoped that more research works employing the systems thinking approach might be produced now and in the future.
Endnote
1. "Happiness" is not directly and conceptually affiliated with 'well-being', 'quality of life', 'life satisfaction', especially in developing countries. It is indicatively noted that in poor African countries the low quality of life generates a perceived "well-being" and "life satisfaction" among the local citizens of all ages within the African communities. In other words, "community well-being" cannot be perceived as a collective attribute, but it is more an individual characteristic of human personality.
Acknowledgement
This work was supported by the National Research Foundation of Korea Grant funded by the Korean Government (NRF-2016S1A3A2924563).
References
- Atkinson, S., Fuller, S. & Painter, J. (2012).Well-being and place. In S. Atkinson, S. Fuller & J. Painter, (Eds), Well-being and Place. Aldershot: Ashgate.
- Averill, J.R. & More, T.A. (1993). Happiness. In L.M. Lewis & J.M. Haviland (Eds), Handbook of Emotions. New York: Guilford Press.
- Barendregt, C.S., Van Der Laan, A.M., Bongers, I.L. & Van Nieuwenhuizen, C. (2016). Longitudinal relation between general well-being and self-esteem: Testing differences for adolescents admitted to secure residential care and after discharge. International Journal of Offender Therapy and Comparative Criminology, 60(16), 1836-1855.
- Broyd, A., Jolley, S. & Johns, L. (2016). Determinants of subjective well-being in people with psychosis referred for psychological therapy in South London. British Journal of Clinical Psychology, 55(4), 429-440.
- Campbell, A. (1971). Subjective measures of well-being. American Psychologist, 31, 117-24.
- Cheng, S.T. (1988). Subjective quality of life in the planning and evaluation of programs. Evaluation and Program Planning, 11, 123-34.
- Choi, Y.C. & Jang, J.H. (2016). Analysing the factors affecting FDI using system dynamics approach. The Korean Local Administration Review, 13(3), 257-287.
- Choi, Y.C. (2017). Strengthening the status of government-funded research institute: Application of system dynamics approach. Korean System Dynamics Review, 18(1), 23-56.
- Coyle, G. (1999). Qualitative modelling in system dynamics or what is the wise limits of quantification?Proceedings of the 1999 Conference of System Dynamics Society, New Zealand.
- Currie, J. & Rossin-Slater, M. (2015). Early-life origins of life-cycle well-being: Research and policy implications. Journal of Policy Analysis and Management, 34(1), 208-242.
- Diener, E., Oishi, S. & Lucas, R.E. (2015). National accounts of subjective well-being. American Psychologist, 70(3), 234-242.
- Easterlin, R. (1974). Does economic growth improve the human lot? Some empirical evidence. In P. David & R. Weber (Eds), Nations and Households in EconomicGrowth (pp. 98-125). New York: Academic Press.
- Ferreira, J.A., Reitzle, M., Lee, B., Freitas, R.A., Santos, E.R., Alcoforado, L. & Vondracek, F.W. (2015). Configurations of unemployment, reemployment and psychological well-being: A longitudinal study of unemployed individuals in Portugal. Journal of Vocational Behaviour, 91, 54-64.
- Garg, N. (2017). Workplace spirituality and employee well-being: An empirical exploration. Journal of Human Values, 23(2), 129-147.
- Jones, L.J. (1994). The social context of health and health work. London: Macmillan.
- Kahneman, D. & Deaton, A. (2010). High income improves evaluation of life but not emotional well-being. Proceedings of the National Academy of Sciences, 107(38), 489-93.
- Kee, Y., Kim, Y. & Philips, R. (2014). Community Well-being: Learning in Communities. Place: Springer Briefs Series.
- Lee, S.J. & Kim, Y. (2014). Searching for the meaning of community well-being. In S.J. Lee, Y. Kim & R. Philips, (Eds), Community Well-being and CommunityDevelopment: Conception and Applications. Place: Springer.
- León, J. & Liew, J. (2017). Profiles of adolescents' peer and teacher relatedness: Differences in well-being and academic achievement across latent groups. Learning and Individual Differences, 54, 41-50.
- Lv, Q. & Xie, X. (2017). Community involvement and place identity: The role of perceived values, perceived fairness and subjective well-being. Asia Pacific Journal of Tourism Research, 22(9), 951-964.
- Madsen, K. & Holmberg, U. (2015). Interviewees' psychological well-being in investigative interviews: A therapeutic jurisprudential Approach. Psychiatry, Psychology and Law, 22(1), 60-74.
- Max-Neef, M. (1995). Economic growth and quality of life: A threshold hypothesis. Ecological Economics, 15, 115-118.
- McMillan, D.W. & Chavis, D.M. (1986). Sense of community: A definition of theory. American Journal of Community Psychology, 14(1), 6-23.
- Michalos, A. (2008). Education, happiness and wellbeing. Social Indicator Research, 87, 347-66.
- Morrison, P. (2011). Local expressions of subjective well-being: The New Zealand experience. Regional Studies, 45(8), 1,039-58.
- OECD. (2014). How is life in your region? Measuring regionaland local well-being for policy making. Paris: OECD.
- Peasgood, T., Bhardwaj, A., Biggs, K., Brazier, J.E., Coghill, D., Cooper, C.L., Daley, D., De Sanjuán, P., Garciá-Zamora, C., Ruiz, M.A., Rueda, B., Arranz, H. & Castro, A. (2016). Benefit finding in cardiac patients: Relationships with emotional well-being and resources after controlling for physical functional impairment. Spanish Journal of Psychology, 19(50).
- Silva, C., Harpin, V., Hodgkins, P., Nadkarni, A., Setyawan, J. & Sonuga-Barke, E.J.S. (2016). The impact of ADHD on the health and well-being of ADHD children and their siblings. European Child and Adolescent Psychiatry, 25(11), 1217-1231
- Ryff, C.D. (1989). Happiness is everything or is it? Explorations on the meaning of psychological well-being. Journal of Personality and Social Psychology, 57, 1069-1081.
- Schalock, R.L. (2004). The concept of quality of life. What we know and do not know. Journal of Intellectual Disability Research, 48(3), 203-216.
- Seligman, M.E., Steen, T.A., Park, N. & Peterson, C. (2005). Positive psychology progress: Empirical validation of interventions. American Psychologist, 60(5), 410-421.
- Sterman, J.D. (2000). Business dynamics: Systems thinking andmodelling for a complex world. New York: McGraw Hill.
- Tovel, H. & Carmel, S. (2016). Function self-efficacy scale-FSES: Development, evaluation and contribution to well-being. Research on Aging, 38(6), 643-664.
- Verduyn, P., Ybarra, O., Résibois, M., Jonides, J. & Kross, E. (2017). Do social network sites enhance or undermine subjective well-being? A critical review. Social Issues and Policy Review, 11(1), 274-302
- Vozikaki, M., Linardakis, M., Micheli, K. & Philalithis, A. (2017). Activity participation and well-being among European adults aged 65 years and older. Social Indicators Research, 131(2), 769-795.
- Winkler, E., Busch, C., Clasen, J. & Vowinkel, J. (2015). Changes in leadership behaviours predict changes in job satisfaction and well-being in low-skilled workers: A longitudinal investigation. Journal of Leadership and Organizational Studies, 22(1), 72-87.
- Wu, H.F. & Tam, T. (2015). Economic development and socioeconomic inequality of well-being: A cross-sectional time-series analysis of urban china, 2003-2011. Social Indicators Research, 124(2), 401-425.