Research Article: 2021 Vol: 20 Issue: 1
Approaches to Evaluation of the Agriculture Competitiveness Level: Empirical Evidence in Ukraine
Nataliia Patyka, National Scientific Centre Institute of Agrarian Economics
Olga Khodakivska, National Scientific Centre Institute of Agrarian Economics
Lyudmila Pronko, Vinnitsa National Agrarian University
Tetyina Kolesnyk, Vinnitsa National Agrarian University
Oleksandr Klymchuk, Vasyl Stus Donetsk National University
Bogdan Kamenschuk, Institute of Feed Research and Agriculture of Podillia
Nurul Mohammad Zayed, Daffodil International University
Abstract
In the article methodological approaches to assessing the Ukraine’s agriculture competitiveness have been substantiated. In particular, an algorithm and evaluation toolkit have been developed, which includes the calculation of the integrated index of agricultural competitiveness based on the generalization of six partial indices: the level of economic development of the industry, the efficiency of management of the production process, profitability, financial stability and solvency, business activity in the industry, efficiency of sales management and goods promotion on the markets, participation in foreign economic activity.
Based on the developed methodology, an estimation of the competitiveness of Ukraine’s agriculture for 2013-2017 was carried out. The obtained results showed that the positive dynamics of the index integrated of agricultural competitiveness first of all was determined by indicators of profitability, production process management, financial stability and solvency. A downward factor was the low rate of Ukrainian agriculture’s participation in foreign economic activity, namely, the growth of imports and insignificant volumes of foreign investment.
The versatility of an integrated index of competitiveness allows to make a comparative assessment of the industries competitiveness level within the national economy and to determine to what extent some of them are capable of becoming the locomotive of the Ukrainian economy in international markets. This creates the possibility of developing an effective economic policy to support the most competitive industries based on a rational allocation of public funds, and to form a long-term competitive policy of the state at the sectoral level. The spread of the practice of international comparisons in the future will allow determining what factors provide competitive advantages for agriculture in international markets and which ones need to be strengthened.
Keywords
Competitiveness, Evaluation, Integrated Index Of Competitiveness, Competitive Advantages, Weaknesses, Ukraine.
JEL Classifications
B41, Q10, Q13, Q17, Q18
Introduction
Ukraine’s agriculture is being actively included in the processes of international economic integration. Its role in world commodity markets is growing. Nowadays Ukraine’s agriculture is the locomotive of the national economy and the generator of currency revenue. Therefore, the share of gross value added of agriculture in the national economy is 13.7%. For the last 5 years, it grew more than by 5 percentage points. 17.6% of the total population are employed in the branch. The agriculture share in the common structure of goods export from Ukraine in 2017 was 23.8%. Many enterprises of this branch are already sufficiently competitive players in the domestic and foreign markets. However, considering internal social and economic problems, fluctuations of the world market situation, their positions are not stable and require constant attention and retention efforts.
This, as well as the effect of the Association Agreement between Ukraine and the European Union, the implementation of the Ukraine-2020 Sustainable Development Strategy requires urgent changes in agrarian policy, first and foremost, in the context of ensuring the agriculture competitiveness, creating conditions for investing, implementing the principles of free and undistorted competition in trade relations, ensuring sustainable development of agricultural production. In turn, this requires a scientific and methodological approach to assess the level of agriculture competitiveness, to monitor its dynamics, to develop and to implement effective measures for improving it and confirms the relevance of this study.
Competitiveness is the main objective of each economic unit - goods, enterprises, industries, regions, countries, etc. Participation of countries in foreign economic activity has further increased the need to ensure and increase its level.
Competitiveness as an economic category was the subject of research by many scholars. Attempts to determine its economic substance were carried out both by foreign and domestic scientists. These studies have been going on for a decade, but constant changes in the socio-economic structure of society support its relevance. Almost every research on the topic of competitiveness adopts a different definition of the concept, and it was noted by the Reich, who said about the term: “Rarely has a term in a public discourse gone so directly from obscurity to meaninglessness without intermediate period of coherence” (Reich, 1992).
The existence of different approaches to the interpretation of the concept of “competitiveness” indicates its poly-structural character as a socio-economic phenomenon. However, these approaches do not deny, but complement each other in the context of understanding the essence of the category. Thus, within this article, under the agriculture competitiveness, the authors understands the stable ability of industry to market competitive goods, to expand the export market share, to achieve a better strategic position in the market than competitors; and is determined by the competitiveness of its enterprises, on the one hand, and the competitiveness of products – on the other.
Setting up the work to assess the competitiveness of agriculture requires, first of all, the substantiation of methodological approaches and the development of tools for conducting such an assessment. According to this issue, it is advisable to take advantage of the experience of countries with a developed market economy, including those of the EU, where the question of competitiveness assessment has sufficient organizational and methodological support. This is substantiated, on the one hand, by the European integration declared by our state, and on the other - the achieved results and the accumulated experience of western developed countries.
However, it should be kept in mind that the countries are very different in terms and conditions of their development, and hence methodological approaches to assessing the competitiveness of domestic agriculture should contain national conditions and peculiarities of the functioning of the industry.
A successful solution of this strategic problem will positively affect the general state of domestic agriculture and its further success on the world market.
Thus, the purpose of the article is: to substantiate methodological approaches to evaluation of the Ukraine’s agriculture competitiveness, to calculate an integrated index of its competitiveness, to identify competitive advantages and weaknesses.
Literature Review
One of the most cited works on agriculture competitiveness is the work of Lutruff (2010) “Competitiveness, Productivity and Efficiency in Agricultural and Agri-Food Sectors” (Latruffe, 2010), carried out under the auspices and published by the Organization for Economic Cooperation and Development (OECD). In his work, Lutruff notes that measuring of competitiveness is expediently based on the concepts of two scientific disciplines: the neoclassical economics focused on trade success, and suggests using real exchange rates, comparative advantage indices and export or import indices in the assessment of agriculture competitiveness; and Strategic Management School, which proceeds from the firm’s position and strategy. In this case, competitiveness is defined as cost leadership and non-price supremacy, and the level of competitiveness is proposed to be measured basing on different indicators of cost, productivity and efficiency (Latruffe, 2010).
Zawali?ska (2004) in her paper “The Competitiveness of Polish Agriculture in the Context of Integration with the European Union” (Zawali?ska, 2004) offers an eclectic basis for assessing the agriculture competitiveness in Poland, namely, to evaluate it basing on the concept of dynamic comparative advantages and its breakdown into productivity indicators, the efficiency of the factors using and relative prices in the industry. In her opinion, this allows conducting a comprehensive analysis of not only the level of competitiveness, but also its long-term determinants.
Zawali?ska’s (2004) model for assessing the agriculture competitiveness in Poland is a combination of methods based on two macroeconomic theories: trade theory and theory of growth, as well as the microeconomic theory of the firm. From the first two it borrowed the ideas of dynamic comparative advantage and endogenous growth, and from the third – the production function (Zawali?ska, 2004).
Manevska-Tasevska & Rabinovich (2014), when assessing agriculture competitiveness in Sweden, focused their attention on the use of indices characterizing production and trade (volumes of agricultural production, export and import indicators, comparative advantages indices, etc.) and indicators characterizing the effectiveness of strategic management in enterprises and farms of the industry (profitability, productivity and efficiency) (Manevska-Tasevska & Rabinovich, 2014).
Reiljan & Kulu (2002) offer to assess the competitiveness of agriculture by indicators: industry share in GDP; relative income level compared to other industries; share of employed in agriculture (% of total employment); capital investments; productivity in agriculture in comparison with the average indicator in economy (%); volumes of foreign trade (net export). In addition, a comparison of the share of investments in the agricultural sector of Estonia with the share of agriculture in GDP and employment - thus determines the level of attractiveness of the industry for investors (Reiljan & Kulu, 2002).
Tomšík & Rosochatecka (2007) in assessing the competitiveness of agriculture, proceed from the point of the effectiveness of its functioning. In particular, indicators such as the volume of agricultural production, farm incomes, the share of certain types of products in the total volume of agricultural production, the number of agricultural enterprises, their size, producer prices, market prices, volumes of state support for agriculture, labor productivity, and production costs are taken into consideration (Tomšík & Rosochatecka, 2007).
Thorne et al. (2017) and other in assessing the agriculture competitiveness use three approaches: the traditional theory of trade, the theory of industrial organization and the theory of strategic management. All indicators used to assess the competitiveness of Irish agriculture are based on profitability as a key indicator of competitiveness (Thorne et al., 2017).
In Hungary, an analytical system has been developed, which includes 31 indicators for assessing the agriculture competitiveness. In particular, the study considered the indicators of liquidity, working capital, asset turnover, capital structure, debt repayment, productivity and profitability. In their work, the authors for the assessment of the agriculture competitiveness in Hungary laid the foundation based on the structural (micro and macroeconomic) efficiency of business entities. The most important components of competitiveness are labor productivity, wage costs, exchange rates and domestic prices. And also the prices for resources and subsidies (Korom & Sagi, 2005).
Another approach to assessing the agriculture competitiveness is offered by Sparling & Thomspon (2011). In their “Competitiveness of the Canadian Agri-Food Sector” they assess the competitiveness of Canadian agriculture using indicators that are grouped into two groups: 1) basic: cost of production, exports, exchange rate and trade balance; 2) secondary: value added production, research and development costs (Sparling & Thomspon, 2011).
Keogh et al. (2015) laid the foundation of their methodology for the postulates of the neo-classical economic theory that focuses on trade and measures competitiveness on the basis of a real effective exchange rate, purchasing power parity, comparative advantage indices and export and import indices; as well as the positions of the school of strategic management, which focuses on the structure and strategy of the firm. Strategic competitiveness management indicators include the ratio of the cost of internal resources and the ratio of social benefits and costs. The first shows whether the domestic production of a particular product is internationally competitive, when alternative domestic production costs are lower than the value added at world prices. The second reveals whether national production is competitive when the total production costs are lower than the profits earned from the production (Keogh et al., 2015).
Summarizing the above, it is useful to conclude that in economic science and practice, today there is no single approach to measuring the level of the industry competitiveness in general and agriculture in particular. Some scientists conduct their research based on the concept of a neoclassical economics focused on trade success, and suggest using comparative advantages and indicators of export or import in assessing agriculture competitiveness. Another approach was proposed by the representatives of the Strategic Management School, proceeding from the position of the structure and strategy of the firm. In this case, competitiveness is defined as cost leadership, and competitiveness is proposed to be measured based on different indicators of cost, productivity and efficiency.
Methodology of the Study
In order to achieve the defined purpose, the following research tasks were formulated:
1) To substantiate methodological approaches to evaluation of the Ukraine’s agriculture competitiveness,
2) To calculate the integrated index of its competitiveness,
3) To identify competitive advantages and weaknesses.
The dialectical method of scientific cognition was used to solve the tasks of research and achieve the set purpose, as well as general scientific and special methods. In analyzing the current condition of Ukraine’s agriculture and for assessing its development methods of statistical analysis were used: method of averages and relative values, trend analysis, index method, coefficient analysis, the comparative analysis in order to compare the results obtained in individual years. It was done to establish certain relationships, such as identity, similarity or difference between the characteristics and facts.
Abstract-logical method was used for generalizing scientific and methodological approaches to the study of the Ukraine’s agriculture competitiveness and formulation of conclusions.
Also the methodical approaches to the calculation of the integrated index of agriculture competitiveness proposed by the author were tested.
The information base of the research was the data of the State Statistics Service of Ukraine, the National Bank of Ukraine and the World Trade Organization.
The method used in the study follows the below steps:
1) Identification of the research subject and selection of the study area,
2) Analysis of the scientific literature,
3) Substantiation of the methodological approaches to assessing the Ukraine’s agriculture competitiveness,
4) Collecting statistical information and developing the database covering twenty five key indicators of economic activity performance measurement which make possible to assess agriculture competitiveness level: industry share in GDP, total produced volume, GVA by agriculture production, capital investments, labor productivity, total factor productivity (TFP), capital productivity, profitability of operating activities, ROA, ROE, RCA, sustainability of economic growth coefficient, current ratio, debt ratio, working capital, access to capital, efficiency of sales management, revenue, total assets turnover, accounts payable turnover, accounts receivable turnover, export, import, foreign direct investments, export market shares (EMS),
5) Analysis of the conditions of Ukraine’s agriculture and calculating the integrated index of its competitiveness in the years 2012–2017,
6) Identifying of competitive advantages and weaknesses of the Ukraine’s agriculture,
7) Conclusions.
Results and Discussion
Methodical Approaches to Evaluate of the Competitiveness of Ukraine’s Agriculture
In the scientific environment, there is no single point of view regarding the use of which a list of indicators is appropriate to assess the agriculture competitiveness. And whether it is necessary to calculate a certain complex aggregate indicator or it is enough to use a set of individual indicators. Latruffe (2010) notes that there is no consensus on whether are quantitative measures of competitiveness, methods to measure competitiveness, components of competitiveness, or determinants/drivers of competitiveness (Latruffe, 2010).
At the same time, all scientists are certain that it is impossible to measure competitiveness with one indicator. As a rule, a number of individual indicators, which measure agriculture competitiveness, are calculated, and they are considered in two dimensions: indicators characterizing the competitiveness of the national economy (macro levels), and indicators that characterize the competitiveness of agriculture directly (micro level).
In our opinion, it is impossible to take a competitiveness assessment of all types of agricultural production built on standard analysis methods, given that there is a shortage of resources and information. It should be based on indirect methods of determining and also it should consider the compete ability of Ukrainian agricultural manufacture on world commodity markets. As a result, we will receive an integrated index containing the potential ability for enhancing the Ukrainian agriculture competitiveness, reflecting this ability in the trade balance, providing an opportunity for comparative agricultural assessment with a number of industries at home and abroad. This approach allows refusing some costly research for carrying out standard assessments of the competitiveness of individual products.
The basis for assessing the agriculture competitiveness is the principle: the criterion of competitiveness is efficiency. According to the theory of effective competition (Shumpeter, 2011), the most competitive industries are those where there is the best-organized work in of all business units. The activities efficiency of each enterprise is affected by a significant number of factors - the resources of the enterprise. Therefore, it is about assessing the effectiveness of using these resources.
In the course of the study, we substantiated twenty five key indicators of economic activity performance measurement which make possible to assess agriculture competitiveness level and its next comparison with other areas of national economy and the economies of other countries. List and description of these indicators are given in the Table 1. Indicators have been separated into six groups and each of them displays the state of a certain sphere of activity. For each group, the individual (partial) index is calculated, which together after weighing show the integrated index of agriculture competitiveness (ICP) in a given year. Each partial index uses at least three indicators - it provides a more reliable evaluation, since the use of one indicator cannot properly reflect changes in the operating conditions of the industry. When choosing the indexes and their components, we were guided by those that most fully characterize the efficiency of the industry and which are available in official statistics.
| Table 1 List and Description of Economic Parameters for Assessing the Agriculture Competitiveness | ||
| Name of groups | Indicators | Characteristic |
| 1. The indicators that characterize the level of industry’s economic development | Industry share in GDP, % | The indicators of this group assess the competitiveness of the industry primarily due to the level and dynamics of its share in GDP, the dynamics of production volumes, the creation of gross value added and the growth of capital investment. These indicators demonstrate the economic development of the industry; the dynamism of production, the ability to increase production volumes, and, accordingly, the possibility of using such a competitive advantage as a “scale effect”, the ability to respond adequately to demand, in particular, to improve market conditions. |
| Total produced volume (goods, services), million UAH | ||
| GVA by agriculture production, million UAH | ||
| Capital investments, million UAH | ||
| 2. The indicators that characterize the effectiveness of the production process management | Labor productivity, UAH | The indicators of the second group characterize the agriculture competitiveness through the assessment of the productivity, efficiency, optimality and effectivity of the use of resources (land, labor, capital, raw materials, main production assets and other types of material and technical resources) involved in production (TFP); reflect changes in efficiency, technologies (best agricultural machines, varieties of sowing materials, etc.), rational use of fixed assets (an indicator of return on assets that characterizes the efficiency of the use of fixed assets); labor organization. |
| Total factor productivity (TFP) | ||
| Capital productivity | ||
| 3. Indicators that characterize profitability | Profitability of operating activities, % | The indicators of profitability, according to the authors, are conceptually closest to the definition of competitiveness, since they reflect the efficiency of economic activity, the cost-effectiveness of production costs; and also have a strong correlation with productivity indicators. Unprofitable enterprises cannot be competitive. This group of indicators assesses the agriculture competitiveness from the point of view of the perfection of the technology of manufacturing goods, the characteristics of the level of profitability - the ability to profit from economic activity, the level of payback of costs. |
| Return on assets, % | ||
| Return on equity, % | ||
| Return of Current Assets, % | ||
| 4. Indicators that characterize financial stability and solvency | Sustainability of economic growth coefficient | The fourth group combines indicators that reflect the ability of the entity to function and develop, support the balance of its assets and liabilities in a changing internal and external environment, which guarantees its continuing solvency and investment attractiveness, and hence competitiveness. These are indicators that characterize: the independence of the industry from external sources of financing; the ability to pay for their debts; efficiency of managerial decisions; degree of risk; possibility of stable development of the industry in the future. |
| Current ratio | ||
| Debt ratio | ||
| Working capital, million UAH | ||
| Access to capital | ||
| 5. Indicators characterizing the business activity in the industry, the effectiveness of sales management and the product promotion on the market | Efficiency of sales management, % | In order to achieve a high level of competitiveness, there should be a high sales ability in the industry. The indicators of the fifth group allow us to get an idea of the effectiveness of the sales management and the product promotion on the market (the revenue growth gives a quantitative description of the increase in sales of the current period in terms of gross sales of the previous period; the total assets turnover ratio shows how many invested assets are needed to secure this level of sales, the accounts payable turnover characterizes the efficiency of accounts payable, the accounts receivable turnover ratio shows the relation of producer to the consumer). |
| Revenue Growth, % | ||
| Total Assets Turnover | ||
| Accounts Payable Turnover | ||
| Accounts Receivable Turnover | ||
| 6. Indicators that characterize participation in foreign economic activities | Exports, million US dollars | The indicators of the sixth group characterize the inclusion of the industry in the system of international division of labor, the degree of integration into the world economic space. Formation of the industry competitiveness needs to be considered not only from the point of view of the internal economic structure, but also from the point of view of the international markets of goods and capital. |
| Imports, million US dollars | ||
| Foreign direct investments, million dollars USA | ||
| The export market shares (EMS),% | ||
Due to each of the indicators has different importance level for counting of the integrated index of agriculture competitiveness (ICP) we used expert assessments method to indicate the weight of criteria. To this end, managers and specialists of business entities (agricultural producers, intermediary organizations working in agriculture, banks and other financial institutions) were involved; individuals - entrepreneurs who carry out activities in the field of agriculture; farmers; officials of state administration authorities and local government units (departments, departments, territorial units of ministries and departments); scientists. As a result, a formula was obtained ICP:
 (1)
(1)
Where, ICP – the integrated index of agriculture competitiveness;
?D – index of industry economic development;
?PM – index of effectiveness of production process management;
P – Agriculture profitability index;
FS – index of the industry’s financial stability and solvency;
?BA – index of business activity in the industry, the effectiveness of the sales management and the products promotion on the market;
?FEA – foreign economic activities participation index
Partial indices are calculated according to formulas 2-7. In assessing the competitiveness of agriculture, considering the dynamic nature of this indicator, we consider it appropriate to use not absolute values of indicators, but relative - the growth rate to take into account the change of specific indicator in time.
 (2)
(2)
Where, ?D – index of industry economic development;
IAS – the growth rate of agricultural production share in the GDP;
IAP – the growth rate of agricultural production;
IVA – the growth rate of agricultural GVA;
ICI – the growth rate of agricultural capital investments
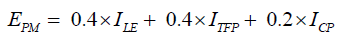 (3)
(3)
Where, ?PM – index of effectiveness of production process management;
ILE – the growth rate of agricultural labor efficiency;
ITFP – the growth rate of agricultural total factors productivity;
ICP – the growth rate of capital productivity
 (4)
(4)
Where, P – agriculture profitability index;
IP – the growth rate of of operating activities profitability;
IROA – the growth rate of return on assets;
IROE – the growth rate of return on equity;
IRCA – the growth rate of return of current assets
 (5)
(5)
Where, FS – index of the industry’s financial stability and solvency;
?SE – the growth rate of sustainability of economic growth coefficient;
ICR – the growth rate of current ratio;
ID – the growth rate of debt ratio;
IWC – the growth rate of the working capital;
IAC – the growth rate of access to capital
 (6)
(6)
Where, ?BA – index of business activity in the industry, the effectiveness of the sales management and the products promotion on the market;
ISME – the growth rate of sales management efficiency;
IRG – the growth rate of revenue growth;
ITAT – the growth rate of total assets turnover;
IAPT – the growth rate of accounts payable turnover;
IART – the growth rate of accounts receivable turnover
 (7)
(7)
Where, ?FEA – foreign economic activities participation index;
IEx – the growth rate of agricultural exports;
IIm – the growth rate of agricultural imports;
IFDI – the growth rate of foreign direct investments in agriculture;
IEMS – the growth rate of the export market shares.
In general, the algorithm for calculating the ICP involves three stages:
• Stage 1. Calculation of individual indicators of agriculture competitiveness and their conversion into relative quantities
• Stage 2. Calculation of agriculture competitiveness criteria by the above formulas (2-7).
• Stage 3. Calculation of the integrated index of agriculture competitiveness (ICP) by the formula 1.
This method gives us an opportunity to quickly identify the weak and strong sides of the industry, that is, its competitiveness, and, thus, develop measures to increase it. In this way, the assessment of competitiveness covers all the important characteristics of the industry economic activity and prevents duplication of individual indicators, allows to quickly and objectively get a picture of the situation on the sectoral market. This method can be used like a variant of operational control during index comparison through the different intervals of time. This kind of analysis can be branched considering such additional indexes like market development coefficient, quality, property status rating, marketing activity etc. It depends on specific competitiveness factors that have an impact on the industry.
The statistical source for assessment the competitiveness is economic, financial and foreign economic reporting, which is conducted by the State Statistics Service of Ukraine. In order to assess the competitive position of Ukraine agriculture relative to competitors from other countries, it is necessary to use other available and compatible data.
Evaluation of the Ukraine’s Agriculture Competitiveness
The evaluation of the competitiveness of Ukraine’s agriculture was carried out in accordance with the method presented in paragraph 1 based on official statistics for 2012-2017 (State Statistics Service of Ukraine, 2018; National Bank of Ukraine, World Trade Organization, 2018).
The calculation of the integrated index of Ukraine’s agriculture competitiveness (ICP), the value of partial indices and their dynamics are presented in Table 2.
| Table 2 Calculation of the Integrated Index of Ukraine’s Agriculture Competitiveness | |||||||
| Individual (partial) index | Index value | Year | |||||
| 2013 | 2014 | 2015 | 2016 | 2017 | Average value | ||
| Industry economic development index, ?D | 0.2 | 1 .069 | 0 .993 | 1 .091 | 1 .067 | 1 .055 | 1 .055 |
| Production process management effectiveness index, ?PM | 0.15 | 1 .168 | 1 .368 | 1 .289 | 1 .232 | 1 .038 | 1 .219 |
| Agriculture profitability index, P | 0.14 | 0 .499 | 1 .361 | 2 .962 | 0 .539 | 1 .032 | 1 .279 |
| Industry's financial sustainability and solvency index, FS | 0.08 | 0 .793 | 0 .756 | 2 .884 | 0 .415 | 0 .944 | 1 .158 |
| Index of industry’s business activity, sales management and products promotion, ?BA | 0.18 | 0 .826 | 1 .352 | 1 .423 | 0 .816 | 1 .160 | 1 .116 |
| Foreign economic activity participation index, ?FEA | 0.25 | 0 .875 | 0 .862 | 0 .866 | 0 .945 | 0 .982 | 0 .906 |
| Integrated index of agriculture competitiveness, ?CP | ? | 0 .890 | 1 .114 | 1 .530 | 0 .890 | 1 .041 | 1 .093 |
| Annual change ?CP, % | ? | - | 125.2 | 137.4 | 58.2 | 117 | - |
ICP dynamics (1.093- hereafter the average arithmetic for 2013-2017) first of all was determined by the agriculture profitability index (1.279). High indicators of profitability, return on equity, assets, and current assets show significant structural and organizational positive developments in the industry, especially in 2015 (Table 3). However, if during the period of 2013-2015 there was a steady tendency to increase all the indicators of profitability - an average of 3.2-4.8 times, and then in the 2016-2017 years they are marked by an average decrease of 49%. Given the preservation of the current trend, in the near future we can expect significant deterioration of the results of the industry and reduce its competitiveness.
| Table 3 Indicators of the Ukraine’s Agricultural Competitiveness | |||||||
| Indicators | Criteria | Year | |||||
| 2012 | 2013 | 2014 | 2015 | 2016 | 2017 | ||
| Industry economic development indicators | Industry share in GDP, % | 7.8 | 8.7 | 10.2 | 12.1 | 11.6 | 10.2 |
| Growth rate of agricultural production, % | 95.5 | 113.3 | 102.2 | 95.2 | 106.3 | 97.8 | |
| Growth rate of agriculture GVA, % | 95.7 | 113.3 | 102.2 | 95.4 | 106.2 | 109.1 | |
| Growth rate of capital investments, % | 108.3 | 88.9 | 75.9 | 127.1 | 118.0 | 127.3 | |
| Profitability indicators | Profitability of operating activities % | 21.7 | 11.7 | 21.4 | 43.0 | 33.6 | 23.5 |
| Return on assets, % | 10.6 | 5.1 | 6.0 | 19.5 | 8.1 | 10.1 | |
| Return on equity, % | 19.7 | 9.9 | 13.2 | 47.8 | 28.0 | 21.0 | |
| Return on current assets, % | 17.0 | 8.1 | 9.0 | 26.6 | 9.9 | 14.2 | |
| Indicators of efficiency of production process management | Growth rate of labor productivity, % | 96.6 | 126.0 | 109.1 | 98.0 | 123.3 | 98.6 |
| TFP | 1.308 | 1.216 | 1.480 | 1.488 | 1.424 | 1.153 | |
| Capital productivity | 1.619 | 1.438 | 2.441 | 3.685 | 3.124 | 2.849 | |
| Business activity in the industry, the effectiveness of the sales management and the products promotion on the market indicators | Sales management efficiency, % | 29.6 | 16.6 | 20.4 | 27.3 | 18.4 | 13.8 |
| Revenue Growth | 1.053 | 1.011 | 1.807 | 1.728 | 1.114 | 1.139 | |
| Total Assets Turnover | 0.463 | 0.400 | 0.624 | 0.695 | 0.370 | 0.539 | |
| Accounts Payable Turnover | 5.2 | 4.6 | 3.3 | 6.2 | 5.4 | 6.6 | |
| Accounts Receivable Turnover | 3.4 | 2.7 | 4.0 | 4.2 | 3.7 | 4.5 | |
| Financial stability and solvency indicators | Sustainability of economic growth coefficient, % | 13.6 | 4.6 | 4.3 | 49.0 | 21.8 | 14.6 |
| Current Ratio | 1.7 | 2.9 | 2.8 | 2.3 | 1.2 | 1.6 | |
| Debt Ratio | 0.92 | 1.0 | 1.4 | 1.5 | 3.2 | 1.07 | |
| Working capital, million UAH | 79825 | 81028 | 100683 | 172314 | 212341 | 233976 | |
| Access to capital, % | 32.5 | 32.9 | 34.3 | 20.2 | 20.0 | 19.6 | |
The second factor determining the ICP dynamics were indicators that form the production process management effectiveness index (1.219), namely by increasing the volumes of production and sales of agricultural products, which positively affected such indicators as labor productivity and total factor productivity (Table 3).
The third most significant factor influencing the level of agriculture competitiveness in Ukraine was the increase in the amount of equity capital, which positively affected the financial sustainability and solvency of agriculture and ensured the operational autonomy of economic entities (Table 3). In 2016, there was a sharp decline in the index of financial sustainability and solvency of Ukraine’s agriculture (almost 7 times), mainly due to the growth of volumes of short-term debt capital and a decrease in the amount of retained earnings. The decrease in the volume of retained earnings was mainly due to unfavorable price conditions for mineral fertilizers, material and technical products, plant protection products used in agricultural production, and the formation of the cost price of manufactured goods, as well as by hindering the growth of prices for agricultural products. There is, therefore, a risk of reducing the volumes of self-financing sources for agricultural enterprises.
The value of the debt ratio over the period 2013-2017 was higher than the unit; in addition there was a steady trend to its growth to 3.16 in 2016. This indicated a high level of financial risk. However, in 2017, the debt ratio declined to 1.07, which practically corresponds to the desired value, increases creditor credibility and will further facilitate the attraction of loans to the industry in the future.
Summarizing the below, it should be noted that the profound effects on the size of the integrated indices of Ukraine’s agriculture competitiveness provide the indices of profitability and financial stability and solvency. However, their volatility in time is excessively high. On calculations based on the data of the Table 2 it was established that, in particular, during the relatively short period of investigation, the value of the profitability index for Ukrainian agriculture varied within the range of 0.49948 - 2.96222, which resulted in a high level of the coefficient of variation VPU = 0.787. In the same period, the variability of the index of financial stability and solvency was within the range of 0.41530 - 2.88442, and the coefficient of variation of the index reached VFSU = 0.849.
It is established that the main reasons for the financial instability of Ukraine’s agriculture are due to:
1) Periodic increase in price disparity in the exchange processes between agriculture and other sectors of the economy, which becomes one of the factors of fluctuation of productivity indicators (for example, the profitability is characterized by almost four times fluctuations – 11.7% in 2013 compared to 43.0% in 2015, and five times fluctuation in the return on equity – respectively 9.9% compared to 47.8% in the same period;
2) Low level of access of producers to capital, which in 2013-2014 did not exceed 31–34%, and from 2015 to the present time has decreased to 19–20% and the level of debt has increased;
3) The unsynchronization of the processes of equity accumulation and long-term borrowed sources of financing with the processes of formation of non-current assets, which complicates the formation of current capital of commodity producers, reduces their financial stability and mobility, etc.
The level of the index of industry’s business activity, sales management and products promotion is high enough (1.116). This index had been growing up until 2016 and its maximum level was 1.423 in 2015 (Table 2). First of all, its dynamics was determined by the indicators of sales management efficiency and the coefficient of revenue growth, which testifies to the effective production and sales activity, the correctness of establishing the price of goods, the positive attitude of consumers to the industry’s products and characterizes the high efficiency of the main activities outside the connection with financial transactions and norms of fiscal regulation, that is, first and foremost, satisfaction of demand for agricultural products.
Significantly, there is also an increase in the accounts payable turnover (up to 6.60 in 2017), which implies an optimization of payments and supplies of agricultural products, and, hence, the legalization of transactions in the industry. The value of this index would be much higher, but the deterrent factor was the rate of total assets turnover, which characterizes the decline in the efficiency of the material stocks using.
In 2016, there was a sharp decrease in the index of business activity in the industry, the effectiveness of the sales management and the products promotion on the market (by 36%) compared with 2015 (Table 2). Mainly due to rising costs associated with product sales and inefficient work with debtors - the accumulation of receivables was faster than the increase in revenue from sales, turnover of accounts receivable declined throughout the analyzed period. Of course, such tendencies negatively affected the competitiveness level of Ukrainian agriculture. In 2017, the situation improved somewhat, and the index business activity in the industry, the effectiveness of the sales management and the products promotion on the market again increased by 42% compared to 2016, although it did not reach the 2015 levels.
The reasons for this situation in Ukraine’s agriculture are, on the one hand, in the prolonged operational and financial cycles of activity. However, on the other hand, they are intensifying:
1) Insufficient level of modern technological innovations application in crop production and, especially, in livestock breeding, which allow to shorten terms of agricultural products manufacturing and increase the total assets turnover;
2) Non-diversification of the agricultural producers activities, including improper development of primary processing elements, and secondary processing, which would neglect elongated agricultural cycles;
3) Neglect of the benefits that can be created by a balanced financial and credit policy of goods producers and provide optimum levels of accounts receivable and payable turnover.
The next factor determining the dynamics of the integrated index of agriculture competitiveness in Ukraine is the level of industry economic development. Ukrainian agriculture is developing quite dynamically by the main macroeconomic indicators. Thus, the industry's share in the GDP of the country is more than 10%. The last 5 years it had been grown up more than 2 percentage points, but recently it has been somewhat lowered. There is also an increase in the volume of investments in domestic agriculture, especially since 2015, which should contribute to the modernization of the industry.
On average, the growth rate of capital investments in 2013-2017 reached 107.8%, which would ensure their doubling only for 12-13 years and in the current conditions is rather slow. In addition, researchers have found that a rather insignificant share of capital investments is aimed at updating and modernizing the main production facilities, which complicates the introduction of advanced technologies, innovative technologies and other means of production. This trend negatively affects the level of the industry economic development index and ultimately reduces the level of the integrated index of agriculture competitiveness.
At the same time, the growth rate of agricultural production and gross value added was even slower and did not reach 105%. This indicates a violation of the key rule of economic development, in which the rate of growth of productive characteristics (in this case, the volumes of production and gross value added) should exceed the growth rate of factorial characteristics (in this case, capital investments). Consequently, it can be argued that significant factors preventing the competitiveness of Ukrainian agriculture are the insufficient of providing of development resources is on a background their ineffective use.
The results of measuring the integrated index of Ukraine's agriculture competitiveness are largely due to the deterrent effect of low agricultural participation in a foreign economic activity. The international competitiveness of Ukraine’s agriculture in the study was assessed through the definition of trade indices, foreign direct investment inflow and the export market shares (EMS). The arguments for using such a set of indicators to international competitiveness assessment are that significant exports and high EMS values indicate that the industry is competitive in the global market. Also the time trends indicate competitiveness dynamics.
The aggregate index for this group is only 0.906 – despite the steady growth of export volumes and correspondingly an increase in the share of the world goods market occupied by Ukrainian agricultural products. Imports increase (growth rate in 2016 even was more than export growth rates) and insignificant volumes of foreign investments into Ukrainian agriculture were a deterrent factors here (Table 4).
| Table 4 Foreign Economic Activity of Ukraine’s Agriculture | ||||||
| Indicators | Year | |||||
| 2012 | 2013 | 2014 | 2015 | 2016 | 2017 | |
| Export, million US dollars | 10183.0 | 9960.0 | 9750.6 | 8794.0 | 8868.7 | 10325.4 |
| Import, million US dollars | 4148.0 | 4561.9 | 3155.7 | 1694.0 | 1911.1 | 2099.5 |
| FDI, by the end of the year, million US dollars | 717.8 | 776.9 | 617 | 502.2 | 586.2 | 621.9 |
| The export market shares (EMS), % | 1.11 | 1.02 | 1.00 | 0.97 | 1.01 | 1.09 |
| The foreign economic activity participation index | - | 0.87 | 0.86 | 0.87 | 0.94 | 0.98 |
For the period of 2013-2017, their share in total volumes of FDI in Ukraine was only 1.72-1.33%. Moreover, in 2014-2015, the amount of foreign investment in agriculture decreased by 25%, indicating a significant outflow of foreign capital from the industry. In 2016-2017, the volumes of FDI in agriculture slightly increased to $ 621.9 million, which certainly did not meet real needs. In turn, this testifies that the level of attractiveness of Ukrainian agriculture for foreign investors is rather low due to high investment risks, insufficient return on invested capital.
Thus, the foreign economic activity participation index does not provide a significant positive impact on the overall integrated index of Ukraine’s agriculture competitiveness, since today:
1) The adequate level of recognition of Ukrainian agricultural products in the world is not ensured;
2) Ukrainian commodity producers often do not receive adequate protection in international trade processes, determine their rules, procedures, standards, conduct anti-dumping procedures;
3) Foreign investors and business partners of Ukrainian agrarians are often restrained by mistrust to authority, corruption, non-transparency of the work of institutes and institutions of the Ukrainian market, etc.
Further integration into the global economic space, more active participation in foreign economic activity can help enhance the competitiveness level of Ukraine's agriculture. Expansion of access to world markets and using the opportunities of Ukraine-European Union Association Agreement will ensure the growing of Ukrainian exports. This will create conditions for increasing production volumes, revenue increasing, employee’s wages increasing by better labor productivity and growing consumer demand in national market.
Recommendations and Conclusion
The conducted research shows that the problem of assessing the agriculture competitiveness is complex. As criteria for assessing the agriculture competitiveness it is appropriate to use indicators of measuring the efficiency of economic activity, namely, indicators that characterize the level of the industry economic development, the efficiency of production process management, profitability, financial stability and solvency, business activity in the industry, the efficiency of sales management and goods promotion on market, participation in foreign economic activity. The calculation of these indicators should be carried out according to the index principle, which enables not only the definition of the existing level of competitiveness, but also the evaluation of its dynamics.
The developed methodological approaches to assessing the agriculture competitiveness can serve as a successful tool for developing an effective economic policy to support a national goods producer. After all, the versatility of the construction the integrated index of competitiveness based on the theory of effective competition allows to make any comparison operations, and the clarify of factors that are components of the integral index, together with a description of each of the indices, allows to carry out for a fairly clear and transparent analysis of agricultural competitiveness trends. The use of the proposed method creates opportunities for comparing the level of agriculture competitiveness in Ukraine with other sectors of the economy, as well as determining the competitiveness of Ukrainian products in foreign markets.
It was established that the integrated index of Ukraine’s agriculture competitiveness grew during 2013-2015. This positive dynamics was determined primarily by indicators of profitability, production process management, financial sustainability and solvency. In 2016 there was deterioration in the value of the integrated index of competitiveness. This was primarily due to a decline in the rate of economic growth in the industry, including production volumes, gross value added; lower profitability; worsening performance of sales management. Given the preservation of the current trend, in the near future, we can expect productivity deterioration of agricultural enterprises and decrease their competitiveness.
The results of the assessment of the Ukraine’s agriculture competitiveness provide grounds for arguing that the practical use of the integrated index proposed in the research allows, firstly, to ensure the rational use of public funds for financial support to the export potential of the state through the identification of the most competitive sectors of the national economy; secondly, to optimize the state policy directions on providing the Ukraine’s agriculture competitiveness based on the studying its advantages and weaknesses and comparing with the agriculture competitiveness of other countries.
References
- Keogh, M., Tomlinson, A., & Henry, M. (2015). Assessing the competitiveness of Australian agriculture. Rural Industries Research and Development Corporation.
- Korom, E., & Sági, J. (2005). Measures of competitiveness in agriculture. Journal of Central European Agriculture, 6(3), 375-380.
- Latruffe, L. (2010). Competitiveness, productivity and efficiency in the agricultural and agri-food sectors. Unpublished doctoral dissertation, Self-referral.
- Manevska-Tasevska, G., & Rabinowicz, E. (2014). Competitiveness of Swedish agriculture: Indicators and driving forces. AgriFood Economics Centre, Lund.
- National Bank of Ukraine. (2018). Monetary statistics of Ukraine for 2008-2018. Retrieved from https://bank.gov.ua/
- Patyka, N.I. (2018). Methodical approaches to assessing the competitiveness of Ukraine‘s agriculture.
- Reich, R.B. (1992). Competitiveness is a big word in DC: Just ask the VP. Wall Street Journal.
- Reiljan, J., & Kulu, L. (2002). The development and competitiveness of Estonian agriculture prior to joining the European Union. University of Tartu Economics & Business Administration Working Paper, (10).
- Shumpeter, J.A. (2011). Economic development theory: profit, capital, credit, percent and economic cycle , translate from engl. V. Starka, Vydavnychyi dim «Kyievo-Mohylianska Akademiia», Kyiv, Ukraine.
- Sparling, D., & Thomspon, S. (2011), Competitiveness of the Canadian agri-food sector. Ottawa, Canada: Canadian Agri-Food Policy Institute.
- State Statistics Service of Ukraine. (2018). Retrieved from https://ukrstat.org/en
- Thorne, F., Gillespie, P.R., Donnellan, T., Hanrahan, K., Kinsella, A., & Läpple, D. (2017). The competitiveness of Irish agriculture. Dublin, Ireland: Teagasc.
- Tomšík, K., & Rosochatecka, E. (2007). Competitiveness of the Finnish Agriculture after ten years in the EU. Agricultural Economics (Agric. Econ.–Czech), 53, 448-454.
- World Trade Organization. (2018). Statistics on merchandise trade. Retrieved May 29, 2018 from https://www.wto.org/english/res_e/statis_e/merch_trade_stat_e.htm
- Zawali?ska, K. (2004), The Competitiveness of polish agriculture in the context of integration with the European Union . Warsaw, Poland: Warsaw University Department of Economics.