Research Article: 2021 Vol: 20 Issue: 1
Assessment of Phosagros Capital Structure Based At Two Hierarchical Methods of Integral Ranking of Important Financial and Economic Activity Indicators
Irina Y. Vygodchikova, National Research Saratov State University named after N. G. Chernyshevsky
Mark A. Gorskiy, Plekhanov Russian University of Economics
Mikhail A. Khalikov, Plekhanov Russian University of Economics
Abstract
The article presents tools for complex analysis of an enterprise’s financial condition using two hierarchical procedures of the integral ranking of important financial and economic activity indicators. A comprehensive assessment of the capital structure of companies was performed, in which the majority of attention was paid to striking a balance of financial sources for production.
Keywords
Integral Index, Hierarchical Analysis, Financial Leverage, Capital Structure.
Introduction
As a rule, the choice of methods for evaluating the capital structure of a company is reduced to the use of mathematical convolution of several quantitative indicators of financial and economic company activity into one integral index (Vygodchikova, 2020; van Vught & Westerheijden, 2010). Models for forecasting enterprise insolvency risks usually use indicators of liquidity, financial stability, profitability, business activity, and market indices (Vykhodceva & Vereschagina, 2012; Ilysheva & Kim, 2007).
Traditionally, the procedure for evaluating the capital structure of companies has been reduced to calculating important coefficients and comparing them with standards (Bauer & Agarwal, 2014). Significant development of procedures and methods of financial analysis based on quantitative indicators (coefficients of liquidity, financial stability, profitability, business activity) is presented in the works of well-known scientists, including A.D. Sheremet (Sheremet, 2004), T. Korol (Korol, 2013), R. Chesser (Chesser, 1974), etc.
Due to the development of information and telecommunication technologies, it became urgent to make decisions faster than competitors; therefore it is advisable to choose key coefficients. For that reason, an urgent task is to introduce new ways and methods for estimating coefficients, which are based on the calculation of integral indices.
This direction faces the following problems: The integral index may contain excessive indicators that lead to distortion of the result (Khalikov et al., 2010; Epifanov & Khalikov, 2019). The procedure of integral ranking does not take into account the priorities of a company and underestimates risk factors (Bauer & Agarwal, 2014; Fedorova et al., 2016 & 2018),
The procedure of integral ranking is too pessimistic about increasing the return on equity of the company (Vygodchikova, 2020). The capital structure does not take into account the risk of the loss of influence of a company’s funds due to an increase in debt. Therefore, traditional methods do not have characteristics, which are of vital importance in the modern world – universality and software support (adapted to the existing requirements of various applications and language structures), which will increase the efficiency of use and reduce the cost of implementing the model. This can be achieved by careful selection of indicators, mathematical convolution into an integral index, and an algorithmic procedure for actions (Vygodchikova, 2019).
The use of mathematical tools in analyzing the capital structure of an enterprise allows for drawing conclusions about its competitiveness and investment attractiveness, as far as timely take measures aimed at maintaining, dissolution, or reforming the business (Igonina, 2016), (Panov & Borovitskaya, 2013). Since attracting investors is an important basis for business development, it is necessary to analyse the capital structure of a company in more detail and make a conclusion about the feasibility of the planned activities in order to provide investors with proper justification for investing (Bukharin et al., 2017; Seo, 2000).
The use of normative methods for assessing the capital structure and comprehensive assessment of the financial condition of an enterprise entails a number of difficulties since there are no uniform norms of the studied indicators. Thus, liquidity indicators have significantly changed after the introduction of electronic payments. Profitability indicators are not so important if the company is conducting a large-scale upgrade of equipment, and invests all resources in development. Growing receivables may indicate non-payments to this enterprise, which is a negative factor in its solvency, and may lead to an increase in accounts payable. On the contrary, an increase in the accounts payable may indicate an inability to meet obligations to suppliers and is considered to be a clear signal of problems with liquidity. A significant excess of borrowed resources over its funds, if the profit is low, indicates possible instability (Vykhodceva, 2020; Altman, 1968).
It is not advisable to use the Chesser model (Chesser, 1974; Vykhodceva & Vereschagina, 2012) for a number of reasons. Firstly, not all indicators are taken into account (non-current assets, accounts receivable, and accounts payable are barely taken into account). Secondly, the coefficients need to be adapted for Russian enterprises (Ilysheva & Kim, 2007).
The weighting method requires a reasonable set of indicators and reliable coefficients obtained by conducting a regression analysis of data for many periods (Vygodchikova, 2019).
Any coefficients will be subject to criticism, since the sample of data (amount, period of time, reliability of reporting data) is not a deterministic value, and the level of indicators for different enterprises may not be comparable (Chesser, 1974).
In order to develop all these methods and methodological models, it is necessary to create a universal software-oriented and mathematically based rating mechanism that takes into account significant indicators of the financial and operating activity of an enterprise. Such a method was developed by the authors of this article.
The purpose of the research is to improve the methodology and tools for evaluating the capital structure of a company using the hierarchical procedure of integral ranking of important financial and economic activity indicators.
The Main Objectives of the Research
- Development of a procedure for ranking indicators of financial and economic activity,
- Development of a method for complex assessment of the capital structure based on integral indexing and hierarchical approach,
- Creation of methods for calculating the integral rating,
- Software implementation algorithm,
- Presentation of the results of a computational experiment.
Methodology
To achieve the set goal and implement the tasks, the authors of the article developed the following methods.
IF Method
In order to calculate an integral rating based on the coefficients of the financial and economic activity of the enterprise (IF), the following steps shall be performed.
Analysis of Liquidity (Liquidity Ratio)
Two coefficients are used: current ratio (the ratio of current assets to short-term liabilities) and quick ratio (the ratio of the receivables, short-term investments, and cash to short-term liabilities). The coefficients’ values are considered normal if they are higher than 100% and 80%, respectively. If both coefficients are within the norm, the enterprise (or group of enterprises) receives 100% (liquidity ratio= 100%), if one coefficient is normal and the other is not – 50% (liquidity ratio= 50%), if both indicators do not meet the norm – 0% (liquidity ratio= 0%).
Analysis of Business Activity (Activity Ratio)
Two coefficients are used: fixed asset turnover ratio (the ratio of revenue to non-current assets) and asset turnover ratio (the ratio of revenue to assets). This group considers two indicators: fixed asset turnover ratio (the ratio of revenue to non-current assets, normal value is considered 100% and higher) and asset turnover ratio (the ratio of revenue to assets, normal value is 50%). If both coefficients are within the norm, the enterprise (or group of enterprises) receives 100% (activity ratio= 100%), if one coefficient is normal and the other is not – 50% (activity ratio=50%), if both indicators do not meet the norm –0% (activity ratio=0%).
Profitability Analysis (Profitability Ratio)
Two coefficients are used: return on equity (the ratio of net profit to equity, normal value is considered 20% and higher) and return on investment (the ratio of net profit to the total volume of investment resources of the enterprise, the normal value–10% and higher). If both coefficients are within the norm, the enterprise (or group of enterprises) receives 100% (profitability ratio=100%), if one coefficient is normal and the other is not – 50% (profitability ratio=50%), if both indicators do not meet the norm –0% (profitability ratio=0%).
Risk Analysis of Innovation (Leverage Ratio)
Two coefficients are considered: the financial leverage ratio (the ratio of debt capital to equity, the normal value shall be less than 50%) and the leverage ratio (the ratio of equity to assets, the normal value is between 40% and 90%). If both coefficients are within the norm, the enterprise (or group of enterprises) receives 100% (leverage ratio=100%), if one coefficient is normal and the other is not – 50% (leverage ratio=50%), if both indicators do not meet the norm – 0% (leverage ratio=0%). The integral indicator of financial condition (IF) is calculated using the following formula (Vygodchikova, 2017):

The structure of calculating the IF indicator (an integral indicator of financial condition) is shown in Figure 1.

Figure 1: Structure of IF Calculation
On the basis of the integral indicator of financial condition, the conclusion about the rational use of invested funds is made. Maximum IF value is 100% and it implements the most well-balanced financial state of the enterprise in the sphere of innovative business, high competitiveness, and investment attractiveness. IF value between 75% and 100% indicates the successful structure of financial indicators, high potential for innovative development, average competitiveness, and high investment attractiveness. IF value between 50% and 74% indicates stable financial condition and the necessity of the careful study of individual business directions that can and should be used for investing. IF value between 25% and 50% indicates a sharp decline in business competitiveness, the need for structural changes and the introduction of new high-tech technologies at all stages of production, and business management. IF value below 25% indicates difficulties and a high risk of investment.
This method of evaluation of the investment attractiveness of innovative enterprises, given in this article and based on the calculation of the proposed IF index, allows for the performing of an objective innovative attractiveness assessment of the business and compare enterprises with different scales of activity.
Advantages of the method: the universality of the division of enterprises into groups, the equivalence of groups in determining the integral index. Drawback: for this method, it is advisable to choose the same number of indicators in each group (in this study, two indicators are selected). The following method does not have this disadvantage (integral effective rating, IR).
The IR Method
Before the explanation of the method, the new term needs to be defined.
The aggregated effective coefficient of positive (positively affecting business development) indicators A1,..., An will be called C coefficient, and can be calculated by the following formula:
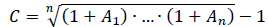
Selecting coefficients (there are eight coefficients in total; since the groups contain a different number of indexes, aggregation is performed within each group to obtain a single index in the group):
1. Analysis of liquidity (C1= liquidity ratio).
2. Analysis of business activity (C2). Four coefficients are considered:
- the turnover ratio of fixed assets (the ratio of revenue to non-current assets),
- the turnover ratio of current assets (the ratio of revenue to current assets),
- the equity turnover ratio (the ratio of revenue to equity),
- the ratio of receivables and payables (the ratio of the number of receivables to payables).
- The values of these coefficients for the object under consideration will be denoted, respectively, by C21,..., C24.
- The aggregated effective coefficient C2 for this group needs to be calculated.
3. Profitability analysis (cost ratio).
- Two coefficients are considered: return on equity (the ratio of net profit to equity) and return on investment (the ratio of net profit to the total volume of investment resources of the enterprise).
- The values of these coefficients for the object under consideration will be denoted, respectively, by C31 and C32. Aggregated effective coefficient C3.
4. Risk analysis of innovation (C4). The financial independence coefficient (the ratio of equity to assets) is considered.
The integral financial status rating (IR) is an aggregated effective coefficient from the C1 – C4 coefficients.
The structure of calculating the IR indicator (integral rating of financial condition) is shown in Figure 2.

Figure 2: Structure of IR Calculation
On the basis of the integral rating of the IR of financial condition, a conclusion about the rational use of invested funds is made (the higher IR value, the better).
The IR method, in contrast to the IF method, has no upper limit. The calculations (Table 1) are very labor-intensive (in the absence of computer equipment or a tablet spread sheet), but that is the only disadvantage to the method (it is easy to achieve positive indicators, for example, the reverse of a negative indicator will be positive) (Table 2).
| Table 1 IF Method |
||
| PAO Fosagro, thousand RUB | 2017 (December 31) | 2016 (December 31) |
|---|---|---|
| I Non-current assets | 76,245,057 | 59,526,139 |
| II Current assets | 15,199,263 | 11,857,101 |
| Accounts receivable | 1,829,943 | 194,924 |
| Short-term financial investments | 13,232,951 | 11,037,334 |
| Cash | 13,094 | 587,616 |
| III Equity | 32,425,875 | 38,453,644 |
| IV Long-term liabilities | 28,800,100 | 30,328,450 |
| V Short-term liabilities | 30,218,345 | 2,601,146 |
| ASSETS | 91,444,320 | 71,383,240 |
| LIABILITIES | 91,444,320 | 71,383,240 |
| Revenue | 3,944,204 | 32,086,585 |
| Net profit (loss) | 8,735,230 | 34,284,599 |
| Liquidity ratio (both 100%, one 50%) | 0% | 100% |
| ** Current assets/short term liabilities (>100%) | 50% | 456% |
| ** Quick assets/short-term liabilities (>80%) | 50% | 454% |
| Activity ratio (both 100%, one 50%): | 0% | 50% |
| ** Fixed asset turnover ratio (more than 100%) | 5% | 54% |
| ** Asset turnover ratio (more than 40%) | 4% | 45% |
| Profitability ratio (both 100%, one 50%): | 100% | 100% |
| ** Net profit/assets (more than 5%) | 10% | 48% |
| ** Net profit/equity (more than 10%) | 27% | 89% |
| Profitability ratio (debt/equity, less than 100%) | 50% | 100% |
| ** (assets-equity)/equity (less than 100%) | 182% | 85% |
| ** Equity/assets (20-90%) | 35% | 54% |
| IF | 0.38 | 0.88 |
| Table 2 IR Method |
||
| PAO Fosagro, thousand RUB | 2017 (December 31) | 2016 (December 31) |
|---|---|---|
| I Non-current assets | 76,245,057 | 59,526,139 |
| II Current assets | 15,199,263 | 11,857,101 |
| Accounts receivable | 1,829,943 | 194,924 |
| III Equity | 32,425,875 | 38,453,644 |
| IV Long-term liabilities | 28,800,100 | 30,328,450 |
| V Short-term liabilities | 30,218,345 | 2,601,146 |
| Accounts payable | 102,173 | 135,811 |
| ASSETS | 91,444,320 | 71,383,240 |
| LIABILITIES | 91,444,320 | 71,383,240 |
| Revenue | 3,944,204 | 32,086,585 |
| Net profit (loss) | 8,735,230 | 34,284,599 |
| C1 (basic) | 0.50 | 4.56 |
| ** Current assets/short term liabilities | 0.50 | 4.56 |
| C2 (basic) | 1.30 | 1.25 |
| **ratio of revenue to non-current assets | 0.05 | 0.54 |
| **ratio of revenue to current assets | 0.26 | 2.71 |
| **ratio of revenue to equity | 0.12 | 0.83 |
| **ratio of accounts receivable to accounts payable | 17.91 | 1.44 |
| C3 (basic) | 0.18 | 0.67 |
| **net profit to assets | 0.10 | 0.48 |
| **net profit to equity | 0.27 | 0.89 |
| C4 (basic) | 0.35 | 0.54 |
| **equity to assets | 0.35 | 0.54 |
| IR | 0.53 | 1.38 |
Calculation (2, 3)
The indicators deteriorated sharply from 2016 to 2017. Both methods show fundamental structural changes that were negative for the development of the company in relation to competitiveness and profitability. The company pays its debts, but cannot afford re-equipment and the profit adequate to the level of its financial stability. The same conclusion was made after WACC monitoring (Epifanov & Khalikov, 2019).
Results and Discussion
The activity of PAO FOSAGRO (2020) for two reporting periods was surveyed. Calculations were performed using both methods. The study indicates an acute lack of investment, while lack of resources slows down the development of activities and profit growth. At the same time, investments should be targeted and support the introduction of high-tech production and exports. They cannot be directed only to cover debts to suppliers that have accumulated in previous periods. Debt related questions should be solved by the company itself, through internal quality monitoring and the introduction of a control system at each stage of production. These measures should control the coordination between the accounts receivable and accounts payable, and not reduce the equity of the company.Investments should be targeted and support the introduction of high-tech production and exports, rather than be used to solve problems. Problems should be solved by the company through internal quality monitoring and the introduction of a control system at each stage of production, which facilitates the accumulation of considerable equity. General conclusion: 2016, being the peak of Russian business development, showed an acute shortage of high technologies of Russian production (Vygodchikova, 2017; Khalikov et al., 2010; Bhimani & Bromwich, 2010). The involvement of its own sources of financing led to the liquidation of debt to creditors but worsened the financial condition of the company. It is direct lending (investment in high-tech projects) and strict control over implementation that will allow Russian technologies not only to win the competition for high-tech projects but also to enter the export world of high-tech products instead of raw materials.
Conclusion
The method of complex analysis of the financial condition of PAO FOSAGRO based on two procedures of integral indexing was developed and tested. The main finding is a sharp structural change in indicators from 2016 to 2017, the main recommendation for the investor is to provide targeted investments and strict control at all stages of high-tech implementation, as far as it relates to supervision of compliance with high-tech exports.
References
- Altman, E.I. (1968). Financial ratios, discriminant analysis and the prediction of corporate bankruptcy. The Journal of Finance, 23(4), 589-609.
- Bauer, J., & Agarwal, V. (2014). Are hazard models superior to traditional bankruptcy prediction approaches? A comprehensive test. Journal of Banking & Finance, 40, 432-442.
- Bhimani, A., & Bromwich, M. (2009). Management accounting: Retrospect and prospect. Elsevier.
- Bukharin, S.V.E., Melnikov, A.V., & Menshih, V.V. (2017). Method for expanding the object base of examination by stitching solutions of hierarchy analysis method. Journal of the South Ural State University.Series: Mathematical Modeling and Programming, 10(2), 74-82.
- Chesser, D.L. (1974). Predicting loan noncompliance. The Journal of Commercial Bank Lending, 56(12), 28-38.
- Epifanov, I.I., & Khalikov, M.A. (2019). Russian practice of estimating the weighted average cost of capital of companies in the real economy. Bulletin of Altai State University, 10(2), 55-61.
- Fedorova, E.A., Dovzhenko, S.E., & Fedorov, F.Y. (2016). Models for predicting bankruptcy of Russian enterprises: industry features.
- Fedorova, E.A., Khrustova, L.E., & Chekrizov, D. (2018). Industry-specific features of applying models for predicting an enterprise bankruptcy. Strategic Decisions and Risk Management, 1(104), 64-71.
- Igonina, L.L. (2016). Financial potential of the investment process in the Russian economy. Digest-Finance, 2 (238), 2-14.
- Ilysheva, N.N., & Kim, N.V. (2007). Mathematical model for determining the standards of financial indicators. Finance and Credit, 31 (271), 80-87.
- Khalikov, M.A., Khechumova, E.A., & Shardin, A.A. (2010). The methodology for accounting and assessment of risks associated with productive and financial aspects of corporate operations. Scientific Notes of Russian Academy of Entrepreneurship, (23), 165-180.
- Korol, T. (2013). Early warning models against bankruptcy risk for Central European and Latin American enterprises. Economic Modelling, 31, 22-30.
- Panov, S.F., & Borovitskaya, M.V. (2013). The role of sources of capital investment financing in the financial state of an enterprise.
- PAO FosAgro. (2020). Retrieved from https://www.rusprofile.ru/id/2047150
- Seo, K.K. (2000). Managerial economics. Translation from English.
- Sheremet, A.D. (2004). Methods of financial analysis.
- van Vught, F., & Westerheijden, D.F. (2010). Multidimensional ranking: a new transparency tool for higher education and research. Higher Education Management and Policy, 22(3), 1-26.
- Vygodchikova, I.Y. (2017). A financial analysis of innovative enterprises of the Volga Federal District. Financial Analytics: Science and Experience, 10(341), 1245-1256.
- Vygodchikova, I.Y. (2019). Toolkit of decisions making about investment of large Russian companies using hierarchical procedure of ranking and minimax approach. Journal of Applied Informatics, 14(84), 123-137.
- Vygodchikova, I.Y. (2020). Compiling investment attractiveness rating of the largest Russian companies using minimax approach. Statistics and Economics, 17(2), 82-93.
- Vykhodceva. I.Y., & Vereschagina L.S. (2012). The Analysis of financial operations with adapted coefficients R. Chesser. Bulletin of the Saratov State Socio-Economic University, 5 (44), 180-184.