Research Article: 2018 Vol: 17 Issue: 4
Brand Loyalty and Determinates of Perceived Quality and Willingness to Order
Mohammad Falahat, Universiti Tunku Abdul Rahman
Chong Shyue Chuan, Universiti Tunku Abdul Rahman
Sia Bik Kai, Universiti Tunku Abdul Rahman
Keywords
Brand Association, Brand Loyalty, Hardware Tools, Perceived Quality, Retailers.
Introduction
Due to intense competition within the global market place, companies have shifted their marketing strategies towards branding (Krystallis and Chrysochou, 2014). Marketing strategies for brands have been diverted towards relationships and value creation that is directly linked to brand loyalty (Maheshwari et al., 2014). For decades, brand loyalty has been gaining recognition as an important component of marketing literature (Howard and Sheth, 1969). By focusing on brands as an effective marketing tool in business strategies, manufacturers have successfully persuaded end consumers to purchase their products. Distributors, on the other hand, conduct business-to-business (B2B) commercial transactions focusing on distribution control and building and developing relationships with customers (Steenkamp and Kumar, 2007). By utilizing appropriate merchandising strategies, present-day retailers hold significant positions in the marketplace through managing customer relationships and loyalty. Therefore, it is crucial for manufacturers to understand and fulfil retailers’ needs in building brand loyalty. Brand loyalty is essential in the hardware tools industry for retailers and manufacturers alike as product turnover rates are high. With technical developments and strong consumer preferences for the latest products, many hardware items are quickly outdated and replaced with newer versions. Hardware tool manufacturers need to constantly innovate their products to remain at the forefront of this increasingly competitive industry. When consumers perceive a brand to be of high quality, they are more willing to purchase the latest version of a particular product if the company has high brand equity (Kim and Hyun, 2011), which leads to retailer loyalty. Brand loyalty has played an important role in creating long-term advantages for companies because loyal customers do not need any promotional efforts to make them purchase products. Indeed, they are willing to pay a premium to secure the benefits and quality sought from their favourite brand (Gilaninia and Mousavian, 2010). In particular, the aim of this study is to develop an understanding of the driving forces behind customers’ willingness to order and the contributing factors that affect perceived quality toward brand loyalty among Malaysian hardware retailers.
Background of Study
Many theoretical models have been proposed to explain how purchasers evaluate and behave toward brands (Aaker, 1991; Kapferer, 2008; Keller, 1993). There are various types of purchase behaviours (Falahat et al., 2017; Sheth, 1981). In our extended model, we expand on this to consider significant factors that influence the quality perceived by hardware retailers and their willingness to order. Further, we analyse product prices, advertising, distributor image and brand associations in relation to brand loyalty and willingness to order. The next section presents a critical review of relevant literature on these issues and their interrelationships.
Price
Prices reflect the value that consumers exchange for the benefits of having or using products and services and they also embody what needs to be given up or sacrificed to obtain a product. Price is consistently stated as a major determinant of purchasing decisions (Yoo et al., 2000; Chattopadhyay et al., 2010; Gedenk and Neslin, 1999). Indeed, this is lower-bounded by the axiom that people cannot buy what they cannot afford. Various studies have also revealed a significant positive relationship between price and perceived quality (Chattopadhyay et al., 2010; Keller, 2013; Yoo et al., 2000).
Advertising
Poddar et al. (2013) discuss the adoption of trade promotion by retailers. Kotler et al. (2013) defines promotion as activities that communicate the merits of a product and persuade target customers to buy it. Trade promotion has an impact on retailers’ behaviours (Neslin et al., 1995). Gedenk and Neslin (1999) found that retail price promotions have strong, positive and immediate effects on the purchase of branded products. Brand loyalty is reflected in repeated purchasing behaviours that are derived from retail promotion and determine future brand loyalty. Tragi also indicated that manufacturers encourage retailers via trade promotion, leading to increased demand from those retailers and increased sales to end consumers. Advertising is one of the most common channels by which firms convey product information to consumers. Moorthy and Zhao (2000) suggested a positive relationship between the amount spent on advertising and perceived quality. Signalling theory (Nelson, 1974) and information processing theories posit that brand familiarity and the learning of advertisement-based information increase with advertisement frequency. On the supply side, a firm advertises to promote its product, while from the perspective of demand; consumers are sensitive to product price, product quality and advertising expenditure. Nevertheless, advertising exhibits a positive relationship with quality if demand effects outweigh supply effects (Chenavaz and Jasimuddin, 2017). Chenavaz and Jasimuddin (2017) further argue that a firm may disproportionately emphasize advertising products of lower quality to maximize profit despite consumer awareness of their inferior quality. Advertising can improve consumers’ subjective quality perceptions and enhance their Willingness To Pay (WTP) (Kirmani and Rao, 2000; Zeithaml, 1988) and this can occur regardless of products’ objective quality or lack thereof (Tsui, 2012).
Distributor Image
Distributors face pressures to maintain impressive positions (Stern and Weitz, 1997) although, according to Mulky (2013), the role of distributors is no longer prominent because of dynamic market environments. Kraftt maintains that distributors, wholesalers and retailers are vital intermediaries of marketing channels that perform better than most manufacturers. Positive distributor image is important for retaining customers’ loyalty (Kim and Lee, 2010).
Brand Associations
Brand associations refer to the meaning of the brand for consumers. Brand awareness has been defined as the consumer’s ability to recall that the brand is a member of the product category (Pappu et al., 2005). Brand association and brand awareness affect buyers’ decision-making (Keller, 1993). Brand association is correlated with both brand awareness (Atilgan et al., 2005) and brand equity (Aaker, 1991). High brand associations lead to high perceived quality, which, in turn, affects buying decisions. Brand association adds to the buyer’s value perception, giving them a reason for purchasing a product under the brand.
Perceived Quality
Perceived quality can also be meaningful to retailers, distributors and other channel members and thus aid in gaining distribution. Perceived quality is the key dimension associated with brand equity. The higher customers’ expectation to purchase a product belonging to a brand the higher their willingness to recommend that brand to others (Ewing, 2000). In general, when customers perceive high quality, the product meets customers’ needs, which, in turn, leads to their satisfaction and loyalty (Juran & Gofrey, 1999). Hardware retailers’ willingness to order is greater when there are tendencies toward perceiving higher quality. Product quality perception, pressure from the ultimate consumer and loyalty do impact purchasing decisions. Quality is important for retailers’ loyalty; if they are satisfied with their purchase, they are more likely to repurchase (Davis-Sramek et al., 2009). Retailer awareness, retailer association, retailer perceived quality and retailer loyalty are positively related to purchase intention (Das, 2014). As proposed by Pappu et al. (2005) perceived quality is associated with brand loyalty.
Willingness to Order and Brand Loyalty
WTP has been defined as the maximum price that a buyer accepts to pay for a given quantity of goods or services (Wertenbroch and Skiera, 2002). Zielke and Dobbelstein (2007) explained that price is not the only factor influencing customers’ willingness to buy. Buyers who are familiar with a brand have higher buying intention for that brand (Kamins and Marks, 1991). Garretson and Clow (1999) proposed that perceived quality positively influences buying intention. A positive perception determines stronger loyalty, which, in turn, produces intention in purchasing (Parasuraman and Grewal, 2000). In general, brand loyalty is measured by buyers’ purchasing behaviour (Newman and Werbel, 1973). Loyalty behaviour determines the decision in purchasing (Bubb and Rest, 1973). Gordon et al. (1993) state that brand loyalty to distributors is as important as loyalty to manufacturers. A supplier is more likely to be selected if their products have recently been used and proved satisfactory. Moreover, repeated purchases from a supplier are indicative of loyalty. Brand loyalty, being the core of brand equity, can be measured from a customer’s attachment to the brand that leads to repurchasing (Aaker, 1991). Aaker (1996) showed how loyalty critically affects perceived quality and associations and how these constructs can often be evaluated on the basis of their ability to influence loyalty. Perceived quality has a direct influence on brand loyalty and purchase decisions. The proposed hypotheses that are based on the aforementioned literature review are as follows, with the conceptual framework illustrated in Figure 1:
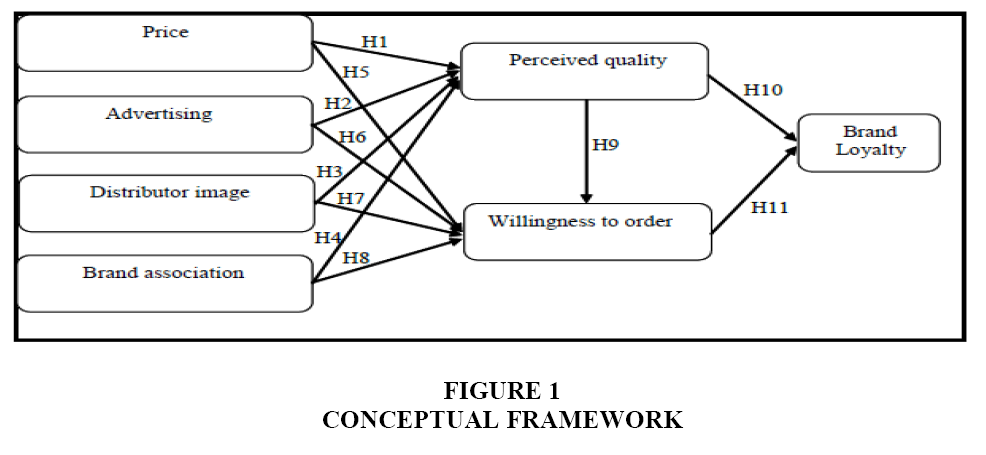
Figure 1: Conceptual Framework
H1: High perceived price is positively associated with perceived quality.
H2: Advertising is positively associated with perceived quality.
H3: Distribution image is positively associated with perceived quality.
H4: Brand association is positively associated with perceived quality.
H5: High price is negatively associated with willingness to order.
H6: Advertising is positively associated with willingness to order.
H7: Distribution image is positively associated with willingness to order.
H8: Brand association is positively associated with willingness to order.
H9: Perceived quality is positively associated with willingness to order.
H10: Perceived quality is positively associated with brand loyalty.
H11: Willingness to order is positively associated with brand loyalty.
Methodology
The targeted respondents were the owners, managers and supervisors of hardware retailers within the Klang Valley, Malaysia. We executed a quota sampling methodology on the basis of the total population of 13 local government areas within the Klang Valley and collected data from 300 respondents through face-to-face interviews using structured questionnaires. We used interviews to maximize the response rate and avoid erroneous interpretations. All measurements were adapted from the available literature and assessed through a five-point Likert scale. The measurements underwent a purification process to ensure reliability and validity (Anderson and Gerbing, 1988). Confirmatory Factor Analysis (CFA) was conducted in SmartPLS to validate the measurement scales that simultaneously examine dependent relationships between exogenous and endogenous variables (Table 1).
| Table 1 Quota Sampling From 13 Areas In Klang Valley, Malaysia |
|||||
| No | Local Government Area | Status | Total Population | Sample Size (n) | Sample Size (%) |
| 1 | Kajang | Municipality | 795,522 | 35 | 11.7 |
| 2 | Klang | Municipality | 744,062 | 32 | 10.7 |
| 3 | Subang Jaya | Municipality | 708,296 | 31 | 10.3 |
| 4 | Petaling Jaya | City | 613,977 | 27 | 9.0 |
| 5 | Selayang | Municipality | 542,409 | 24 | 8.0 |
| 6 | Shah Alam | City | 541,306 | 24 | 8.0 |
| 7 | Ampang Jaya | Municipality | 468,961 | 20 | 6.7 |
| 8 | Sepang | Municipality | 207,354 | 9 | 3.0 |
| 9 | Kuala Lumpur | City | 1,588,750 | 69 | 23.0 |
| 10 | Putrajaya | Corporation | 68,361 | 2 | 0.7 |
| 11 | Seremban | Municipality | 314,502 | 14 | 4.7 |
| 12 | Nilai | Municipality | 200,988 | 9 | 3.0 |
| 13 | Port Dickson | Municipality | 101,073 | 4 | 1.3 |
| Total | 300 | 100.0 | |||
Data Analysis and Findings
Data Reliability and Validity
Following recommended two-stage analytical procedures, we assessed the measurement model (outer model) to examine the reliability and validity of the survey instrument (Figure 2). This involved determining indicator reliability (squared standardized outer loadings); internal consistency reliability (Cronbach’s alpha and composite reliability); convergent validity (average variance extracted); and discriminant validity (Fornell-Larcker criterion and cross-loadings) as described by Hair et al. (2014).
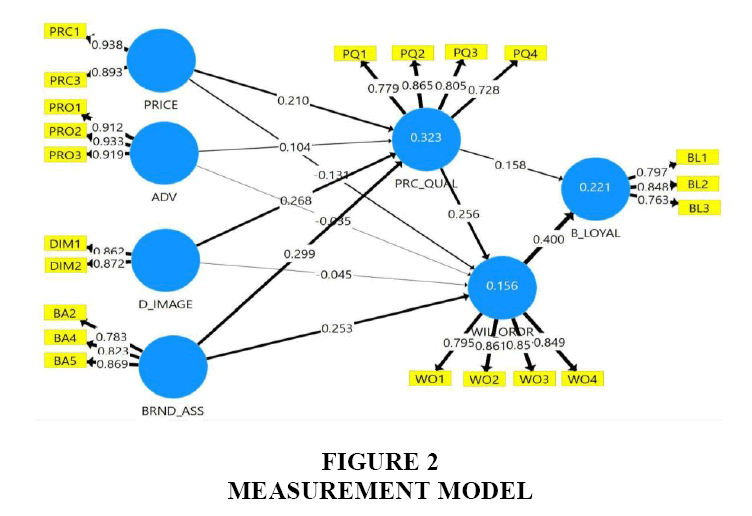
Figure 2: Measurement Model
Reliability
Reliability was assessed through two components: indicator reliability and internal consistency reliability (Hair et al., 2014). In terms of the former, loadings of each indicator to its respective construct were assessed. According to Hair et al. (2014), the standard loadings should be at least 0.5; all items presented in Table 2 meet this requirement and thus, indicator reliability is ensured. To assess internal consistency reliability, both Cronbach’s alpha and composite reliability were assessed; acceptable values for both of these metrics were 0.7 and above according to Hair et al. (2014). Reliability scores provide an indication of the degree to which measures are free from random error and yield consistent results. As shown in Table 2, the reliability scores for all constructs exceeded the 0.7 benchmark. This indicates that the measurements used are consistent in measuring the constructs and testifies to the overall reliability of the model.
| Table 2 Internal Consistency and Convergent Validity |
||||
| Construct | Item | Loading | CR | AVE |
| Brand Association | BA1 | Dropped | 0.865 | 0.682 |
| BA2 | 0.783 | |||
| BA3 | Dropped | |||
| BA4 | 0.823 | |||
| BA5 | 0.869 | |||
| Brand Loyalty | BL1 | 0.797 | 0.845 | 0.645 |
| BL2 | 0.848 | |||
| BL3 | 0.763 | |||
| Distributor Image | DIM1 | 0.862 | 0.858 | 0.752 |
| DIM2 | 0.872 | |||
| DIM3 | Dropped | |||
| Perceived Quality | PQ1 | 0.779 | 0.873 | 0.633 |
| PQ2 | 0.865 | |||
| PQ3 | 0.805 | |||
| PQ4 | 0.728 | |||
| Price | PRC1 | 0.938 | 0.912 | 0.839 |
| PRC2 | Dropped | |||
| PRC3 | 0.893 | |||
| Advertising | ADV1 | 0.912 | 0.944 | 0.85 |
| ADV2 | 0.933 | |||
| ADV3 | 0.919 | |||
| ADV4 | Dropped | |||
| Willingness to Buy | WO1 | 0.795 | 0.905 | 0.704 |
| WO2 | 0.861 | |||
| WO3 | 0.851 | |||
| WO4 | 0.849 | |||
Construct Validity
Construct validity comprises convergent validity and discriminant validity. As shown in Table 2, the Average Variance Extracted (AVE) for each construct exceeded the 0.5 benchmark, which, according to Hair et al. (2014), indicates a sufficient degree of convergent validity, meaning that the latent variable explains more than half of its indicators’ variance.
We assess discriminant validity through Fornell and Larcker (1981) criterion and the Hetero Trait-Mono Trait (HTMT) ratio of correlations. As for discriminant validity, the square root of each construct’s AVE suggested is greater than its correlation with other constructs. The values in bold in Table 3 represent the square root of the AVE of each latent variable and these values are greater than the squared correlations between the latent variable and all other variables.
| Table 3 Discriminant Validity: Fornell and Larcker Criterion |
|||||||
| BRND_ASS | B_LOYAL | D_IMAGE | PRC_QUAL | PRICE | PROM | WIL_ORDR | |
| BRND_ASS | 0.826 | ||||||
| B_LOYAL | 0.295 | 0.803 | |||||
| D_IMAGE | 0.221 | 0.09 | 0.867 | ||||
| PRC_QUAL | 0.402 | 0.272 | 0.385 | 0.796 | |||
| PRICE | 0.116 | 0.056 | 0.189 | 0.337 | 0.916 | ||
| PROM | 0.188 | 0.053 | 0.102 | 0.273 | 0.403 | 0.922 | |
| WIL_ORDR | 0.325 | 0.445 | 0.081 | 0.287 | -0.038 | 0.025 | 0.839 |
Table 4 shows the correlation values corresponding to the respective constructs. All values are below the HTMT 0.90 criterions (Henseler et al., 2015); thus, we can conclude that discriminant validity is established in the measurement model.
| Table 4 Assessment of Path Coefficients |
|||||
| Hypothesis | Descriptions | Std. Beta | Std. Error | T-Value | Decision |
| H1 | PRICE -> PRC_QUAL | 0.21 | 0.051 | 4.15** | Supported |
| H2 | ADV -> PRC_QUAL | 0.104 | 0.055 | 1.90* | Supported |
| H3 | D_IMAGE -> PRC_QUAL | 0.268 | 0.054 | 4.98*** | Supported |
| H4 | BRND_ASSO -> PRC_QUAL | 0.299 | 0.051 | 5.80*** | Supported |
| H5 | PRICE -> WIL_ORDR | -0.131 | 0.064 | 2.07* | Supported |
| H6 | ADV -> WIL_ORDR | -0.035 | 0.060 | 0.58 | Not Supported |
| H7 | D_IMAGE -> WIL_ORDR | -0.045 | 0.056 | 0.811 | Not Supported |
| H8 | BRND_ASSO -> WIL_ORDR | 0.253 | 0.061 | 4.17*** | Supported |
| H9 | PRC_QUAL -> WIL_ORDR | 0.256 | 0.065 | 3.97** | Supported |
| H10 | PRC_QUAL -> B_LOYAL | 0.158 | 0.049 | 3.24*** | Supported |
| H11 | WIL_ORDR -> B_LOYAL | 0.4 | 0.051 | 7.78*** | Supported |
***p<0.01, **p<0.05, *p<0.10
Hypothesis Testing
The structural model was then tested, given that the measurement model had been validated and a satisfactory fit achieved. The bootstrapping procedure produced path coefficients that quantify the nature and extent of the relationships; the number of bootstrap samples is 5,000 as recommended by Hair et al. (2014). The critical t-value for a two-tailed test at the 5% level is 1.96; this was used as the statistical decision criterion instead of either the more stringent 1% level approach or the more lax 10% level approach. The results of hypothesis testing are discussed below. First, there is a positive, statistically significant relationship between price and perceived quality (β=0.21, t-value=4.15), which is found to support H1. H2 examines advertising’s influence on perceived quality and is found to be supported (β=0.104, t- value=1.90). H3, positing that distribution image has a positive impact on perceived quality, is also supported (β=0.268, t-value=4.98). H4 examines brand association and perceived quality by putting forth a positive association between these phenomena, which is again borne out by the results (β=0.299, t-value=5.80). In terms of H5, price is found to be negatively associated with willingness to order; however, no significant relationships were revealed with respect to H6 and H7. There is a positive relationship between brand association and willingness to order, which supports H8 (β=0.253, t-value=4.17). The positive relationship between perceived quality and willingness to order supports H9 (β=0.256, t-value=3.97). As for H10, the association between perceived quality and brand loyalty is also revealed to be positively significant (β=0.158, t-value=3.2). Last, H11, which posits a positive relationship between willingness to order and brand loyalty, is also supported (β=0.4, t-value=7.78). Table 4 summarizes the results of hypothesis testing. The coefficient of determination, R2, is statistically significant (p<0.05) and quantifies that 22% of brand loyalty is explained by willingness to order and products’ perceived quality, with 34% of perceived quality explained by price, promotion, distributor image and brand association.
Discussion and Conclusion
First, the results show that perceived quality and willingness to order can explain brand loyalty, which is consistent with previous literature. However, the mediation effects of perceived quality suggest that price, distribution image and advertising are not directly affecting willingness of hardware retailers to order, it has to have a superior perception of quality in the minds of retailers prior to order. We found that superior perception of quality is not only derived from price, distribution image and advertising but also brand association is the key drivers of perceived quality. Moreover, willingness to order is the main contributor to brand loyalty among hardware retailers. The present study highlights that advertising and distribution image are not associated with retailers’ willingness to order. It was expected the negative relationship between price and willingness to order among retailers however positive relationship between price and perceived quality, was not expected. One can conclude that with the proliferation of counterfeit brands and low-quality products, hardware retailers may need to be vigilant and prudent in ordering hardware products. This implies that perceived quality and brand association may play a more significant role in attracting hardware retailers. Thus, for retailers to be loyal to manufacturers, quality and brand association are the main contributing factors that the latter should consider.
Acknowledgement
The study was supported by a research grant from the Newell Rubbermaid (M) Sdn. Bhd and Polychem Sdn. Bhd. [Grant No: 4475/000].
References
- Aaker, D.A. (1991). Managing brand equity: Capitalizing on the value of a brand name. Free Press, New York.
- Aaker, D.A. (1996). Building strong brands. Free Press, New York.
- Anderson, J.C., & Gerbing, D.W. (1988). Structural equation modelling in practice: A review and recommended two-step approach. Psychological Bulletin, 103(3), 411-423.
- Atilgan, E., Aksoy, S., & Akinci, S. (2005). Determinants of the brand equity: A verification approach in the beverage industry in Turkey. Marketing Intelligence and Planning, 23(3), 237-248.
- Bubb, P.L., & Van Rest, D.J. (1973). Loyalty as a component of the industrial buying decision. Industrial Marketing Management, 3(1), 25-32.
- Chattopadhyay, T., Shivani, S., & Krishnan, M. (2010). Marketing mix elements influencing brand equity and brand choice. Vikapla: The Journal for Decision Makers, 35(3), 67-84.
- Chenavaz, R.Y., & Jasimuddin, S.M. (2017). An analytical model of the relationship between product quality and advertising. European Journal of Operational Research, 263(1), 295-307.
- Das, G. (2014). Linkages of retailer awareness, retailer association, retailer perceived quality and retailer loyalty with purchase intention: A study of Indian food retail brands. Journal of Retailing and Consumer Services, 21(3), 284-292.
- Davis-Sramek, B., Droge, C., Mentzer, J.T., & Myers, M.B. (2009). Creating commitment and loyalty behaviour among retailers: What are the roles of service quality and satisfaction? Journal of the Academy Of Marketing Science, 37(4), 440-454.
- Ewing, M.T. (2000). Brand and retailer loyalty: Past behavior and future intentions. Journal of Product & Brand Management, 9(2), 120-127.
- Falahat, M., Migin, M.W., Chuan, C.S., & Kai, S.B. (2017). Determinants of consumer impulse buying behaviour in context of footwear industry. Advanced Science Letters, 23(4), 3068-3070.
- Fornell, C., & Larcker, D.F. (1981). Evaluating structural equation models with unobservable variables and measurement error. Journal of Marketing Research, 18(1), 39-50.
- Garretson, J.A., & Clow, K.E. (1999). The influence of coupon face value on service quality expectations, risk perceptions and purchase intentions in the dental industry. Journal of Services Marketing, 13(1), 59-72.
- Gedenk, K., & Neslin, S.A. (1999). The role of retail promotion in determining future brand loyalty: Its effect on purchase event feedback. Journal of Retailing, 75(4), 433-459.
- Gilaninia, S.H., & Mousavian, J. (2010). The impact of brand loyalty on brand equity from the perspective of bank customer’s e-cards. Journal of Industrial Management Sanandaj University, 14, 103-120.
- Gordon, G.L., Calantone, R.J., & Di Benedetto, C.A. (1993). Brand equity in the business-to-business sector: An exploratory study. Journal of Product and Brand Management, 2(3), 4-16.
- Hair, J.F., Hult, G.T.M., Ringle, C.M., & Sarstedt, M. (2014). A primer on Partial Least Squares Structural Equation Modelling (PLS-SEM). SAGE Publications, California.
- Hair, J.F., Ringle, C.M., & Sarstedt, M. (2014). PLS-SEM: Indeed a silver bullet. Journal of Marketing Theory and Practice, 19(2), 139-152.
- Henseler, J., Ringle, C.M., & Sarstedt, M. (2015). A new criterion for assessing discriminant validity in variance-based structural equation modelling. Journal of the Academy of Marketing Science, 43(1), 115-135.
- Howard, J.A., & Seth, J.N. (1969). The theory of buyer behaviour. John Wiley & Sons, New York.
- Juran, J.M., & Gofrey, A.B. (1999). Juran's quality handbook. McGraw-Hill, New York, NY.
- Kamins, M.A., & Marks, L.J. (1991). The perception of Kosher as a third party certification claim in advertising for familiar and unfamiliar brands. Journal of the Academy of Marketing Science, 19(3), 177-185.
- Kapferer, J.N. (2008). The new strategic brand management: Creating and sustaining brand equity long term. Kogan Page Ltd, London.
- Keller, K.L. (1993). Conceptualizing, measuring and managing customer-based brand equity. Journal of Marketing, 57(1), 1-22.
- Keller, K.L. (2013). Strategic brand management: Building, measuring and managing brand equity. Pearson Education Ltd, Harlow.
- Kim, J.H., & Hyun, Y.J. (2011). A model to investigate the influence of marketing-mix efforts and corporate image on brand equity in the IT software sector. Industrial Marketing Management, 40(3), 424-438.
- Kim, Y., & Lee, J.W. (2010). Relationship between corporate image and customer loyalty in mobile communications service markets. African Journal of Business Management, 4(18), 4035-4041.
- Kirmani, A., & Rao, A.R. (2000). No pain, no gain: A critical review of the literature on signalling unobservable product quality. Journal of Marketing, 64(2), 66-79.
- Kotler, P., Keller, K.L., Ang, S.H., Leong, S.M., & Tan, C.T. (2013). Marketing management: An Asian perspective. Prentice Hall, Singapore.
- Krystallis, A., & Chrysochou, P. (2014). The effects of service brand dimensions on brand loyalty. Journal of Retailing and Consumer Services, 21(2), 139-147.
- Maheshwari, V., Lodorfos, G., & Jacobsen, S. (2014). Determinants of brand loyalty: A study of the experience-commitment-loyalty constructs. International Journal of Business Administration, 5(6), 13-23.
- Moorthy, S., & Zhao, H. (2000). Advertising spending and perceived quality. Marketing Letters, 11(3), 221-233.
- Mulky, A.G. (2013). Distribution challenges and workable solutions. IIMB Management Review, 25(3), 179-195.
- Nelson, P. (1974). Advertising as information. Journal of Political Economy, 82(4), 729-754.
- Neslin, S.A., Powell, S.G., & Stone, L.S. (1995). The effects of retailer and consumer response on optimal manufacturer advertising and trade promotion strategies. Management Science, 41(5), 749-766.
- Newman, J.W., & Werbel, R.A. (1973). Multivariate analysis of brand loyalty for major household appliances. Journal of Marketing Research, 10(4), 404-409.
- Pappu, R., Quester. P.G., & Cooksey, R.W. (2005). Consumer-based-brand equity: Improving the measurement-empirical evidence. Journal of Product & Brand Management, 14(3), 143-154.
- Parasuraman, A., & Grewal, D. (2000). The impact of technology on the quality-value-loyalty chain: A research agenda. Academy of Marketing Science Journal, 28(1), 168-174.
- Poddar, A., Donthu, N., & Parvatiyar, A. (2013). Drivers of trade promotion receptiveness: The role of relationship and trade promotion satisfaction. Journal of Marketing Theory & Practice, 21(1), 45-56.
- Sheth, J.N. (1981). A theory of merchandise-buying behaviour. In R. Stampfl & E. Hirschman (Eds.), Theories of Retailing: Traditional and Non-Traditional Sources (pp. 180-189). American Marketing Association.
- Steenkamp, J.BE.M., & Kumar, N. (2007). Private label strategy: How to meet the store brand challenge. Harvard Business School Press, Cambridge, Massachusetts.
- Stern, L.W., & Weitz, B.A. (1997). The revolution in distribution: Challenges and opportunities. Long Range Planning, 30(6), 823-829.
- Tsui, H.C. (2012). Advertising, quality and willingness-to-pay: Experimental examination of signalling theory. Journal of Economic Psychology, 33(6), 1193-1203.
- Wertenbroch, K., & Skiera, B. (2002). Measuring consumers' willingness to pay at the point of purchase. Journal of Marketing Research, 39(2), 228-241.
- Yoo, B., Donthu, N., & Lee, S. (2000). An examination of selected marketing mix elements and brand equity. Journal of the Academy of Marketing Science, 28(2), 195-211.
- Zeithaml, V.A. (1988). Consumer perceptions of price, quality and value: A means-end model and synthesis of evidence. Journal of Marketing, 52(3), 2-22.
- Zielke, S., & Dobbelstein, T. (2007). Customer’s willingness to purchase new store brands. Journal of Product & Brand Management, 16(2), 112-121.