Research Article: 2022 Vol: 25 Issue: 3
Community Satisfaction in Public Services during the Covid-19 Pandemic: A Structural Equation Modelling Approach
Hardiyansyah, Sekolah Tinggi Ilmu Ekonomi Serelo Lahat
Maulana, Universitas Tamansiswa Palembang
Emiyati, Sekolah Tinggi Ilmu Ekonomi Serasan Muara Enim
Citation Information: Hardiyansyah., Maulana., & Emiyati. (2022). Community satisfaction in public services during the covid-19 pandemic: A structural equation modelling approach. Journal of Legal, Ethical and Regulatory Issues, 25(3), 1-14.
Abstract
This study aims to analyze the community's satisfaction with the public services provided during the COVID-19 pandemic at the Regional General Hospital (RGH) Dr. H.M. Rabain Muara Enim. Data were collected through questionnaires distributed to 347 respondents. This study employed the Confirmatory Factor Analysis (CFA) on LISREL 8.8 to analyze the data. Results unveil that the level of community satisfaction with the services provided in the emergency room (ER) department was highly satisfactory. The attribute most perceived by the community related to service satisfaction in the ER is service speed, procedure simplicity, and cost affordability. Almost all service attributes are highly expected, and the organization has performed optimally, and hence the services in the ER are satisfactory. At the inpatient unit (IU), the quality of service was acceptable. Attributes that affect the quality of service at IU is the complaint system. At the same time, the quality of service in the outpatient unit (OU) is on the responsibility and ability. Responsibilities and service capabilities that have been given to the community or outpatients have been in accordance with expectations.
Keywords
Community Satisfaction, Public Services, The COVID-19 Pandemic, SEM Model.
Introduction
The COVID-19 pandemic that has been transpiring worldwide, including Indonesia, has produced significant impacts. This pandemic has created a new order of life, also called the new normal. In Indonesia, this new life order is better known as adapting new habits to make it easier for the public to understand (Mulianingsih, 2020). Since the COVID-19 pandemic, human needs have to be met. However, in fact, since the COVID-19 pandemic, the trend of public service complaints has increased where people feel that their rights as citizens have not been fulfilled through the provision of existing public services such as the sectors of providing social, financial, health and security assistance (Firdausijah & Muliawaty, 2020).
The COVID-19 pandemic has changed the conditions of human life. This includes in public services because all types of services have become constrained, both because face-to-face contact between service officers and the community is limited and obstacles due to frequent miscommunication. If it is related to administrative services, maybe it can still be overcome with online services, but if it is related to health services, it will be difficult because health services are impossible for online services. Meanwhile, all services are endeavored to avoid meeting face to-face, except for urgent services, and must comply with strict health protocols, such as wearing masks, keeping a distance, washing hands, avoiding crowds, and others.
In connection with the above, there have been various complaints from the public regarding the existing service conditions. They convey these complaints through various media, especially social media, such as Facebook, WhatsApp (WA), Twitter, Telegram, including print media. The government has made efforts to anticipate the possibility of various problems in public services in the current situation, including in health services.
Sundararaman (2020) suggested that people who come seeking treatment for COVID-19 symptoms mingle with those with co-morbidities and vulnerabilities in outpatient wards or as inpatients, leading to a large spread of the disease. Fearing infection, most private hospitals have closed. What is needed is to implement protocols to prevent hospital-acquired infections. The above conditions also occur at RGH Dr. H.M Rabain Muara Enim. People also flock to this hospital to have their health checked, with the results of the examination worrying. Not only are patients worried about their health condition, but most state civil servants (ASN) are also worried that all health workers must wear personal protective equipment in every health care process. Megatsari et al. (2020), in their research, concluded that public services during the COVID-19 pandemic affected the psychosocial burden, namely the level of public anxiety in Indonesia based on age, gender, education, and occupation. Various psychological disorders have been reported and published during the Covid-19 outbreak, one of which is stress. Stress is not only felt by the public, even health workers and everyone who works in the medical field. Psychological disorders have a more expansive and lasting impact than physical injuries, while attention to mental health is much less (Handayani et al., 2020). Facing conditions like this, cooperation and wisdom from various parties are needed, especially between health workers and the people they serve. Must be able to create a conducive atmosphere and provide tranquility for all. The results show that sense of community has a significant role in utilizing local culture and creating collaborative knowledge (Al-Omoush et al., 2021).
In contrast to the information above, the research results by Arfan et al. (2021) state that the COVID-19 pandemic has changed the paradigm of the ASN work system to be more effective and efficient result-oriented than procedural. ASN strives to provide excellent public services to the community amid the COVID-19 pandemic. However, the Indonesian bureaucracy has been unable to respond to strategic problems in Indonesia quickly. This is due to several obstacles to an apathetic bureaucratic culture and the lack of participation of all parties in the public service process during the COVID-19 pandemic.
Muara Enim Regency Government, through RGH Dr. H. M Rabain, which is the object of this research, has tried to continue to provide the best service to the community since the COVID-19 pandemic emerged in Muara Enim Regency. As a referral hospital in the Muara Enim Regency, Penukal Abab Lematang Ilir Regency, Lahat Regency, Pagar Alam City, and Empat Lawang Regency, the results of a survey of community satisfaction with the health services of RGH Dr. H. M Rabain before the COVID-19 pandemic, was generally considered to have provided satisfactory service, because all elements in the community satisfaction index (CSI) obtained an average value above a value of 3. RGH Dr. H. M Rabain in 2019 obtained a score of 84.62 or a Service Quality Level of acquisition, namely a B (Good) score. However, from the service variables surveyed, there are still service units that are considered not to provide optimal service quality and facilities, including the layout of the service counters, which are still inadequate. It seems that it is still chaotic, the toilets for visitors are still not clean, they still seem to be toilets are just there, not all service waiting rooms have provided free drinking water, wifi, reading materials, there are still service units that install service notices, service terms and service hours, the placement of service information that is still not neatly arranged seems to plug it in. In connection with the description above, to further see the actual condition of public services in the Health sector in Muara Enim Regency, this research raises the theme of public satisfaction on public services during the COVID-19 pandemic: A structural equation modeling (SEM) approach.
Literature Review
The new paradigm of public service is to place the public as service users and the government as the service provider in an equal position (Denhardt & Denhardt, 2015). The ability to realize quality public services is one indicator of the success of local governments in implementing regional autonomy policies (Hardiyansyah, 2018).
Research on public services during the COVID-19 pandemic and the problems it causes has been carried out by Nugraha et al. (2020); Firmansyah et al. (2020); Purwanto et al. (2020); Wiryanto (2020); Lubis (2020); Ramadhani & Lubis (2021); Susilo et al (2021); Haryono et al. (2021); Reynilda et al. (2021); Mahendradhata et al. (2021); Setiawati et al. (2021). More specifically, Taufik & Hardi (2020) found two dimensions of bureaucratic change: changes in the dimensions of bureaucratic institutions and changes in work systems. In the dimension of bureaucratic institutional change, over regular disruption occurs. In this case, COVID-19 requires organizations to make new regular changes. Where the bureaucracy in providing public services prioritizes health protocols. Meanwhile, in the dimension of the work system, there are two choices, namely, working at home and continuing to work in the office but still paying attention to health protocols. The COVID-19 pandemic has resulted in many electronic-based public service innovations, so it is necessary to strengthen the quality and innovative ASN human resources and support infrastructure development. According to Kossasy et al. (2021), that the use of data technology has brought a massive positive change in culture and certain mindsets for ASN, especially considering that almost all service zones change the pattern of services that are currently being tried manually, face to face, transformed through digital technology. Meanwhile, the results of the study of Guida & Carpentieri (2021) suggest that the elderly population in all neighborhoods suffer from very poor accessibility to primary health care, especially in the suburbs, and their condition is getting worse due to limited services and activities. Related to this, the research results by Ruslina & Sekarsari (2020) show that various laws and regulations as policies for handling Covid-19 cannot be realized concretely in the field because they are related to bureaucracy and different implementations.
Kauzya & Niland (2020) indicated that the critical role of civil servants has been and should continue to play to ensure an effective response to the COVID-19 pandemic by ensuring the continuity of public services; community-oriented; fast-thinking, creativity and innovation; strategic planning amid chaos; build better effectiveness and more responsive public services. Noreen et al. (2020) concluded that low literacy rates and a general lack of awareness cause people not to take social distancing and hand hygiene seriously.
Research and Analysis Methods
The research method used is a quantitative method with the main instrument in a questionnaire distributed to respondents. In addition to data to enrich the analysis, interviews were also conducted with several respondents and field observations. The population in the study was patients at RGH Dr. H.M. Rabain during the COVID-19 pandemic with 60,008 outpatient visits, 11,340 inpatients, and 14,037 emergency patients. The overall total was 85,394 patients. Because the population is quite large, in this study, the determination of the number of respondents was carried out through the sampling technique from Isaac & Michel's Table in Sugiyono (2015) with an error rate of 5%, the number of samples was 347 respondents with details, 227 respondents from OU, 57 respondents from the IU, and 63 respondents from the ER. Measurement model analysis was conducted to assess the validity and reliability of the indicators used to represent the hypothesized or constructed constructs. The purpose of this validity and reliability test is to build a fit model of an instrument. Validity is essential to show the extent to which the scale used measures what it is supposed to measure. The reliability scale measures the consistency of the respondents' answers on the latent variable, meaning the extent to which the steps are free from random errors.
Analysis of the measurement model on the public service variable was performed using the Confirmatory Factor Analysis (CFA) from the LISREL 8.8 program. CFA analysis was conducted to see the ability of indicators to explain latent variables. The size of the indicator in explaining the latent variable is expressed by factor loading. The greater the factor loading value indicates that the indicator is better at measuring what should be measured or called the more valid. According to Hair et al. (2021), if the factor loading value is greater than 0.5, the indicator is valid.
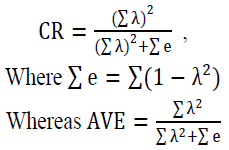
The reliability test is performed by calculating Construct Reliability (CR) and Average Variance Extract (AVE). The instrument or variable is declared to have good reliability if CR 0.7 and AVE 0.5. If the CR value is between 0.6-0.7, the reliability is still acceptable, as long as the indicators have good validity (Hair et al., 2021).
The following formula calculates the CR value.
The CFA model will be formed in several stages to obtain a fit CFA measurement model, meaning that it meets various model fit criteria so that the model shows that it is valid and reliable.
To determine the perceived value, interval value, service quality, and service unit performance refer to the Regulation of the Minister of Administrative Reform and Bureaucratic Reform of the Republic of Indonesia Number 14 of 2017 concerning Guidelines for Compiling a Community Satisfaction Survey for Public Service Providers, presented in Table 1.
| Table 1 Perception Value, Interval Value, Conversion Interval Value, Service Quality, and Service Unit Performance | ||||
| Perception Value | Interval Value (IV) | Interval Value Conversion (IVC) | Service Quality (X) | Service Unit Performance (Y) |
| 1 | 1.00–2.5996 | 25.00–64.99 | D | Bad |
| 2 | 2.60–3.064 | 65.00–76.60 | C | Not good |
| 3 | 3.0644–3.532 | 76.61–88.30 | B | Good |
| 4 | 3.5324–4.00 | 88.31–100.00 | A | Very good |
Research Results and Analysis
Characteristics of OU respondents. Of the 227 respondents, 48 patients (21.1%) were 41- 50 years old, 44 patients (19.4%) were 31-40 years old, 44 patients (19.4%) were 51-60 years old, 42 patients (18.5%) were 20-30 years old, 29 patients (12.8%) were >60 years old, and 20 patients (8.8%) were <20 years old. A total of 122 patients (53.7%) were male, and 104 patients (45.8%) were female. Most of the patients had a high school education background, as many as 114 patients (50.2%), and the rest had elementary education, junior high school, D1-D3, strata one, and strata two and three. Most of them had other occupational backgrounds (e.g., farming and laborers) as many as 109 patients (48%), while the rest worked in the private sector, civil servants/army/policeman, students, entrepreneurs, and traders. The results of the CSI measurement at the OU are presented in Table 2.
| Table 2 The Results of the CSI Measurement at the OU | ||||
| No | Service Aspect | Service Aspect Value | CSI Value | Service Quality |
| 1 | Ease of Requirements | 3.088 | 77.2 | Good |
| 2 | Procedure Simpilicity | 3.04 | 76 | Good |
| 3 | Service Speed | 2.784 | 69.6 | Good |
| 4 | Cost Affordability | 3.141 | 78.525 | Good |
| 5 | Service Suitability | 3.11 | 77.75 | Good |
| 6 | Ability | 3.242 | 81.05 | Good |
| 7 | Hospitality | 3.167 | 79.175 | Good |
| 8 | Responsibility | 3.278 | 81.95 | Good |
| 9 | Complaint System Quality | 2.872 | 71.8 | Good |
| Overall CSI Value | 76.928 | Good | ||
Table 2 shows that the element with the highest score is Responsibility (3.278). Meanwhile, the element with the lowest value is Service Speed (2,784). This figure shows that the highest level of service satisfaction is obtained from the responsibilities of doctors, nurses, midwives, and other officers, who have provided services with full responsibility in accordance with the applicable service standards at RGH Dr. H.M. Rabain Muara Enim. While the lowest value is from the element of the speed of service, namely the "time" needed to get health services in accordance with the established service time standards. According to information from "several" patients/respondents when the survey was conducted, that indication of the "Speed of Service Element" received the lowest score compared to the other elements, namely the registration time, which took a long time, the waiting time to get a service call was sometimes more than 2 O'clock. Overall, the Community Satisfaction Index indicator for OU services is 76.928, which means that it is included in good service quality.
Characteristics of respondents on IU: Based on the patient's origin, of the 57 respondents at IU, 47 patients, or 82.5%, came from the Muara Enim area, while the remaining 10 patients came from outside Muara Enim Regency. Covering the area of Prabumulih, Lahat, and based on the age of IU patients, 12 patients (21.1%) aged 51-60 years, 11 patients (19.3%) aged 31-40 years, 10 patients (17.5%) aged 20 -30 years, 9 patients (15.8%) were >60 years old, 8 patients (14%) were 41-50 years old, and 7 patients (12.3%) were <20 years old. Based on the gender of the patient, 30 patients (52.6%) were female, and 27 patients (47.4%) were male. Based on education level, there were 22 high school alumni (38.6%), and the rest came from elementary, junior high, Diploma 1-Diploma 3, undergraduate, and second and third levels. Based on occupation, most of them had other occupational backgrounds (farming and labor), as many as 38 patients (66.7%), while the rest were from private jobs, civil servants/army/policeman, students, entrepreneurs, and traders. The results of the CSI measurement on the IU are presented in Table 3.
| Table 3 The Results of the CSI Measurement on IU Respondents | ||||
| No | Service Aspect | Service Aspect Value | CSI Value | Service Quality |
| 1 | Ease of Requirements | 3.053 | 76.325 | Good |
| 2 | Procedure Simpilicity | 3.018 | 75.45 | Good |
| 3 | Service Speed | 2.895 | 72.375 | Good |
| 4 | Cost Affordability | 3.07 | 76.75 | Good |
| 5 | Service Suitability | 3 | 75 | Good |
| 6 | Ability | 3.123 | 78.075 | Good |
| 7 | Hospitality | 3.14 | 78.5 | Good |
| 8 | Responsibility | 2.965 | 74.125 | Good |
| 9 | Complaint System Quality | 2.877 | 71.925 | Good |
| Overall CSI Value | 75.314 | Good | ||
Table 3 represents that the service element with the highest score is Hospitality (3.14). Meanwhile, the element with the lowest score is the quality of the complaint system (2.877). This figure shows that the highest level of service satisfaction is obtained from the friendliness of doctors, nurses, midwives, and other officers who have provided friendly, courteous, and respectful service to patients. However, some patients/respondents reported that service staff was less friendly and sometimes curt. In comparison, the lowest value is from the element "Quality of the complaint system" namely the system for handling complaints, suggestions, and inputs at RGH Dr. H.M. Rabain. Although the value is low, this element is still in the "good" category. The low value of the CSI on this element is reflected in the information of several respondents who said that they did not know where to submit complaints, and complaints that were submitted were sometimes not responded to quickly.
The results of field observations and information from several patients/respondents at IU services found that service facilities were still lacking, such as chairs, facilities for people with disabilities that were not functioning properly; waiting room capacity was less spacious, leaky bathrooms, and dirty toilets. Overall, the Community Satisfaction Index indicator for IU services is 75.314, which means that it is good service quality.
Characteristics of respondents in the ER: Respondents in the ER were 63 people; 55 patients, or 87.3%, came from the Muara Enim area, while the remaining 8 patients came from outside Muara Enim Regency (e.g., the Prabumulih, Lahat, and surrounding areas). Based on age, it was known that 15 patients (23.8%) were 51-60 years old, 14 patients (22.3%) were 31-40 years old, 11 patients (17.5%) were 41-50 years old, 9 patients (14.3%) were 20-30 years old, 7 patients (11.1%) were <20 years old, and 7 patients (11.1%) were>60 years old. Based on gender, 37 patients (58.7%) were male, and 26 patients (41.3%) were female. Based on the education level, most of the patients had a high school education background, as many as 33 patients (52.4%), and the rest had elementary, junior high, D1-D3, Strata One, and Strata Two and Three backgrounds. Based on occupation, most of them have other occupational backgrounds (farming and labor), as many as 29 patients (46%), while the rest have private employment backgrounds, civil servants/army/policeman, students, entrepreneurs, and traders. The results of the CSI measurement in the ER are presented in Table 4.
| Table 4 Results of ER Respondents' CSI Measurements | ||||
| No | Service Aspect | Service Aspect Value | CSI Value | Service Quality |
| 1 | Ease of Requirements | 3.095 | 77.375 | Good |
| 2 | Procedure Simplicity | 3.159 | 78.975 | Good |
| 3 | Service Speed | 3.127 | 78.175 | Good |
| 4 | Cost Affordability | 3.175 | 79.375 | Good |
| 5 | Service Suitability | 3.143 | 78.575 | Good |
| 6 | Ability | 3.127 | 78.175 | Good |
| 7 | Hospitality | 3.19 | 79.75 | Good |
| 8 | Responsibility | 3.19 | 79.75 | Good |
| 9 | Complaint System Quality | 2.841 | 71.025 | Good |
| Overall CSI Value | 77.832 | Good | ||
Table 5 shows that the service elements with the highest scores are Hospitality (3.19) and Responsibility (3.19). Meanwhile, the element with the lowest score is the quality of the complaint system (2.841). This figure shows that the highest level of service satisfaction is obtained from the friendliness and responsibility of doctors, nurses, midwives, and other officers who have provided friendly, courteous, and respectful service to patients and provided services with full responsibility in accordance with applicable service standards at RGH Dr. H.M. Rabain Muara Enim.
| Table 5 Overall CSI Measurement Results (OU, IU, and ER) | ||||
| No | No | Service Aspect | Service Aspect Value | CSI Value |
| 1 | Ease of Requirements | 3.084 | 77.1 | Good |
| 2 | Procedure Simpilicity | 3.058 | 76.45 | Good |
| 3 | Service Speed | 2.865 | 71.625 | Good |
| 4 | Cost Affordability | 3.135 | 78.375 | Good |
| 5 | Service Suitability | 3.098 | 77.45 | Good |
| 6 | Ability | 3.202 | 80.05 | Good |
| 7 | Hospitality | 3.167 | 79.175 | Good |
| 8 | Responsibility | 3.21 | 80.25 | Good |
| 9 | Complaint System Quality | 2.867 | 71.675 | Good |
| Overall CSI Value | 76.827 | Good | ||
While the lowest value is from the quality element of the complaint system, namely the system for handling complaints, suggestions, and inputs at RGH Dr. H.M. Rabain goes according to the procedure. However, based on information from several patients/respondents, the complaint system is not functioning properly. Sometimes complaints are not immediately responded.
Some patients/respondents also reported that the service felt too long because each patient had to be given a rapid antigen before being placed in the treatment room. Waiting for the rapid antigen test results is what sometimes takes a relatively long time, and sometimes the service is not friendly enough. The results of field observations also obtained reports that there were no facilities for the disabled, AC was not functioning properly, and toilet facilities were partly in a damaged condition. Overall, the Community Satisfaction Index indicator for emergency care services is 77.832, which means that it is included in the category of good service quality. The results of the CSI measurement for all OU, IU, and ER service units are presented in Table 5.
Table 5 shows that the overall service element with the highest value is Ability (3.202). Meanwhile, the element with the lowest value is Service Speed (2.865). This figure shows that the highest level of service satisfaction in all forms of service (outpatient, inpatient, and emergency department) is obtained from doctors, nurses, midwives, and other officers who have knowledge, expertise, skills, and experience following their field of work.
While the lowest value is from the element of "Service Speed" which is the time required to get health services at Dr. Hospital. H.M. Rabain Muara Enim per the service time standards set. Although this element is the lowest cumulatively, it is still in the "good" category. Overall, the Community Satisfaction Index indicators in health services at RGH Dr. H.M. Rabain Muara Enim is 76,827, which means that it is included in the category of good service quality.
Analysis Results of Measurement Models on the Service Variables
The CFA model for the public service variable consists of nine indicators. The measurement model in this study was carried out in first order, namely measuring the variables formed from each of the indicators forming the construct. Based on the data processing results through the LISREL 8.8 program, the estimated factor loading values for the public service variable are shown in Figure 1.

Figure 1 Results of the Community service CFA Model Estimation
Based on the initial CFA model formation results for the public service variable by involving all existing indicators, then the magnitude of the factor loading value for each indicator is seen. The loading factor value of more than 0.5 is declared valid, while the reliability value is seen based on the CR and AVE values. The indicator criteria in a variable are declared reliable if CR>0.7 and AVE>0.5. The magnitude of the factor loading value of each indicator on the public service variable is shown in Table 6.
| Table 6 Loading Factor Value and Reliability Value of Initial Public Service Model | ||||
| Indicator | Factor Loading (λ) | Squared Factor Loading (λ2) | Error (e) | Description |
| P1 | 0.780 | 0.608 | 0.392 | Valid |
| P2 | 0.810 | 0.656 | 0.344 | Valid |
| P3 | 0.700 | 0.490 | 0.510 | Valid |
| P4 | 0.800 | 0.640 | 0.360 | Valid |
| P5 | 0.840 | 0.706 | 0.294 | Valid |
| P6 | 0.810 | 0.656 | 0.344 | Valid |
| P7 | 0.770 | 0.593 | 0.407 | Valid |
| P8 | 0.810 | 0.656 | 0.344 | Valid |
| P9 | 0.420 | 0.176 | 0.824 | Invalid |
| Total | 6.740 | 5.182 | 3.818 | |
| Construct Reliability (CR) | 0.922 | Reliable | ||
| Average Variance Extract (AVE) | 0.576 | |||
The CFA model for public services in Table 6 with nine indicators obtained eight valid indicators and one invalid indicator because it has a factor loading (λ) value of less than 0.5, namely the P9 indicator (Quality of the Complaint System). The reliability value shows that the public service variable with nine indicators is reliable because the CR value is greater than 0.7 (CR=0.922) and the AVE value is greater than 0.5 (AVE=0.576), but there are still invalid indicators. It is necessary to establish a new CFA model by eliminating invalid indicators. The results of the formation of the new CFA model are shown in Figure 2.

Figure 2 Estimation Results of Community Service CFA Model
Based on the results of forming the final CFA model on the public service variable by involving all valid indicators, the reliability value is seen based on the CR and AVE values. The indicator criteria in a variable are declared reliable if CR>0.7 and AVE>0.5. The magnitude of the factor loading value of each indicator on the public service variable is shown in Table 7.
| Table 7 Loading Factor Value and Final Public Service Model Reliability Value | ||||
| Indicator | Factor loading (λ) | Squared Factor loading (λ2) | Error(e) | Description |
| P1 | 0.740 | 0.548 | 0.452 | Valid |
| P2 | 0.750 | 0.563 | 0.438 | Valid |
| P3 | 0.670 | 0.449 | 0.551 | Valid |
| P4 | 0.800 | 0.640 | 0.360 | Valid |
| P5 | 0.850 | 0.723 | 0.278 | Valid |
| P6 | 0.830 | 0.689 | 0.311 | Valid |
| P7 | 0.790 | 0.624 | 0.376 | Valid |
| P8 | 0.820 | 0.672 | 0.328 | Valid |
| Total | 6.250 | 4.907 | 3.093 | |
| Construct Reliability (CR) | 0.927 | Reliable | ||
| Average Variance Extract (AVE) | 0.613 | |||
Based on Table 7, all indicators are valid because they have a factor loading (λ) value of more than 0.5. The reliability value shows that the public service variable with eight indicators is reliable because the CR value is greater than 0.7 (CR=0.927), and the AVE value is greater than 0.5 (AVE=0.613). This means that the indicators formulated in the measurement model of the public service variable are valid and reliable.
The compatibility test results on the public service model with the Goodness of Fit obtained results as shown in Table 8.
| Table 8 Goodness of Fit (GOF) Results of the Initial Community Service Model | ||||
| No | Criteria | Limit Value | Result | Conclusion |
| 1 | X2-chi-square, Significance probability | p-value ≥ 0.05 | 0.000 | Not Fit |
| 2 | GFI | >0.90 | 0.95 | Fit |
| 3 | AGFI | >0.90 | 0.91 | Fit |
| 4 | CFI | >0.95 | 0.99 | Fit |
| 5 | TLI or NFI | >0.95 | 0.98 | Fit |
| 6 | RMR | ≤ 0.10 | 0.02 | Fit |
| 7 | RMSEA | ≤ 0.08 | 0.08 | Fit |
In Table 8, it is evident that the CFA final model for public services has fulfilled almost all the statistical criteria for the goodness of fit (GOF) such as GFI, CFI, TLI, RMR, and RMSEA, except for Chi-Square. Small or insignificant chi-square values are difficult to meet, especially in large samples (Hair et al., 2021), but that does not mean the model is not suitable, for that it is recommended to use other fit criteria (Hair et al., 2021). As previously stated, a significant p-value does not mean the model is always bad because the p-value is influenced by a large number of samples. So that the final model of measuring public services has met the criteria of a good measurement model (fit) and can be used as a manifest for the variable construct of public services.
Based on Figure 2, Indicators of forming public services from the most influential to the least influential are service suitability, ability, responsibility, affordability, friendliness, simplicity of procedures, ease of requirements, and speed of service. Servqual analysis with Biplot is presented in Figure 3.

Figure 3 Cartesian Diagram of Service Attributes and Position at Each Service Place
Figure 3 shows that there are 4 quadrants indicating that Quadrant I is the primary service element that the organization has successfully implemented; it must be maintained. Quadrant II shows the factors or attributes that affect customer satisfaction, including service elements that are considered very important. However, management has not implemented them according to the community's wishes, so that they are disappointed or dissatisfied. Quadrant III shows several factors that have a less significant influence on the community, their implementation by mediocre organizations. Quadratic IV shows that the factors that influence the community are less essential, but the implementation is excessive.
Figure 3 shows that the three places have different service level positions. The level of service in the ER is in quadrant I, meaning that the level of community satisfaction with the services in the ER is considered to be very satisfactory, so the organization needs to maintain it. The attribute most perceived by the community related to service satisfaction in the ER is the speed of service, followed by the simplicity of the procedure and the affordability of costs. The quality of service at IU is strictly between quadrant II and III. This means that the quality of service received does not disappoint, and the organization does not perform ordinary services. The attribute that affects the quality of service at IU is the quality of the complaint system. Service quality at OU is in quadrant IV, meaning that the quality of service received by the community is less important, but the organization provides excessive service. The attributes expected to affect the quality of service at OU are Responsibility and Ability.
Based on the closeness of the attributes in Figure 3, it is apparent that almost all attributes are clustered in quadrant I or close to the ER. This suggested that almost all service attributes are highly expected. The organization also has operated well; thus, the services in the ER are satisfactory. The second group of attributes is clustered in quadrant IV, namely the responsibilities and abilities that according to the community, the expected service is normal, but the organization has provided services that exceed expectations. This means that the responsibility and service capability has been given to the community or outpatients that exceed expectations.
Judging by the location or distance of the service point with the zero point, it shows that the service is more varied. Based on the picture, it is evident that the farthest point is in the speed of service and responsibility, meaning that the two attributes have very diverse or heterogeneous variations based on the perceptions felt by the community. Meanwhile, the attribute closest to the zero point shows a relatively homogeneous perception, in this case, the friendliness and suitability of the service.
Conclusion
Based on the results of research and analysis, it was concluded that the level of community satisfaction with the services provided in the ER was considered very satisfactory. The attribute most perceived by the community related to service satisfaction in the ER is the speed of service, followed by the simplicity of the procedure and the affordability of costs. Almost all service attributes are highly expected, and the organization has performed, and hence the services in the ER have been satisfactory. This illustrates that the quality of service received does not disappoint, and the organization does not perform ordinary services. The attribute that affects the quality of service at IU is the quality of the complaint system. The quality of service received by the community is less important, but the organization provides excessive service. The attributes expected to affect the quality of service at OU are Responsibility and the Ability that the responsibility and service capability has been given to the community or outpatients in accordance with expectations.
References
Al-Omoush, K. S., Orero-Blat, M., & Ribeiro-Soriano, D. (2021). The role of sense of community in harnessing the wisdom of crowds and creating collaborative knowledge during the COVID-19 pandemic. Journal of Business Research, 132, 765-774.
Indexed at, Google Scholar, Cross Ref
Arfan, S., Mayarni, M., & Nasution, M.S. (2021). Responsivity of public services in Indonesia during the Covid-19 pandemic. Budapest International Research and Critics Institute-Journal (BIRCI-Journal), 4(1), 552-562.
Indexed at, Google Scholar, Cross Ref
Denhardt, J.V., & Denhardt, R.B. (2015). The new public service revisited. Public Administration Review, 75(5), 664-672.
Indexed at, Google Scholar, Cross Ref
Firdausijah, R.T., & Muliawaty, L. (2020). Ethics and public trust in post covid-19 public services. Prosiding ICoISSE, 1(1), 755-763.
Firmansyah, M.I., Rahmanto, F., & Setyawan, D. (2020). The preparedness for the COVID-19 pandemic management in Indonesia. Jurnal Administrasi Kesehatan Indonesia, 8(2), 1-9.
Indexed at, Google Scholar, Cross Ref
Guida, C., & Carpentieri, G. (2021). Quality of life in the urban environment and primary health services for the elderly during the Covid-19 pandemic: An application to the city of Milan (Italy). Cities, 110, 103038.
Indexed at, Google Scholar, Cross Ref
Hair, J., Hult, G.T.M., Ringle, C.M., & Sarstedt, M. (2021). A primer on partial least squares structural equation modeling (PLS-SEM). Sage publications.
Handayani, R.T., Kuntari, S., Darmayanti, A.T., Widiyanto, A., & Atmojo, J.T. (2020). Factors causing stress in health and community when the covid-19 pandemic. Jurnal Keperawatan Jiwa (JKJ): Persatuan Perawat Nasional Indonesia, 8(3), 353-360.
Indexed at, Google Scholar, Cross Ref
Hardiyansyah, H. (2018). Quality of public services: Concepts, dimensions, indicators and implementation. Gava Media.
Haryono, B.S., Sholihah, Q., Hidayati, F., Ahmadi, B., & Lenggono, K.A. (2021). The role of politics and policy strategy in facing a covid-19 pandemic: Case study in Indonesia. Review of International Geographical Education Online, 11(5), 1-9.
Indexed at, Google Scholar, Cross Ref
Kauzya, J.M., & Niland, E. (2020). The role of public service and public servants during the COVID-19 pandemic.
Indexed at, Google Scholar, Cross Ref
Kossasy, S.O., Jufri, Y., Monia, F.A., & Kosassy, S.M. (2021). Public services in the Covid-19 pandemic situation. In Proceeding the First International Conference on Government Education Management and Tourism, 1(1), 495-499).
Lubis, B. (2020). Implementation of Public service policies for making electronic KTPS in the adaptation of new habits (new normal). DEGRES, 19(2), 84-94.
Mahendradhata, Y., Andayani, N.L.P.E., Hasri, E.T., Arifi, M.D., Siahaan, R.G.M., Solikha, D.A., & Ali, P.B. (2021). The capacity of the Indonesian healthcare system to respond to COVID-19. Frontiers in Public Health, 9, 887.
Indexed at, Google Scholar, Cross Ref
Megatsari, H., Laksono, A.D., Ibad, M., Herwanto, Y.T., Sarweni, K.P., Geno, R.A.P., & Nugraheni, E. (2020). The community psychosocial burden during the COVID-19 pandemic in Indonesia. Heliyon, 6(10), e05136.
Indexed at, Google Scholar, Cross Ref
Mulianingsih, S. (2020). Public service management in the new habit adaptation era in Indonesia. Degres, 19(2), 105-115.
Noreen, N., Dil, S., Niazi, S., Naveed, I., Khan, N., Khan, F., & Kumar, D. (2020). COVID 19 pandemic & Pakistan; limitations and gaps. Global Biosecurity, 1(4).
Nugraha, B., Wahyuni, L.K., Laswati, H., Kusumastuti, P., Tulaar, A.B., & Gutenbrunner, C. (2020). COVID-19 pandemic in Indonesia: Situation and challenges of rehabilitation medicine in Indonesia. Acta Med Indones, 52, 299-305.
Purwanto, A., Asbari, M., Fahlevi, M., Mufid, A., Agistiawati, E., Cahyono, Y., & Suryani, P. (2020). Impact of work from home (WFH) on Indonesian teachers performance during the Covid-19 pandemic: An exploratory study. International Journal of Advanced Science and Technology, 29(5), 6235-6244.
Ramadhani, R., & Lubis, U.S. (2021). Opportunities and challenges for the Badan Pertanahan Nasional (BPN) in handling land cases in the new normal era. Legality: Jurnal Ilmiah Hukum, 29(1), 1-15.
Indexed at, Google Scholar, Cross Ref
Reynilda, R., Zainal, H., Rijal, S., Yusriadi, Y., & Tahir, S.Z.B. (2021). Licensing services in the era of the COVID-19 pandemic. In Proceedings of the 11th Annual International Conference on Industrial Engineering and Operations Management. Universitas Iqra Buru, 6322-6329.
Ruslina, E., & Sekarsari, R. (2020). Legal protection of medical staff in hospitals during the covid-19 pandemic era. International Journal of Latin Notary, 1(1), 29-35.
Setiawati, Y., Wahyuhadi, J., Joestandari, F., Maramis, M. M., & Atika, A. (2021). Anxiety and resilience of healthcare workers during COVID-19 pandemic in Indonesia. Journal of Multidisciplinary Healthcare, 14, 1.
Indexed at, Google Scholar, Cross Ref
Sugiyono, S. (2015). Combination research method. Alfabeta, Bandung.
Sundararaman, T. (2020). Health systems preparedness for COVID-19 pandemic. Indian Journal of Public Health, 64(6), 91.
Susilo, D., Hidayat, E., & Marta, R.F. (2021). Village public innovations during COVID19 pandemic in rural areas: Phenomena in Madura, Indonesia. Cogent Social Sciences, 7(1), 1905919.
Indexed at, Google Scholar, Cross Ref
Taufik, T., & Hardi, W. (2020). A new bureaucracy for the new normal: A review of the model of bureaucratic change in public services in the COVID-19 era. Dialogue Jurnal Ilmu Administrasi Publik, 2(1), 1-18.
Wiryanto, W. (2020). Population Administration Service Innovation in Indonesia during the Covid-19 Pandemic. In Iapa Proceedings Conference, 512-523.
Indexed at, Google Scholar, Cross Ref
Received: 26-Nov-2021, Manuscript No. JLERI-21-10417; Editor assigned: 28-Nov-2021, PreQC No. JLERI-21-10417(PQ); Reviewed: 12-Dec-2021, QC No. JLERI-21-10417; Revised: 28-Jan-2022, Manuscript No. JLERI-21-10417(R); Published: 04-Feb-2022