Research Article: 2018 Vol: 17 Issue: 6
Consumer Acceptance of Trustworthy E-commerce: An Extension of Technology Acceptance Model
Muhammad Dharma Tuah Putra Nasution,Universitas Pembangunan Panca Budi
Adi Anuar Azmin,Universiti Malaysia Perlis
Abstract
The purpose of this study is to examine the influence of Perceived Ease of Use (PEOU) on Trustworthy E-commerce (TE) with Perceived Usefulness (PU) as mediation variable for users of Booking.com service. The type of study includes the causal research. Based on the level of explanation, this study explains the position of the variables studied and the influence of one variable with other variables. The present study uses non-probability sampling. The sample is determined using the purposive sampling technique that placed the individual according to specific characteristics. The number of samples in this study that fit the criteria is 105 respondents. Data collection using questionnaires with 5-points Likert Scale. This study used path analysis that supported by SPSS version 19.0 and LISREL version 9.2. The results of the study found a direct influence of Perceived Ease of Use (PEOU) on Trustworthy (TE) is a higher value than the direct influence of Perceived Ease of Use (PEOU) on Perceived Usefulness (PU). Furthermore, Perceived Ease of Use (PEOU) of Trustworthy (TE) mediated by Perceived Usefulness (PU) is lower than the direct influence of Perceived Ease of Use (PEOU) on Trustworthy (TE). Indonesian consumer perceived ease of use and perceived usefulness to adopt mobile technology, which is an enormous potential for increasing traffic on travel agent services sites such as booking.com. Technology has become a part of daily life of consumers who are equipped with various digital innovations from e-commerce companies that provide services. Thus requires a new way of interaction that is built on trust and transparency of information. Consumers are not only users of products and services, but they have the role of providing information, reviews, and ratings to products and services offered by e-commerce companies.
Keywords
TAM, Perceived Usefulness, Perceived Ease of Use, Trustworthy, E-commerce.
Introduction
Information technology is growing especially in electronic transactions that are accessed via the internet. According to data published by Internet World Stats (2017), internet service users in Indonesia has reached the number of 132.7 million people and ranked fifth as country internet users in the world. This case indicates that there has been a change in community interaction that includes business, economic, social and cultural interactions. The development of the internet that has been more advanced has made the Internet as a medium in transactions. It is marked by the emergence of online transactions that have become a necessity for Internet users and business people.
One of the apparent forms we know from e-commerce is the hotel booking service provider that is called Booking.com. Booking activities can be done unlimited by using the available applications. A person who is located in one of the countries can make an easy booking of hotels, tickets and other facilities in other countries.
A model to measure consumer or user perceptions of the benefits and ease of use of a technology known as Technology Acceptance Model (TAM). According to Davis et al. (1989), the Technology Acceptance Model can find out how users adopt new information systems in business activity. In this case, the role of technology users is determined by two perceptions, namely Perceived Usefulness and Perceived Ease of Use. Perceived Usefulness has a direct impact on the purpose of adopting the technology, while Perceived Ease of Use has a direct or indirect impact on the purpose of adoption through Perceived Usefulness (Davis, 1989).
Consumers who use online transaction services on e-commerce have different perceptions, especially those related to trust and risk levels. Research by Benedicktus & Andrews (2006) reveals that in order to gain consumer trust, e-commerce companies are needed to maintain the company's reputation. Companies that can be trusted by consumers will encourage consumer desires to transact on the company's services. Previous research states that the important factors that companies need to build relationships with consumers are trust factors (Hart & Johnson, 1999)
Thus, trust can influence consumers' attitudes and behavioral interests to transact on ecommerce services. Other scholars also state that trust is a function of a level of risk in the context of an electronic transaction (Yousafzai et al., 2003). Factors that shape consumer confidence to use transaction services on e-commerce include information accuracy, security, and privacy. In this condition, it becomes the basis for consumers that transaction services on ecommerce as a reliable media.
In the present study, the authors attempt to develop the concept of Technology Acceptance Model TAM. included Trustworthy variable as antecedents of Attitude Toward Using (ATU) in online transactions on the Booking.com website. Based on the exposure mentioned above, the authors propose a topic entitled Consumer Acceptance of Trustworthy ECommerce: An Extension of Technology Acceptance Model.
Literature Review
Technology Acceptance Model (TAM)
Technology Acceptance Model (TAM) is adopted from the TRA (Theory of Reasoned Action) model. Theory of Reasoned Actionis a theory of action grounded in one premise that one's reactions and perceptions of one thing will determine the person's attitude and behavior (Ajzen & Fishbein, 1980). Reactions and perceptions of users of Information Technology will affect his attitude in acceptance of the technology. TAM, developed from psychological theory, explains the behavior of computer users that is based on belief, attitude, intention, and user behavior relationship (Venkatesh & Davis, 2000).
The purpose of this model is to explain the main factors of user behavior in the acceptance of technology users. In more detail explain the acceptance of Information Technology with specific dimensions that may affect the user to receive Technology. Technology Acceptance Model (TAM) developed by Davis, (1989) assumes that one's acceptance of information technology is influenced by two primary variables: Perceived Ease of Use (PEOU) and Perceived Usefulness (PU). Attitude Toward Using in TAM is conceptualized as attitudes toward the use of systems in the form of acceptance or rejection as an impact when a person uses technology in its activities. Behavioral Intention to Use is the tendency of individual behavior to keep using a technology (Davis, 1989).
Perceived Ease of Use
The convenience factor is the degree to which one believes that the use of information systems is easy and requires no endeavor from the wearer to do so (Adams et al., 1992). It means there is individual trust that the technology is easy to use (Jarvenpaa et al., 2000). Indications that technology is easy to use can be seen from the intensity of use and interaction between users with technology systems (Gefen & Straub, 2004). The more frequently used systems show that the system is better known and more accessible for users to operate.This Perceived Ease of Use (PEOU) construct is confidence in determining one's attitude to receiving new information technology (Venkatesh & Davis, 2000). Ease of Use will streamline one's time and energy to learn a system. Users believe that information technology is more flexible, easy to understand, and easy to operate a characteristic of Ease of Use (Adams et al., 1992).
Davis (1989) provides indicators of Ease of Use of information technology, among others: (1) The system is easier to learn; (2) The system can do easily what the user wants; (3) User skills will increase by using the system ; (4) The system is easier to operate. Perceived Ease of Use (PEOU) influences individual attitudes toward the use of technology. The increase in Perceived Ease of Use instrumental influences the increase of Perceived Usefulness (PU) This is because an easy-to-use system does not take long to be learned so that individuals have the opportunity to work on something that is related to performance effectiveness (Lam et al., 2007). Perceived Ease of Use (PEOU) also affects Perceived Usefulness means a system related to the productivity and effectiveness of a system of usability in the overall task to improve the performance of a person using the system (Adams et al., 1992).
Perceived Ease of Use measures the perceived assessment of ease of use and ease of learning from users of information technology. The results of prior studies support the findings of Perceived Ease of Use affecting Perceived Usefulness. In their studies, Venkatesh & Davis (2000) identified the importance of experience and the complexity of using technology that would impact perceived useful.
Perceived Usefulness
Perceived Usefulness is defined as a level where one believes that using technology will improve performance (Davis et al., 1989). Other scholars expressed the benefits felt by users of information technology in activities and jobs indicate the benefits of information technology (Huh et al., 2009). Measurement of benefits is based on the frequency of use and diversity of applications operated.
User perceptions of the benefits of technology are expressed by (Davis et al., 1989) with the following measures: (1) Using technology can improve user productivity; (2) Using technology can improve user performance; (3) Using technology can improve the efficiency of user processes. In general users technology will have a positive perception of the technology provided.
On the other hand, a negative perception will arise after the user tries the technology in question or the user has a negative experience in the use of available technology. Technology Acceptance Model is used as a basis to determine the effort that needs to be done to encourage one's intention to use technology (Venkatesh & Davis, 2000). In the study by Davis et al. (1989) express a person's attitude toward the use of technology due to the perceived usefulness of technology.
E-Commerce
E-commerce is a dynamic set of technologies, applications, and business processes that connect specific companies, consumers, and communities through electronic transactions and trade in goods, services, and information electronically (Fingar et al., 2000). The other definition proposed e-commerce is a new concept that describes the process of buying and selling transactions or exchange of products, services, and information through the Internet network (Gefen & Straub, 2004).
The types of e-commerce submitted by Fingar et al. (2000) are divided into several levels: (1) Business to Business (B2B). The transaction is between one company and another in the electronic market; (2) Business to Customer (B2C). The transaction is made by an individual buyer with the company and is often referred to as a retail transaction; (3) Customer to Customer (C2C). Sales transactions are made directly to other consumers via the internet or electronic advertising; (4) Customer to Business (C2B). Transactions in this category are individuals who process transactions with social or nonprofit organizations; (5) Non-business E-commerce. These include non-business organizations and government agencies that use different types of ecommerce to reduce costs, improve performance and public services; (6) Intrabusiness. Organizations use e-commerce to improve organizational operations, known as Business-to- Employee (B2E).
Trustworthy
Trust is critical to organize complexity, to develop action capacity, enhances collaboration and enhances organizational learning abilities (Mayer et al., 1995). The primary key to building high trust in organizations is achieving results, acting in integrity, and demonstrating attention (Kim et al., 2008). Increasing the level of trust requires a balance of the critical points mentioned above, although there is a conflict between the parties within the organization. Balancing actions require the organizational design that can support trust, organizational structure and informal culture. For the e-commerce context, trust as a pattern of firm belief in other companies that will provide a positive outcome for the company (Gefen & Straub, 2004). Furthermore, trust as a form of statement between the two parties involved in the relationship (Jarvenpaa et al., 2000). One party is considered to play a role in controlling asset while the other party considers sharing the use of these resources in a bond will be beneficial. First-party beliefs on the part of others will lead to interactive behaviors that strengthen relationships and support sustain those relationships. Such behavior will increase the length of the relationship by strengthening commitment in a relationship. Trust will be a valuable element in creating a successful relationship (Doney & Cannon, 1997). The trust also reduces the risk of partnering and building long-term relationships and increasing commitment in relation (Kim et al., 2008). Based on the prior studies, the authors proposed the hypotheses development as follows:
H1: There is the influence of Perceived Ease of Use on Trustworthy E-Commerce.
H2: There is the influence of Perceived Usefulness on Trustworthy E-Commerce.
H3: There is the influence of Perceived Ease of Use on Perceived Usefulness.
H4: There is the influence of Perceived Ease of Use on Trustworthy E-Commerce that is mediated by Perceived Usefulness.
Research Method
Research Type
The present study aims to obtain the facts from the symptoms and to find the factual information or type of causal research. Based on the level of explanation, this research explains the position of the variables studied and the influence of one variable with other variables.
Sampling Technique
Sampling technique used to select samples from a population in this study is nonprobability sampling. Non-probability sampling intended that the magnitude of the opportunity for members in the population that will choose as samples not be known. Through this purposive sampling technique the researcher will determine the characteristics of the relevant population and place the individual according to several characteristics that required. The number of suitable samples was 105 respondents. To accomplish this goal, it is necessary to use appropriate and accurate methods. In this research, data collection method questionnaires with five points Likert scale. The Likert scale contains the statements between strongly agree and strongly disagree with an object.
Validity Test
The validity of the measuring instrument is the extent to which the confidence in the conclusions of the study depends on the accuracy of the data obtained. Measuring instruments can be stated to have the high validity if the measuring instruments generate data relevant to the purpose of measurement. The validity used in this study is face validity and content validity.
Reliability Test
The reliability test used in this study is an internal consistency approach that requires only one single test in one group of individuals, and the operation of data using SPSS 19.0 for Windows.
Data Analysis Method
Data analysis method used in this research is as follows.
Descriptive Analysis is to describe the subject of research based on the data obtained.
Inferential Analysis is intended to conclude by testing hypotheses. The inferential analysis in this research is simple path analysis. Simple Path analysis is an extension of the regression model commonly used to test the magnitude of matrix correlation matches against two or more causal models compared by the researchers. The descriptive data analysis and inferential data analysis using SPSS version 19.0 and LISREL version 9.2.
Results
Validity Test (Tables 1-3)
| Table 1 Results Of Validity Test Perceived Ease Of Use (r-table N=30; 0.323) |
|||||
| Item Statement |
Corrected Item-Total Correlation | Result | Item Statement |
Corrected Item-Total Correlation | Result |
| 1 | 0.401 | Valid | 15 | 0.509 | Valid |
| 2 | 0.517 | Valid | 16 | 0.660 | Valid |
| 3 | 0.482 | Valid | 17 | 0.756 | Valid |
| 4 | 0.601 | Valid | 18 | 0.621 | Valid |
| 5 | 0.584 | Valid | 19 | 0.581 | Valid |
| 6 | 0.411 | Valid | 20 | 0.452 | Valid |
| 7 | 0.665 | Valid | 21 | 0.498 | Valid |
| 8 | 0.653 | Valid | 22 | 0.767 | Valid |
| 9 | 0.454 | Valid | 23 | 0.705 | Valid |
| 10 | 0.426 | Valid | 24 | 0.853 | Valid |
| 11 | 0.637 | Valid | 25 | 0.498 | Valid |
| 12 | 0.404 | Valid | 26 | 0.547 | Valid |
| 13 | 0.531 | Valid | 27 | 0.653 | Valid |
| 14 | 0.521 | Valid | 28 | 0.564 | Valid |
| Table 2 Results Of Validity Test Perceived Usefulness (r-table N=30; 0.323) |
|||||
| Item Statement |
Corrected Item-Total Correlation | Result | Item Statement |
Corrected Item-Total Correlation | Result |
| 1 | 0.563 | Valid | 13 | 0.692 | Valid |
| 2 | 0.447 | Valid | 14 | 0.602 | Valid |
| 3 | 0.421 | Valid | 15 | 0.579 | Valid |
| 4 | 0.438 | Valid | 16 | 0.757 | Valid |
| 5 | 0.434 | Valid | 17 | 0.665 | Valid |
| 6 | 0.459 | Valid | 18 | 0.562 | Valid |
| 7 | 0.631 | Valid | 19 | 0.709 | Valid |
| 8 | 0.573 | Valid | 20 | 0.541 | Valid |
| 9 | 0.753 | Valid | 21 | 0.527 | Valid |
| 10 | 0.424 | Valid | 22 | 0.425 | Valid |
| 11 | 0.411 | Valid | 23 | 0.452 | Valid |
| 12 | 0.563 | Valid | |||
| Table 3 Results Of Validity Test Trustworthy E-Commerce (r-table N=30; 0.323) |
|||||
| Item Statement |
Corrected Item-Total Correlation | Result | Item Statement |
Corrected Item-Total Correlation | Result |
| 1 | 0.578 | Valid | 8 | 0.477 | Valid |
| 2 | 0.517 | Valid | 9 | 0.443 | Valid |
| 3 | 0.595 | Valid | 10 | 0.632 | Valid |
| 4 | 0.538 | Valid | 11 | 0.571 | Valid |
| 5 | 0.416 | Valid | 12 | 0.445 | Valid |
| 6 | 0.495 | Valid | 13 | 0.546 | Valid |
| 7 | 0.502 | Valid | 14 | 0.497 | Valid |
Reliablity Test (Table 4)
| Table 4 Results Of Reliability Test |
||
| Variables | Cronbach's Alpha | N of Items |
| Perceived Ease of Use (PEOU) | 0.883 | 40 |
| Perceived Usefulness (PU) | 0.844 | 40 |
| Trustworthy E-Commerce (TE) | 0.708 | 40 |
Normality Test
Based on the above-mentioned Kolmogorov-Smirnov (Table 5), the Perceived Value of Use (PEOU), Perceived Usefulness (PU), and Trustworthy (TE) values for PEOU is 0.607; PU is 0.475; TE is 0.314. The values of variables are higher than Sig.>0.05. It means that the data normally distributed.
| Table 5 One- Sample Kolmogorov-Smirnov Test |
||||
| (PEOU) | (PU) | (TE) | ||
| N | 105 | 105 | 105 | |
| Normal Parametersa,b | Mean | 88.62 | 72.90 | 29.75 |
| Std. Deviation | 11.498 | 7.876 | 4.793 | |
| Most Extreme Differences | Absolute | 0.074 | 0.082 | 0.094 |
| Positive | 0.051 | 0.082 | 0.071 | |
| Negative | -0.074 | -0.053 | -0.094 | |
| Kolmogorov-Smirnov Z | 0.762 | 0.844 | 0.961 | |
| Asymp. Sig. (2-tailed) | 0.607 | 0.475 | 0.314 | |
| a. Test distribution is Normal | ||||
| b. Calculated from data | ||||
Linearity Test
The linearity test is performed to assume that the relationship in the statistical model in this study is either linear or otherwise. If the statistical model shows a non-linear relationship, it will limit generalizations to the population. The linearity test can be presented by considering the significance value of F (F-Linearity and F-Deviation from Linearity) in ANOVA table. The model show linearly if p<0.05 on F-Linearity; and p>0.05 on F-Deviation from Linearity.
Based on Table 6, it presents that the significance of F-Linearity of Perceived Ease of Use to Trustworthy is 0.00 and F-Deviation from Linearity is 0.281. The Table 7 present that the significance of F-Linearity of Perceived Usefulness to Trustworthy is 0.00 and F-Deviation from Linearity is 0.099. It means that there is a relationship between Perceived Ease of Use and Perceived Usefulness to Trustworthy in linear.
| Table 6 Linearity Test Of Peou-Anova |
|||||
| Sum of Squares | df | Mean Square | F | Sig. | |
| Trustworthy Between (Combined) | 1748.612 | 39 | 44.836 | 4.547 | 0.000 |
| Perceived Ease of Use Groups Linearity Deviation from Linearity Within Groups Total |
|||||
| Linearity | 1308.872 | 1 | 1308.872 | 132.735 | 0.000 |
| Deviation from Linearity | 439.740 | 38 | 11.572 | 1.174 | 0.281 |
| Within Groups | 640.950 | 65 | 9.861 | ||
| Total | 2389.562 | 104 | |||
| Table 7 Linearity Test Of Pu-Anova |
|||||
| Sum of Squares | df | Mean Square | F | Sig. | |
| Trustworthy Between (Combined) Perceived Usefulness Groups Linearity | 1718.071 | 33 | 52.063 | 5.505 | 0.000 |
| Perceived Usefulness Groups | |||||
| Linearity | 1279.589 | 1 | 1279.589 | 135.297 | 0.000 |
| Deviation from Linearity | 438.482 | 32 | 13.703 | 1.449 | 0.099 |
| Within Groups | 671.490 | 71 | 9.458 | ||
| Total | 2389.562 | 104 | |||
Descriptive Statistics
Descriptive statistics contain information about the average predicted value of Trustworthy, Perceived Ease of Use, and Perceived Usefulness variables. The average of Trustworthy's predictions is 29.75; Perceived Ease of Use is 88.62, and Perceived Usefulness is 72.90 as shown in Table 8.
| Table 8 Results Of Descriptive Statistics |
|
| Mean | |
| Perceived Ease of Use (PEOU) | 88.62 |
| Perceived Usefulness (PU) | 72.90 |
| Trustworthy (TE) | 29.75 |
Covariance Matrix
The value of covariance resulting from the data in this study between Perceived Usefulness variables and Trustworthy is equal to 27.628, Perceived Usefulness variable with Perceived Ease of Use is equal to 64.710, and Trustworthy variable with Perceived Ease of Use is equal to 40.789 (Table 9). The positive covariant values of Perceived Usefulness, Trustworthy and Perceived Ease of Use indicate the positive linear relationship of variables.
| Table 9 Covariance Matrix |
|||
| Perceived Usefulness (PU) | Trustworthy E-Commerce (TE) |
Perceived Ease of Use (PEOU) | |
| Perceived Usefulness (PU) | 62.037 | - | - |
| Trustworthy (TE) | 27.628 | 22.977 | - |
| Perceived Ease of Use (PEOU) | 64.710 | 40.789 | 132.200 |
Reduced Form Equations
Matrix of Reducted Form of Equation is as follows:
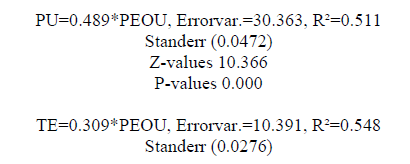
The equation reveals the estimation result of the regression coefficient consisting of estimation parameter, standard error, and t-value or z value. The t-table value in this study was 1.96 (df=103, α=0.05). Based on the test results, Perceived Ease of Use affect Perceived Usefulness, and the value of regression coefficient is 0.489; standard error of 0.0472; the t-count value of 10.366. The results test indicate that Perceived Ease of Use has a significant effect on Perceived Usefulness.
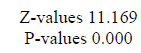
Furthermore, Perceived Ease of Use and Perceived Usefulness affect simultaneously on Trustworthy E-Commerce. Regression coefficient value is 0.309, with a standard error of 0.0276; and t-count value is 11.169. The results test indicate Perceived Ease of Use, and Perceived Usefulness affect Trustworthy E-Commerce. Based on the result of reduced form equations above, variance error score which is obtained by Perceived Usefulness is 30.36 and Trustworthy is 10.391.
The variance error scores of endogenous variables have positive values. The coefficient of determination means how much variation of the Trustworthy can be explained by Perceived Ease of Use and Perceived Usefulness. The results test show that the value of R Square (R2) of the Trustworthy is 0.548 or equal to 54.8%. It means the influence of Perceived Ease of Use on Trustworthy with Perceived Usefulness as mediation variables is 54.8%, while 45.2% influenced by other factors from the outside of this study.
Standardized Solution
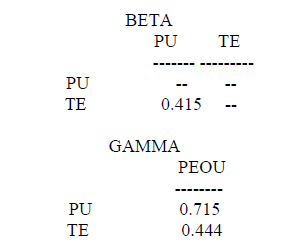
Based on the test result, the value of path coefficient of Perceived Usefulness (PU) on Trustworthy (TE) is 0.415. The path coefficient value of the Perceived Ease of Use (PEOU) on Perceived Usefulness (PU) is 0.715, and the path coefficient of Perceived Ease of Use (PEOU) on the Trustworthy (TE) is 0.444.
Standardized Total and Indirect Effects
Standardized Total and Indirect Effects Standardized Total Effects of X on Y
Standardized Indirect Effects of X on Y
Standardized Total Effects of YonY
DISCUSSION
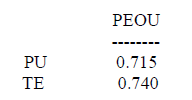
The direct and indirect effects of the standard contain information on the difference of influence between Perceived Ease of Use (PEOU), Perceived Usefulness (PU) and Trustworthy (TE). Based on the coefficient value of direct Perceived Ease of Use (PEOU) and Perceived Usefulness (PU) on Standardized Total Effects of X on Y is 0.715.
The direct effect of Perceived Ease of Use (PEOU) on Trustworthy (TE) is 0.74. The result indicates that the direct effect of perceived effects of use (PEOU) on trustworthy (TE) is higher than the direct effect of perceived use of (PEOU) to Perceived Usefulness (PU) or (0.740>0.715).
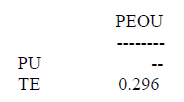
The indirect coefficient of effect of perceived effects of use (PEOU) to trustworthy (TE) is 0.296. The result indicates that the effect of perceived Ease of Use (PEOU) on Trustworthy (TE) which is mediated by Perceived Usefulness (PU) is lower than the direct effect of perceived use on Trustworthy (TE) or (0.296<0.74).
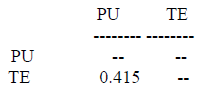
The total effect of Perceived Usefulness (PU) to Trustworthy (TE) is 0.415. The hypothesis result test shows that the effect of use effect on Trustworthiness (TE) that is mediated by Perceived Use is (PU) is acceptable.
The momentum of transaction volatility in the development of Indonesian e-commerce is increasingly attractive with the presence of online travel agent service players that are increasingly competitive. Even so, winning the Indonesian market is not easy, there are many challenges that must be faced by e-commerce players today. Starting from internet access and speed, geographical and typographical problems, payment methods and generate Indonesian consumer confidence.
The aggregator site namely “iPrice” is reported by collecting data on more than one thousand e-commerce in Southeast Asia. The research findings are related to Indonesian consumer behavior in online transactions. One of their findings is related to smartphone usage that has increased each year. It is in line with increasing mobile traffic to online sites. It is indicated that 87% of their traffic came from mobile usage. This is an Indonesian consumer perceived ease of use and perceived usefulness to adopt mobile technology, which is an enormous potential for increasing traffic or higher traffic on travel agent services sites such as booking.com. Technology has become a part of daily life of consumers who are equipped with various digital innovations from e-commerce companies that provide services. Thus requires a new way of interaction that is built on trust and transparency of information. Consumers are not only users of products and services, but they have the role of providing information, reviews, and ratings to products and services offered by e-commerce companies.
Conclusion
The purpose of this study is to examine the influence of Perceived Ease of Use (PEOU) to Trustworthy (TE) with Perceived Usefulness (PU) as mediation variable for users of Booking.com service. Overall the study found several highlights can be formulated in the following conclusions. First, there is a significant influence of Perceived Ease of Use (PEOU) on Trustworthy (TE) is proven. Second, there is a significant influence of Perceived Usefulness (PU) on Trustworthy (TE) is proven. Third, there is a significant influence of Perceived Ease of Use (PEOU) on Perceived Usefulness (PU) is proven. Fourth, there is the influence of Perceived Ease of Use on Trustworthy E-Commerce that is mediated by Perceived Usefulness is proven.
Some implications of the findings will need to be considered as follows:
There are offers that advise consumers for certain rooms with the best reviews, in fact consumers prove a bad experience. Although this is not for all consumers who have similar experiences. Likewise with content marketing that tends to urge consumers, such as messages that warn them to immediately buy accommodation with the best deals.
Certain recommendations and ratings in the website list do not necessarily indicate the facts on the field and according to the consumer experience. Different reviews from visitors raise doubts about information for consumers and that may delay consumers' desire to choose the expected hotel. The tendency of disinformation over the best price offer is actually the price offered by offline hotels is cheaper or has similar prices. It might even be possible for consumers to actually pay more than they need for the room ordered.
Furthermore, the number of available rooms often results in actual misinformation. For example, the room offered is only 1 room left. This case can have an impact on the minds of consumers that the rooms that are expected to have many enthusiasts. Other information that is not accurately disclosed such as other additional costs per room for travelers. information about pictures of hotels and rooms that are not in accordance with the reality tend to make consumers impressed this is a trap. This fact should be evaluated by a hotel booking service site such as booking.com
Acknowledgments
The authors gratefully acknowledge the support from Universitas Pembangunan Panca Budi, and we would like to thank the anonymous reviewers for their comment on this article.
References
- Adams, D.A., Nelson, R.R., & Todd, P.A. (1992). Perceived usefulness, ease of use, and usage of information technology: A replication. MIS Quarterly, 16(2), 227.
- Ajzen, I., & Fishbein, M. (1980). Understanding attitudes and predicting social behavior. Prentice-Hall.
- Benedicktus, R.L., & Andrews, M.L. (2006). Building trust with consensus information?: The effects of valence and sequence direction. Journal of Interactive Advertising, 6, 3-25.
- Davis, F.D. (1989). Perceived usefulness, perceived ease of use, and user acceptance of information technology. MIS Quarterly, 13(3), 319.
- Davis, F.D., Bagozzi, R.P., & Warshaw, P.R. (1989). User acceptance of computer technology: A comparison of two theoretical models. Management Science, 35(8), 982-1003.
- Doney, M., & Cannon, J.P. (1997). Trust examination of the nature of in buyer-seller relationship for assistance. Journal of Marketing, 61(2), 35-51.
- Fingar, P., Kumar, H., & Sharma, T. (2000). Enterprise e-commerce. Meghan-Kiffer Press.
- Gefen, D., & Straub, D.W. (2004). Consumer trust in B2C e-Commerce and the importance of social presence: Experiments in e-Products and e-Services. Omega, 32(6), 407-424.
- Hart, C.W., & Johnson, M.D. (1999). Growing the trust relationship. Marketing Management, 8(1), 8-19. Retrieved from http://search.ebscohost.com/login.aspx?direct=true&db=buh&AN=1755091&site=ehost-live
- Huh, H.J., Kim, T., & Law, R. (2009). A comparison of competing theoretical models for understanding acceptance behavior of information systems in upscale hotels. International Journal of Hospitality Management, 28(1), 121-134.
- Jarvenpaa, S.L., Tractinsky, N., & Vitale, M. (2000). Consumer trust in an internet store. Information Technology and Management, 1(1-2), 45-71.
- Kim, D.J., Ferrin, D.L., & Rao, H.R. (2008). A trust-based consumer decision-making model in electronic commerce: The role of trust, perceived risk, and their antecedents. Decision Support Systems, 44(2), 544-564.
- Lam, T., Cho, V., & Qu, H. (2007). A study of hotel employee behavioral intentions towards adoption of information technology. International Journal of Hospitality Management, 26(1), 49-65.
- Mayer, R.C., Davis, J.H., & Schoorman, F.D. (1995). Model of Trust. Academy of Management, 20(3), 709-734.
- Retrieved from https://iprice.co.id/
- Retrieved from http://marketeers.com/
- Retrieved from https://www.booking.com/
- Suh, B., & Han, I. (2002). Effect of trust on customer acceptance of Internet banking. Electronic Commerce Research and Applications, 1(3-4), 247-263.
- Venkatesh, V., & Davis, F.D. (2000). Studies Linked references are available on JSTOR for this article?: A theoretical extension of the technology acceptance model. Four Longitudinal Field Studies, 46(2), 186-204.
- Yousafzai, S.Y., Pallister, J.G., & Foxall, G.R. (2003). A proposed model of e-trust for electronic banking. Technovation, 23(11), 847-860.