Research Article: 2019 Vol: 18 Issue: 1
Design and Implementation of Strategic Agility Evaluation Model with Structural Equation Modelling Approach
Atefeh Asil, Nasser Fegh-Hi Farahmand
Abstract
Purpose: One of the duties of managers facing environmental uncertainty is to understand the important events and their changes and how they affect organizations. Agility enables organizations to provide their survival in such environments with quick, innovative, and creative responses. Agility requires rapid changes in the structure and configuration of the company, which can be implemented in various activities such as strategy. This research aimed to identify and develop a model for the assessment of strategic agility of companies based in growth centers with a modelling approach.
Methodology/Approach: The research method is applied to collect data from a descriptive survey type and the statistical society includes all newly established companies located in Tabriz city centers (10 centers) and simple sampling method, and a sample of 155 companies. The opinions of selected companies about the indicators and their relationship were gathered through a researcher-made questionnaire. Validity and reliability of the questionnaire were confirmed using relevant tests. Structural equation modelling has been used for data analysis and structural modelling.
Findings: The findings showed that six factors were the most influential factors affecting the assessment of strategic agility of these companies. These factors (in order of importance) included: developing a prospect on the basis of customer knowledge, developing strategic goals based on the commitment and accountability of members, identifying partners and understanding environmental changes, fluency of resources based on the strategic mission, change management along with unity in leadership and finally strategic planning along with delegation of authority. Then, based on identified factors, the status gap with the desired situation in these companies was evaluated.
Research Limitation/implication: Apart from these factors, regional and global environmental factors may also affect the strategic agility of companies that need to be addressed.
Originality/Value of paper: So far, research has not been conducted specifically for newly established companies in the field of strategic agility. The newly established companies are important for economies in terms of economics and employment. A strategic misfortune can help these companies survive.
Keywords
Strategic Agility, Growth Centers, Newly Established Companies.
Introduction
Newly established technology-based companies are a classic form of innovative organizations that can act as ideal structures and can respond to environmental changes quickly. Innovative companies are the main source of advancement in the arena of product technology and innovation. Rapid growth, operating in global markets, high added value, creating quality jobs, innovation, rapid adaptability, technology diffusion, establishment of large future corporations and high internal rate of return are some of the advantages of these companies (Eurpean Communities, 2002).
Behaviors of small and newly-founded companies are different from the behavior of large companies. Entrepreneurship activities in these firms depend on the imagination, creativity and using the opportunities of these organizations’ founders and their attitude, not by planned procedures or support of organizational systems. Even managers in some of these firms imagine that there is no need to regulate the ideas, planning, organizing and controlling the processes, and therefore, flexibility depends upon the cognitive and mental models of people without using foreign consulters. Implementing entrepreneurship behaviors and using opportunities are not yet embedded in the instructions and procedures of the company (Zhang, 2011). Attitudes, mental norms, beliefs of people about risk-taking, conducting preventive measures and participation in initiatives of the founder play an essential role in determining the strategy of the company (Lubatkin et al., 2006; Kraus & Kauranen, 2009). However, these types of companies enjoy the rapid growth, high added-value, creating high quality jobs, creating large companies in the future, helping the expansion of technologies, and rapid adaptability.
Because one reason for establishing small and medium enterprises is the ease of establishment without need to certain management information, lack of suitable strategic planning based on the weaknesses, strengths, opportunities and threats is one of the major caused of failure for newly-established companies (Lambropoulos, 2005). In most of these companies, people do their routine daily work and they do not believe that they are applying strategic management.
The common mistake is that market is ignored in creating new ideas and there is no correct evaluation of the target market for the new products or services (Kraus & Kauranen, 2009). Deployment of the newly-established and small companies in the center of growth is one of the government supportive measures for these companies. But these companies have some problems in identifying and determining the required assistance and it seems that in addition to lack of the strategic thinking, this is caused by the complexity of organization challenges encountered by them (Beidokhti & Zargar, 2012). The expansion and complexity of the competition, caused by governing phenomena like shorter life-cycle of products, increase in the diversity of customers' needs, and rapid growth of technology, have interested many researchers to the necessity of being aligned with the environment. Various studies show that the failure reason of some companies is inattention to the changes in the dynamic environment and lack of suitable strategic plans for conditions which leads to not providing the right product in the right time for the right customer, and it creates another problem for an organization (Zaridis & Mousiolis, 2014). This category relates to the strategic agility according to the definition of Roth (1996) and Long (2000). In such conditions, empowerment of newly-founded organizations for rapid and accurate adaptability with the changing conditions is a key factor for effective survival and success in the future. This capacity depends on the strategic agility (Horney et al., 2010, Adeleye & Yusuf, 2006). In other words, the company shall have the ability to provide right products and services in a right place, right time, right cost, for right customers (Long, 2000).
In short, we can say that the newly established small firms are different from large companies. In the newly established small companies, most of the activities of the organization are based on the basic patterns of the owners of these companies. The business plan presented to the growth centers is not constantly monitored and market changes are not constantly monitored. There is no flow of fluid. Due to the increase of environmental changes and field studies, organizational agility in these organizations is unknown. So far, no research has been conducted on the strategic agility of newly established companies. The study seeks to identify effective indicators of the strategic agility of newly established companies and assess the status of these companies based on these factors and suggests that there are solutions to resolve the existing gap. Now the main question is that what are the dimensions and indicators of strategic agility in the newly-established organizations in the growth centers?
Previous research have shown that the agility leads to obtaining and maintaining the competitive advantage, a capacity which is a key competence in the rapidly changing environment. In a complex and rapidly changing environment, organizations need to move proportionally with the environmental changes, and produce their products based on the demands of the customers or create a new demand in the customers. This capacity depends on the strategic agility (Horney, 2012). Most research about the strategic agility were focused on the small, medium, and large enterprises which have sold their products. There is no specific research about the strategic agility. The main purpose of this research is determining effective factors on the strategic agility in the newly-established companies in the growth center. Regarding the research, three approaches have been presented for the strategic agility including strategy as a structured chaos (Brown & Eisenhardt, 1998), renewal and strategic improvement (Hamel & Valikangas, 2003; Hamel, 2012), strategic sensitivity, collective commitment, fluidity of the resources (Doz & Kosonen, 2010; Hamel, 2012). In this research, in addition to combining three approaches, identified factors in the literature in different fields were combined and suitable factors for newly-established companies. Then, the status of these companies is based on the identified factors in the model and the existing gap is known.
Methodology
This research is as follows in terms of application, methodology and purpose.
Application
This is an applied research because its results have special application and used in solving some projects' problems.
Research Methodology
It is a quantitative research.
Purpose
It is exploratory research because it seeks to identify the strategic agility factors in companies established in growth centers. Regarding that the information of the society has been collected using a questionnaire, this is a survey and case-study.
This research has used library method (papers, journals and books) and field studies (researcher-constructed questionnaire based on the identified factors) for gathering information related to the literature, background and strategic agility indicators. The type of questionnaire is closed form, the questions of questionnaire are spectral and it is electronic and face-to-face in terms of distribution.
10 growth centers were identified and it was estimated that around 700 companies are based in these centers or are utilizing their services. Simple random sampling method was used to select the research sample. The Krejcie-Morgan table was used to determine the sample size (we use Krejcie-Morgan table), when neither the population variance nor the probability of success or failure of the variable is known and thus, statistical formulas cannot be used to estimate the sample size. This table has been presented by Krejcie and Morgan.Using this table and the simple random sampling method,155 companies were selected as sample.
Using the desk study method and reviewing the research literature on strategic agility, a list of effective indicators was identified, which is summarized in the following Table 1.
| Table 1 List Of Strategic Agility Indicators |
|||
| Indicator | Supportive resources | Indicator | Supportive resources |
| Strategic sensitivity | Doz & Kosonen, 2010. | Collective commitment | Doz & Kosonen, 2010. |
| Resource fluidity | Implement Consulting Group, 2013; Doz & Kosonen, 2010. | Unity in leadership | Implement Consulting Group, 2013; Doz & Kosonen, 2010. |
| Immediate identification of changes | Mavengere, 2009. | Partners’ ability to make quick collective decisions | Mavengere, 2009. |
| The ability to respond quickly to changes | Mavengere, 2009. | Using information technology to share data | Mavengere, 2009. |
| Process integration and network synchronization | Mavengere, 2009. | Product development in collaboration with partners | Mavengere, 2009. |
| Flourishing network due to the strong partners | Mavengere, 2009. | Prospect | Long, 2000; Worley & Lawler, 2010; Ojha 2008; Roberts & Grover, 2012. |
| Customer knowledge | Long, 2000; Ojha, 2008. | Understanding the key capabilities | Long, 2000; Ojha, 2008; Sherehiy et al., 2008. |
| Selecting strategic goals | Long, 2000; Ojha, 2008. | Joint responsibility and action | Long, 2000; Ojha, 2008. |
| Competitors’ knowledge | Long, 2000. | Cost-effectiveness analysis | Tseng & Lin, 2011; Worley & Lawler, 2010; Brown & Bessant, 2003; Sharifi & Zhang, 1999; Roberts & Grover, 2012; Overby et al., 2006 |
| Decentralized and group decision making | Yusuf et al.,1999. | Close relationships with customers and suppliers | Yusuf et al.,1999. |
| Change management | Agarwal et al., 2007; Roberts & Grover, 2012. | Strategic planning | Bottani, 2010; Zhang, 2011. |
| Quality improvement | Brown & Bessant, 2003. | ||
After interviewing the experts and managers of the growth centers and analyzing collected indicators, factors including: strategic sensitivities, collective commitment, resource fluidity, unity in leadership, change management, using information technology, developing a strategic prospect, understanding the key capabilities, selecting strategic goals, strategic planning, customer knowledge and joint responsibility and action were selected to present the research model and to assess the companies based in the growth centers.
The conceptual model of the research is as follows (Figure 1).
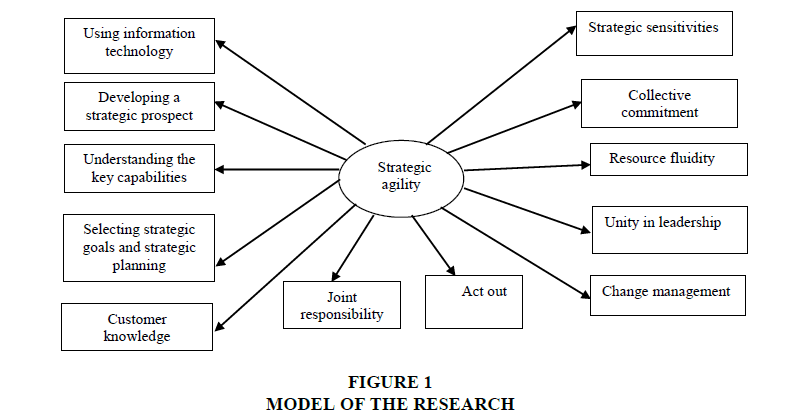
Figure 1: Model Of The Research
A researcher-made questionnaire was used to measure the research variables. The questionnaire was developed based on the Likert scale to measure the above factors. The questions were designed through the analysis of the research literature. Equal values were considered for all the items.
Consultation was made with the counselors of growth centers (10 growth centers), some companies based in growth centers and management professors in the preparation of the questionnaire. To evaluate the content validity of the questionnaire, expert opinions were taken on the compliance of the content of the measurement instrument with the objectives of the study.
In this study, a qualitative research method was used. Specialists were asked to provide feedback on the questionnaire, based on which the questionnaire was modified.
The questionnaires were sent (either in person or by email) to the managers of selected companies. The responses were then received, coded and analyzed using SPSS and LISREL. A structural equation modeling (exploratory factor analysis) was used to extract the factors affecting the assessment of strategic agility of the selected companies.
To measure the validity of the questionnaire, the questionnaire was provided to the supervisors, advisors and a number of experts. They were asked about the content of each question and they confirmed all the questions. To measure the reliability of the questionnaire, 30 organizations were randomly selected (organizations outside the sample) and asked to complete the questionnaire. The reliability of the questionnaires was measured using Cronbach's alpha coefficient. The reliability coefficient was 0.84 (>0.60); thus, no question was omitted.
Data Analysis
Based on the results of desk study method, 12 factors were examined in the form of 27 variables. These variables are effective in assessing the strategic agility of organizations:
1. Companies’ knowledge about the target market’s customer’s q1.
2. Companies’ knowledge about products’ end user’s q2.
3. Companies’ knowledge about the potential product partners q3.
4. Companies’ knowledge about the internal and external experts and Intellectual group’s q4.
5. Those decisions that needs to be made through the organizational hierarchy q5.
6. The organizational commitment of members to organization and prioritizing organizational interests over personal interest’s q6.
7. An organization’s knowledge of organizational resources q7.
8. The ability to reprogram the organizational resources q8.
9. The degree to which companies utilize data management software q9.
10. The use of customer management q10.
11. Using management dashboard to evaluate the status quo and to take future actions q11.
12. Using the opinions of internal experts to analyze customer behavior and the experience of organizational members Q12.
13. Using the opinions of external experts to analyze customer behavior q13.
14. Developing a five year prospect by company’s q14.
15. Paying attention to the environmental changes in the developed prospect and revising them q15.
16. Developing an organizational mission and revising it in accordance with the environmental changes q16.
17. Strategic planning q17.
18. Identifying environmental opportunities and threats q18.
19. Identification of organizational capabilities and potentials and addressing organizational learning q19.
20. Setting strategic goals q20.
21. Revision of strategic objectives in line with the environmental changes q21.
22. Understanding the environmental changes q22.
23. Forecasting the environmental changes q23.
24. Appropriate response at the right time to environmental changes q24.
25. The authority granted by the organization to its employee’s q25.
26. The sense of commitment of the members of an organization to the assigned responsibilities q26.
27. Unity in leadership q27.
The research variables were determined using research literature and on the basis of expert opinions. The opinions and recommendations of management and entrepreneur professors were also used to make necessary corrections. There are several methods and tools used to measure reliability and internal consistency is among these tools.
To describe the research data, descriptive statistics (frequency and percentage) were used and to identify, describe and explain the factors affecting the assessment of strategic agility in the studied companies and to extract the underlying constructs inferential statistics (exploratory factor analysis) were used.
Factor analysis technique was used to reduce the number of research variables and to determine the importance of each factor in strategic agility. Factor analysis is a valid method used for identifying factors. This methodology was first proposed by Pearson (1901) and Charles Spearman (1904) when measuring intelligence. Since then, this method is used to determine the most effective variables, when the number of variables is high and the relationships between them are unknown. In this method, the variables are in certain and limited factors, so that the variance percentage is reduced from one factor to the next. Therefore, the most effective variables are those that fall in the first factor. Factor analysis mainly aims at reducing the volume of data and determining the most important variables. Accordingly, in studies with a large number of variables, this highly accurate method can be used to reduce the volume of variables. This method has been used widely in recent decades, particularly with the advancement of the computer statistics programs. Before performing the factor analysis, the adequacy of the data must be tested. Two of the major methods used for determining the adequacy of data for factor analysis is using KMO coefficient and the Bartlett’s coefficient. The KMO index varies between zero and one. When the KMO index is less than 0.5, the data set is not suitable for conducting factor analysis. Greater caution will be needed, when it is between 0.5 and 0.69 and finally, when this statistic is greater than 0.7, the correlations will be very suitable for conducting factor analysis. The Bartlett's test is conducted to see that whether the observed correlations matrix belongs to a population with uncorrelated variables or not. All the variables must be correlated to make a suitable and meaningful factor model; otherwise, there will be no reason to explain the factor model. Therefore, the significance of chi square is the minimum requirements for performing factor analysis. In this study, the KMO coefficient and Bartlett's test were used to determine the adequacy of the data. the KMO value is 0.717 and the Bartlett’s test also represents an acceptable value (sig=0.000>0.05).Therefore, the research variables are suitable. The next step is to extract the primary factors. This step is performed through the variance determined by the main factor analysis method. In factor analysis, Kaiser Criterion is generally used to determine the number of extractable factors. According to this criterion, factors with special values greater than one can be selected as extractable factors. Table 2 presents the extracted factors, special values, percentage of variance and cumulative percentage of variance. As shown in the Table 2, the special values of six factors are greater than one and the variables can be summarized in six factors. The special values of the first factor was 9.098. This factor plays the most significant role in the assessment of strategic agility and accounts for 33.69% of the total variance. The special values of the second, the third, the fourth, the fifth and the sixth factors were 4.687, 3.288, 2.478, 1.721 and 1.357, respectively and they explained 17.359%, 12.177%, 9.183%, 6.357% and 5.027% of the variance, respectively. Based on the results of the Table 2, these six factors accounted for 83.816% of the total variance of the factors affecting the assessment of strategic agility, which is an acceptable value.
| Table 2 Total Variance Explained |
||||||
| Component | Initial Eigenvalues | Extraction Sums of Squared Loadings | ||||
| Total | % of Variance | Cumulative % | Total | % of Variance | ||
| 1 | 9.098 | 33.695 | 33.695 | 9.098 | 33.695 | 33.695 |
| 2 | 4.687 | 17.359 | 51.054 | 4.687 | 17.359 | 51.054 |
| 3 | 3.288 | 12.177 | 63.231 | 3.288 | 12.177 | 63.231 |
| 4 | 2.479 | 9.183 | 72.414 | 2.479 | 9.183 | 72.414 |
| 5 | 1.721 | 6.375 | 78.789 | 1.721 | 6.375 | 78.789 |
| 6 | 1.357 | 5.027 | 83.816 | 1.357 | 5.027 | 83.816 |
| 7 | .939 | 3.477 | 87.293 | |||
After determining the number of factors, it must be determined that which variables are assigned to each of the factors. Therefore, we need to enter a stage called the factor rotation. The goal of rotation is not to change the number of extracted factors; rather, it is conducted to prepare the factors for better interpretation and classification. Without rotation, one cannot trust the results of factor analysis. In addition, rotated factors re-establish primary correlations more precisely than non-rotated factors. It is assumed that variables above 0.50 are significant variables. The Varimax method was used. It is the most commonly used orthogonal rotation method. After 22 rotations, the variables were classified into six factors. the variables q1, q2, q14 and q15 had the highest loads on the first factor. The variables of q4, q6, q13, q20 and q26 had the highest loads on the second factor. The variables of q3 and q22 had the highest loads on the third factor. The variables of q12, q16, q18 and q19 had the highest loads on the fourth factor. The variables of q24 and q27 had the highest loads on the fifth factor and finally, the variables of q17 and q25 had the highest loads on the sixth factor. Based on the results of the rotated matrix, 19 variables were classified in the form of six factors and 8 variables (q5, q7, q8, q9, q10, q11, q21 and q23) were omitted, due to their low factor loadings. These variables were omitted, because their effects overlapped with those of more important variables.
The last step of factor analysis includes explaining, interpreting and naming the extracted factors. The type of the variables in each factor should be taken into account during this process. A factor’s name should be highly relevant to its variables. The following Table 3 shows the status of variables included in various factors, the factor loadings and the names of the effective factors in the assessment of strategic agility of companies based in growth centers.
| Table 3 The Effective Factors In The Assessment Of Strategic Agility Of Companies Based In Growth Centers |
||
| Factor | Variable | Factor loading |
| Developing a prospect on the basis of customer knowledge | Companies’ knowledge about the target market’s customers | 0.580 |
| Companies’ knowledge about products’ end users | 0.853 | |
| Developing a five year prospect by companies | 0.578 | |
| Paying attention to the environmental changes in the developed prospect and revising them | 0.568 | |
| Developing strategic goals based on the commitment and accountability of members | Companies’ knowledge about the internal and external experts and Intellectual groups | 0.830 |
| The organizational commitment of members to organization and prioritizing organizational interests over personal interests | 0.566 | |
| Using the opinions of external experts to analyze customer behavior | 0.689 | |
| Setting strategic goals | 0.803 | |
| The sense of commitment of the members of an organization to the assigned responsibilities | 0.871 | |
| Identifying partners and understanding environmental changes | Companies’ knowledge about the potential product partners | 0.764 |
| Understanding the environmental changes | 0.859 | |
| Fluency of resources based on the strategic mission | Using the opinions of internal experts to analyze customer behavior and the experience of organizational members | 0.534 |
| Developing an organizational mission and revising it in accordance with the environmental changes | 0.628 | |
| Identifying environmental opportunities and threats | 0.694 | |
| Identification of organizational capabilities and potentials and addressing organizational learning | 0.843 | |
| Change management along with unity in leadership | Appropriate response at the right time to environmental changes | 0.507 |
| Unity in leadership | 0.633 | |
| Strategic planning along with delegation of authority | Strategic planning | 0.680 |
| The authority granted by the organization to its employees | 0.690 | |
In general, the Table 4 represents six factors affecting the assessment of strategic agility of companies based in growth centers.
| Table 4 Fit The Model |
|||||||||
| Factors | NFI6 | NNFI5 | GFI4 | AGFI3 | IFI2 | RMSEA1 | p-value | df | Chi?Square |
| Developing a prospect on the basis of customer knowledge |
0.00 | 1.05 | 1.00 | 1.00 | 1.00 | 0.00 | 0.70 | 1 | 0.15 |
| Developing strategic goals based on the commitment and accountability of members |
0.99 | 0.99 | 0.99 | 0.94 | 1.00 | 0.054 | 0.22 | 3 | 4.37 |
| Fluency of resources based on the strategic mission |
---- | ---- | ---- | ---- | ---- | 0.00 | 0.97 | 1 | 0.00 |
Note: 1: Root mean square Error of approximation; 2: Incremental fit index; 3: Adjusted goodness of fit index; 4: Goodness of fit index; 5: Non-normed fit index; 6: Normed fit index.
The structural equation modeling was used in LISREL to analyze the causal relationships between the independent and dependent variables. A structural model or path diagram must have a set of well fitted indicators and its p-values and standard coefficients must be significant. A research model fits the data well, when the df/χ2 is less than 3, RSMEA is less than 0.08, GFI is greater than 0.90 and AGFI is larger than 0.85.When the T-values are larger than 2 or smaller than -2, they are significant at 99% confidence level.
In accordance with Figure 2 indicators identified in exploratory factor analysis was Amos software and its reliability was evaluated.
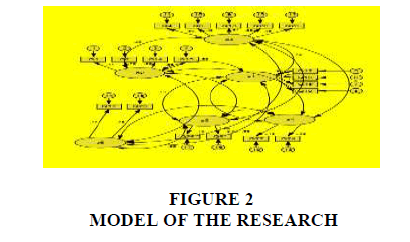
Figure 2: Model Of The Research
The following three diagrams (Figure 3) show the significance coefficients and the parameters of the three factors. All the relationships were significant; because all the T-values were greater than 2.
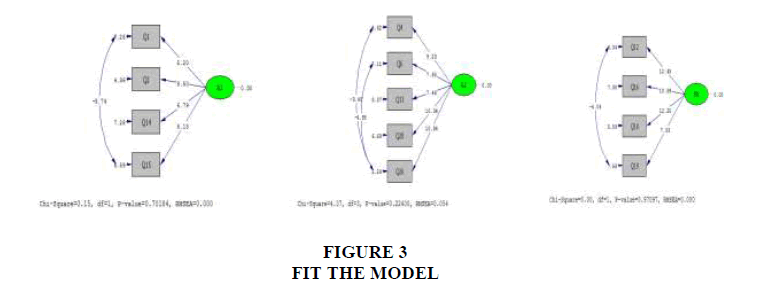
Figure 3: Fit The Model
Table 4 shows that the indicators are well fitted. Based on the results, the indicators obtained from the exploratory factor analysis were accepted.
Regarding the obtained results of confirmatory factor analysis, indicators obtained by exploratory factor analysis are accepted. In the next step, the condition of newly-established companies was studied in terms of identified factors. According to the first questionnaire which is based on Likert spectrum, and based on the identified indicators in the model, condition of companies based on the mean factors is as follows (Table 5).
| Table 5 Average Strategic Agility Indicators |
|||||
| First | Second | Third | Fourth | Fifth | Sixth |
| Developing a prospect on the basis of customer knowledge | Developing strategic goals based on the commitment and accountability of members | Identifying partners and understanding environmental changes | Fluency of resources based on the strategic mission | Change management along with unity in leadership | Strategic planning along with delegation of authority |
| 3.74 | 4.05 | 3.72 | 4.05 | 4.2 | 4.03 |
Among these factors, the indicators of identifying partners and understanding environmental changes and formulating a vision based on the knowledge of customer, have the least mean, and resource fluidity based on the strategic mission have the highest mean, respectively.
According to the experts and organizational agents view, the mean for studied indicators should be 5. Therefore, the optimal limits is 5. Based on this, the following diagrams (Figure 4 and Figure 5) shows the optimal condition and present condition of strategic agility based on the identified factors.
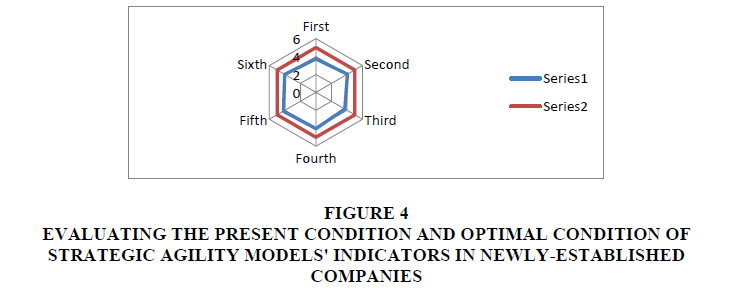
Figure 4: Evaluating The Present Condition And Optimal Condition Of Strategic Agility Models' Indicators In Newly-Established Companies
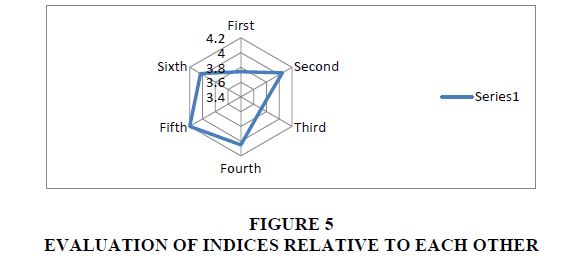
Figure 5: Evaluation Of Indices Relative To Each Other
Discussio
In today's the complex and variable conditions, instructions like negotiation, relative focus on customers and suppliers in different steps of supply chain, are not considered as a competitive advantage. Therefore, in these conditions, strategic agility thinking is required more than before, young SMEs rarely can create competitive data and hardly can focus on the whole market and consider it as the target market. But it is more likely that they focus on those segments of the market which are ignored by the larger competitors. Strategic management of this opportunity allows the company to focus on the demands of target customers using limited resources, create competitive advantage and survive in the market. According to Sharp, the strategic agility components in the universities are: strategic understanding, leadership ability, integration and commitment, innovation and fluidity of resources (resource flexibility) which are consistent with the identified indicators in this mode.
So far, newly established companies have not been studied in respect to the strategic agility. Therefore, only identified factors can be compared to the recognized factors of other research in various fields. According to Dooz and Kossnen view fluid resources, strategic sensitivity and collective commitment are required for strategic agility (Doz & Kosonen, 2009). Results of this research also confirm this view. According to Goldman et.al, four strategic dimensions for achieving agile competitive capabilities are as follows: a. enriching the customer; b. cooperating for improving and promoting the capability; c. controlling the changes; d. using individuals and information as leverage (increasing the effect) (Goldman et al.,1995) which are consistent approximately with the results of this researchTo achieve strategic sensitivity, requiring the commitment of the individual members of the organization (Doz & Kosonen, 2008a) (Hamel, 2012). In this study, except the indicator of organizational commitment with the high priority that the results of the research confirms the Hamel. In terms of Brown and asnhard, companies need to continue life between two points of chaos and bureaucracy to create balance. For this purpose, the Organization must be actively, intelligently to save changes. Partnership and engagement strategies and the harmony with the time for a change (Brown & Eisenhardt, 1998).This research also, this result.
At the same time, such factors as decision-makings which are supposed to be made through the organizational hierarchy, the ability to re-plan human resources, the extent to which companies use data management software and customer management utilization have been omitted with the results obtained in this study. It seems that these factors depend on the structure and resources available to these organizations. These factors are among the effective factors on agility in the studies by Mavengere (2009) and Yusuf et al. (1999) and Implement Consulting Group (2013), Doz & Kosonen (2009).
The commitment of the members of the organization to the assigned responsibilities has the maximum factor load (0.87) among the identified factors. This refers to the ability of the senior team to make audacious decisions without being trapped in winning-and-lose policies. This requires a cultural generalization by whichteam members are more committed to the collective success rather than promoting their own goals. In addition to collective commitment, understanding environmental changes is of great importance. In the modern competitive era, the change is one of the main features of the organization.The majority of the organizations experience the contextual change in three to six months' period or even in a year. The context in which the organizations deal with in the world of business requires organizational changes in attitudes, knowledge, approaches, practices and outcomes.Hence, using appropriate mechanisms that are appropriate for changes in different organizational contexts, organizations need to be prepared to deal with these changes. Understanding environmental changes has the highest factor load and its mean is 3.72 which is average. It is suggested that specific workshops consisting of representative of organizations form in the growth centers which monitor the key changes continuously and inform the companies.
Familiarity of companies with end users of products in the market was among factors with the highest factor load with mean 3.74. Therefore, it is suggested that in the end product fabrication step, more information obtains about the characteristic of end users and the prototype enters into production step by imposing these characteristics.
The development of fundamental capabilities of an organization through emphasis on the individual, team and organizational learning for effective and constructive relationship with the customers and suppliers for timely identification of environmental opportunities and rapid exploitation, and as a result, nurturing the creativity and innovation of all organization members is emphasized for rapid and timely response to the market demands.
Familiarity of companies with experts and thought groups inside and outside the organization by holding conferences in the growth centers and representatives of organizations and consulters suggested by growth centers and using their opinions in the organization;
The mean for formulating and revision organization visions is 4.03 that we can say it is acceptable. But discussions between members of the team, internal and external beneficiaries of organization which create new views about the future and goals of the organization can help the development of strategic vision.
Holding suitable training courses in order to increase the awareness of managers from how to identify customers, formulating vision, strategic goals and change management by growth centers and organizations.
Another result addresses the identification of the current status of enterprise entrepreneurship in these organizations, which shows that these organizations are moving towards enterprise entrepreneurship.
Conclusion
The approach towards enterprise entrepreneurship is above the expected usual average. However, the newly established organizations require well-program organizational plan to maintain organizational entrepreneurship in the organization and continuous improvement. In this way, business incubator centers serve as facilitators to help enterprises entrepreneurship in companies should take appropriate measures.
Consequently, strategic agility is a dynamic feature that can serve as a valuable, rare, non-imitable and irreplaceable source according to the source-centered approach. It can help a business to maintain its competitive advantage. Therefore, the managers of the organizations studiedin this research need to develop the strategic agility of industries of their business.
Limitations And Future Research
One of the limitations of this research is the suspicion of providing information by newly established companies. This study considers the strategic agility of newly established companies based on growth centers. These companies are supported by growth centers. Therefore, newly emerged companies that operate independently have not been investigated. It is suggested that a study be done with this title in other newly created companies and be compared with the results of this study. In this research, companies' environmental uncertainty is equal and high. Research in larger communities and amount of different environmental uncertainty about the tests, is Suggested to be performed. Based on market and subject of activities, firms should be grouped and research about strategic agility must be performed.
Other factors can also be effective around strategic agility research subject in the future. Strategic agility does not happen instantly, therefore over time continual review is needed. Because this study focuses only on strategic agility, it is recommended that future researchers should pay attention on other dimensions of agility in the newly established organizations.
References
- Adeleye, E.O., & Yusuf, Y.Y. (2006). Towards agile manufacturing: models of competition and performance outcomes.International Journal of Agile Systems and Management,1(1), 93-110.
- Agarwal, A., Shankar, R., & Tiwari, M.K. (2007). Modeling agility of supply chain.Industrial Marketing Management,36(4), 443-457.
- Amin-Beidokhti, A.A., & Zargar, S.M. (2012). Pathology of Small and Medium Enterprises (SMEs) and Practical Strategies to Support them (Semnan Province Case Study).Quarterly Journal of Management and Development Process,24(4), 125-156.
- Apostolos, D.Z., & Dimosthenis, T.M. ( 2014 ). Entrepreneurship and SME's organizational structure. Elements of a successful business.Procedia-Social and Behavioral Sciences,148, 463-467.
- Bamford, C.E., Dean, T.J., & McDougall, P.P. (1997). Initial strategies and new venture growth: An examination of the effectiveness of broad vs. narrow breadth strategies.Frontiers of Entrepreneurship Research,3, 75-87.
- Banaszyk, P. (2013). Change of key strategic problems. In: S. Trzcieli?ski (ed.), Selected Problems of Management: Present and Future (pp. 20-27). Wydawnictwo Poli-technika Pozna?skiej, Pozna?.
- Barney, J. (1991). Firm resources and sustained competitive advantage.Journal of Management,17(1), 99-120.
- Bottani, E. (2010). Profile and enablers of agile companies: An empirical investigation.International Journal of Production Economics,125(2), 251-261.
- Brown, S., & Bessant, J. (2003). The manufacturing strategy-capabilities links in mass customisation and agile manufacturing-an exploratory study.International Journal of Operations & Production Management,23(7), 707-730.
- Brown, S., & Eisenhardt, K. (1998). Competing on the edge: Strategy as structured chaos.Long Range Planning,31(5), 786-789.
- Crook, T.R., Ketchen Jr, D.J., Combs, J.G., & Todd, S.Y. (2008). Strategic resources and performance: A meta?analysis.Strategic Management Journal,29(11), 1141-1154.
- Doz, Y.L., & Kosonen, M. (2008a). Fast strategy: How strategic agility will help you stay ahead of the game. Harlow: Wharton School Publishing.
- Doz, Y.L., & Kosonen, M. (2008b). The dynamics of strategic agility: Nokia’s rollercoaster Experience. California Management Review, 50(3), 95-118.
- Doz, Y.L., & Kosonen, M. (2008c). How agile is your strategy process. Strategy Magazine, 6(15), 6-10.
- Doz, Y.L., & Kosonen, M. (2010). Embedding strategic agility: A leadership agenda for accelerating business model renewal.Long Range Planning,43(2-3), 370-382.
- Fini, R., Grimaldi, R., Marzocchi, G.L., & Sobrero, M. (2012). The determinants of corporate entrepreneurial intention within small and newly established firms.Entrepreneurship Theory and Practice,36(2), 387-414.
- Goldman, S.L., Nagel, R.N., & Preiss, K. (1995).Agile competitors and virtual organizations: Strategies for enriching the customer. New York: Van Nostrand Reinhold.
- Hamel, G. (2012). The future of management. Boston: Harvard Business School Press.
- Hamel, G., & Välikangas, L. (2003). The quest for resilience. Harvard Business Review, 81(9), 52-63.
- Horney, N., Pasmore, B., & O'Shea, T. (2010). Leadership agility: A business imperative for a VUCA world.Human Resource Planning,33(4), 34.
- Implement Consulting Group (2013). Strategic agility; What does it take to build an agile organisation? Retrieved from www.implement.dk
- Kraus, S., & Kauranen, I. (2009). Strategic management and entrepreneurship: Friends or foes.International Journal of Business Science and Applied Management,4(1), 37-50.
- Krejcie, R.V., & Morgan, D.W. (1970). Determining sample size for research activities.Educational and Psychological Measurement,30(3), 607-610.
- Lambropoulos, P. (2005). Handbook of Entrepreneurship.Organization, management of individual and small businesses, (4th ed.). Propompos pub.
- Long, C. (2000). You don't have a strategic plan?-good!.Consulting to Management,11(1), 35.
- Lubatkin, M.H., Simsek, Z., Ling, Y., & Veiga, J.F. (2006). Ambidexterity and performance in small-to medium-sized firms: The pivotal role of top management team behavioral integration.Journal of Management,32(5), 646-672.
- Mavengere, N. (2009). Strategic agility of supply chains.Network,6(3), 4.
- Ngai, E.W., Chau, D.C., & Chan, T.L.A. (2011). Information technology, operational, and management competencies for supply chain agility: Findings from case studies.The Journal of Strategic Information Systems,20(3), 232-249.
- Ojha, D. (2008).Impact of strategic agility on competitive capabilities and financial performance.Doctoral Dissertation, Clemson University.
- Overby, E., Bharadwaj, A., & Sambamurthy, V. (2006). Enterprise agility and the enabling role of information technology.European Journal of Information Systems,15(2), 120-131.
- Pearson, K. (1901). On lines and planes of closest fit to systems of points in space.The London, Edinburgh, and Dublin Philosophical Magazine and Journal of Science,2(11), 559-572.
- Roberts, N., & Grover, V. (2012). Investigating firm's customer agility and firm performance: The importance of aligning sense and respond capabilities.Journal of Business Research,65(5), 579-585.
- Roth, A.V. (1996). Achieving strategic agility through economies of knowledge.Planning Review,24(2), 30-36.
- Sajdak, M. (2014).Business agility as a concept of management between stability and chaos.Granice zarz?dzania, Oficyna Wydawnicza-Szko?a G?ówna Handlowa, Warsaw.
- Sajdak, M. (2015). Compilation of operational and strategic agility for ensuring the highest efficiency of company operations. Economics and Management, 7(2),20-25.
- Sharifi, H., & Zhang, Z. (1999). A methodology for achieving agility in manufacturing organisations: An introduction. International Journal of Production Economics,62(1-2), 7-22.
- Sharpe, R. (2012). Agile University: Building the innovation and improvement for a better student experience. InHigher Education SEMINAR. Retrieved from www.elementaleadership.co.uk
- Shin, H., Lee, J.N., Kim, D., & Rhim, H. (2015). Strategic agility of Korean small and medium enterprises and its influence on operational and firm performance.International Journal of Production Economics,168, 181-196.
- Spearman, C. (1904). General Intelligence, objectively determined and measured.The American Journal of Psychology,15(2), 201-292.
- Tsai, W.H., & Kuo, H.C. (2011). Entrepreneurship policy evaluation and decision analysis for SMEs.Expert Systems with Applications,38(7), 8343-8351.
- Tseng, Y.H., & Lin, C.T. (2011). Enhancing enterprise agility by deploying agile drivers, capabilities and providers.Information Sciences,181(17), 3693-3708.
- van Hoek, R.I., Harrison, A., & Christopher, M. (2001). Measuring agile capabilities in the supply chain.International Journal of Operations & Production Management,21(1/2), 126-148.
- Vázquez-Bustelo, D., Avella, L., & Fernández, E. (2007). Agility drivers, enablers and outcomes: empirical test of an integrated agile manufacturing model.International Journal of Operations & Production Management,27(12), 1303-1332.
- Venkatraman, N., & Henderson, J.C. (1998). Real strategies for virtual organizing.Sloan Management Review,40(1), 33-48.
- Weber, Y., & Tarba, S.Y. (2014). Strategic agility: A state of the art introduction to the special section on strategic agility.California Management Review,56(3), 5-12.
- Worley, C.G., & Lawler, E.E. (2010). Agility and organization design: A diagnostic framework.Organizational Dynamics,39(2), 194-204.
- Yusuf, Y.Y., Sarhadi, M., & Gunasekaran, A. (1999). Agile manufacturing: The drivers, concepts and attributes.International Journal of Production Economics,62(1-2), 33-43.
- Zahra, S.A., Filatotchev, I., & Wright, M. (2009). How do threshold firms sustain corporate entrepreneurship? The role of boards and absorptive capacity.Journal of Business Venturing,24(3), 248-260.
- Zaridis, A.D., & Mousiolis, D.T. (2014). Entrepreneurship and SME's organizational structure. Elements of a successful business.Procedia-Social and Behavioral Sciences,148, 463-467.
- Zhang, D.Z. (2011). Towards theory building in agile manufacturing strategies-Case studies of an agility taxonomy.International Journal of Production Economics,131(1), 303-312.