Research Article: 2017 Vol: 16 Issue: 2
Econometric Modeling as a Tool for Evaluating the Performance of Regional Innovation Systems (With Regions of the Russian Federation as the Example)
Irina Rudskaya, Peter the Great Saint-Petersburg Polytechnic University
Dmitry Rodionov, Peter the Great Saint-Petersburg Polytechnic University
Keywords
Data Envelopment Analysis, Performance Evaluation, Regional Innovation System, Regional Economy, Econometric Modelling.
Introduction
To date, the issues of evaluating the region innovation and efficiency of innovation activities in the region are a topic of lively academic discussions. This determines the relevance of the topic of this article. Analysis of existing systems for evaluating innovation in the regions has already been carried out in the previous papers of the author, such as the Rating of Innovation Regions of Russia compiled by the Association of Innovation Regions and the Russian Regional Innovation Index (Rudskaya, 2015). This allowed identifying common approaches and weaknesses inherent in each of them.
First of all, it is an attempt to rank regions by an integral index built on the basis of weighted averages. Weights are assigned by default, which is subjective evaluation in the first place and secondly, it does not allow taking into consideration the specifics of the regions, which generally strive for improving the efficiency and performance of innovation but doing it in different ways. Secondly, these indices do not allow to understand how much the regions lag behind the leaders of innovation development and in what direction they should make efforts (reflected in the regional innovation policy) to improve the performance of innovation activities.
When researchers try to evaluate the performance of innovation activities in the region, they inevitably face a variety of conditions of this activity in various regions. The performance of innovation activities in the region can be influenced by the time of their implementation, historical and economic specifics of the region, as well as random factors (Edquist, 1997; Kudryavtseva, Rodionov, Kravchenko & Maryta, 2016). Interaction between all participants in the innovation process, both public and private, is also important.
It is not always possible to identify indicators of innovation activities relevant to a specific region due to the openness of regional innovation systems, which also makes it difficult to evaluate the performance (Rodionov & Rudskaya, 2016).
It must also be noted that there is a time lag between investment in innovation and innovation results, which is determined firstly by the scale of investment and secondly by the life cycle of the technologies prevailing in the region (Rudskaya, 2015).
It is customary to distinguish two basic performance types in the literature: Technical and allocative (price-related). Allocative (price-related) performance describes the efficiency degree of allocating resources at existing prices, managing purchases and distribution. Technical performance describes the extent of efficiency to which a company uses available resources.
Nowadays, in order to analyze efficiency, the alternative approach-technical efficiency analysis is used. Articles of Aigner, Lovell & Schmidt (1977) en & Van den Bruck are thought to be essential works in terms of estimating technical efficiency by applying the stochastic function of production. The latter combines foundational theoretic speculations and practical econometrics.
The first works on estimating production efficiency belong to (Debreu, 1951; Farrell, 1957). In his work Farrell developed ideas of Debreu & Koopmans (1951) and defined technical efficiency for a number of economic resources. He offered to single out two components of the efficiency: Technical efficiency (ability to obtain the maximum production from the limited number of resources) and allocation efficiency (ability to use resources in the optimal proportion at the set prices).
As for researches of the efficiency of regional innovation systems, in his knowledge production function model, Romer (1990) divided economy intro three sectors: Research, production of capital goods and final production.
Griliches (1984) used suppositions that are similar to Romer’s, but he specified the knowledge production function in a different way. The concept is based on the expenses-production model.
The economic system is recognized inefficient if it is unable to generate the best achievable result on the basis of a certain set of resources (Farrell, 1957). Regarding the regional innovation system, it can be assumed that the region is technically efficient if it is able to produce the best possible result of innovation activities per unit of innovation resources (Fritsch & Slavchev, 2006), i.e., to maximize its innovation potential. As such, technical performance reflects the ability of the region to convert investment in innovation resources into results of innovation activities (Chen & Guan, 2012). In fact, this is a production function, where knowledge plays a key role.
Methods
Taking the above considerations into account, the authors primarily review the technical performance of innovation activities in the region.
The key approaches to evaluating the technical performance of economic systems are based on the theory of production curves and the specification of production function. Two groups of methods are used for their construction: Parametric and nonparametric. There are two major approaches to measuring technical performance: On the basis of parametric and nonparametric methods. The paper contains their comparison in terms of innovation (Bonaccorsi & Daraio, 2004).
Foreign literature describes differences between nonparametric and parametric methods of evaluating these indicators. Generalized information about the models that determine how close the company is to the efficiency frontier is presented in Table 1.
| Table 1: Approaches And Methods For Evaluation Of Technical Performance | |
| Parametric | Non-parametric |
|---|---|
| Stochastic frontier approach; Distribution free approach; Thick frontier approach. |
Data Envelopment Analysis (analysis of the functioning environment); Free Disposal Hull (special case of the Data Envelopment Analysis). |
Source: Coell, Rao, O’Donell & Battese George, 2005.
The above methods differ by assumptions about the existence and nature of random error distribution, about the functional form of the production capability frontier (efficiency frontier), as well as the methods of evaluating the performance of one object with respect to other sampling elements.
This paper uses a nonparametric approach and a data envelopment analysis (DEA) (Cooper, Seiford & Tone, 2006).
Charnes, Cooper & Rhodes (1978) introduced the data envelopment analysis (DEA) term. They supposed constant return to scale (CRS) and offered a model of estimating technical efficiency focused on the consumed resources. This is a nonparametric approach to estimating the efficient production boundary. The DEA method aims at defining the relevant efficiency of every enterprise operation. The efficiency is interpreted as the relation of the aggregate of input parameters’ values to that of the output parameters. This task has a multivariate comparison nature and the optimization task is solved individually for every company. Later other suppositions were introduced. The model of variable return to scale (VRS) was developed by Banker, Charnes & Cooper (1984). The book by Fare, Grosskopf & Lovell (1994) describes the details of the procedure for optimal solving of DEA tasks based on both constant return to scale (CRS) and variable return to scale (VRT). In their work, Fare, Grosskopf, Norris & Zhang (1994) consider tasks on defining changes of the production factors efficiency and technological changes for the panel data.
This method is actively used in the analysis of national innovation systems (a review of the performed studies is presented in article (Kotsemir, 2013)), but it almost has not been applied to Russian regional innovation systems. An approach using the DEA method among other methods for the integrated evaluation of Russian regional innovation systems is used in the article by Zemtsov & Baburin (2017), but it used a small number of input and output parameters and did not take the time lag into account, i.e., the approach cannot be used independently as an indicator for policy development.
According to the DEA, region can be recognized efficient in terms of innovation activities if no other region(s) can produce better innovation results at a given amount of innovation resources (Charnes, Cooper & Rhodes, 1979).
According to the DEA-based approach, an organization, region or economic system, the performance of which is the subject of analysis, is called a “decision-making unit” (DMU). We will hereinafter use the term "economic unit", which emphasizes the essence of this entitytransformation of resources into performance results. The functions of this entity include transformation of resources into performance results.
Nonparametric approach used in the DEA means that each economic unit is in the process of transforming the available resources into performance results. This approach is based on the benchmarking idea, since a group of efficient economic units is considered as samples (benchmarks) for other units having the same priorities and development goals but using available resources less efficiently.
The model is aimed at evaluating the technological parameters of economic agents in the "resources-results" space. Accordingly, proceeding from the desired actions, all parameters can be classified and referred either to resources or to results. In certain situations, the same indicator can be attributed to both resources and results. The model is aimed at maximizing the referral of "results" to "resources".
The classical model, also called the Charnes, Cooper & Rhodes model (Charnes, Cooper & Rhodes, 1979), contains a premise of constant returns to scale. This means that if a combination of the values (x; y) is permissible, then the combination (tx; ty) is also permissible. The resulting performance ratios in a model with constant returns to scale can be interpreted as indicators of global technical performance, since the production function is determined by various combinations of resource and result indicators with any non-negative ratios.
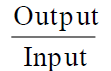
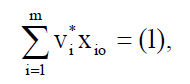
As such, there is a set of resources (xi) and achievable results (yr), which is reduced to a general indicator by means of weights:
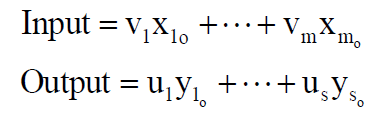
Where vi, i=[1, m]; ur, r=[1, s] are weights of each resource and result achieved in the general indicator. Weights are not predefined (and this is a significant advantage of the data envelopment analysis compared to other approaches) but are determined by linear programming in such a way as to maximize the following ratio:
In this case, the weights can differ from one DMU to another, since their values are not predefined but are taken from the actual data, i.e., an optimal set of weights appears for each unit. In other words, we get resource and result vectors with unique weights for each DMUj. As such, the resource and result matrices look as follows:
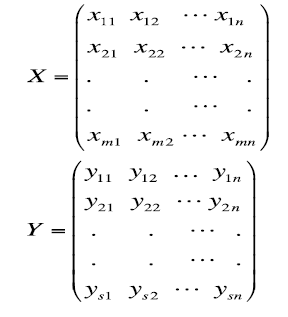
Where X is a matrix of (m×n ) size, Y is a (s×n ) matrix.
As such, the efficiency of each DMU is measured and each DMU is further optimized. This means that n optimization problems are solved for the dimensionality of matrices specified in formula (2). The estimated DMUj in each test is noted as DMUo (o=1, 2…n). To obtain the best values of weights of resources (vi) (i=1…m) and results (ur) (r=1…s), the problem of linear fractional programming is being solved:
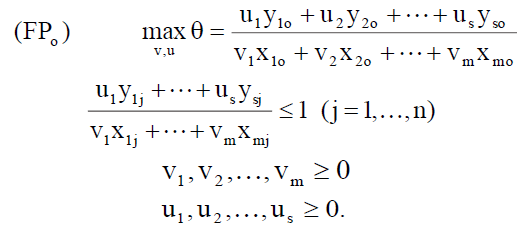
Limitations of the model mean that the ratio of "results" to "resources" for each economic unit should not be greater than 1 (the DMU is technically efficient at a value of this ratio equal to 1). In other words, the greatest best value of θ* is equal to 1. One of the limitations of the approach proposed by this model is the assumption that all resources and results are nonnegative, i.e., they have some non-zero value. This limitation may not correspond to reality and is removed in the use of more sophisticated models of the data envelopment analysis, but it seems justified from the managerial point of view.
For convenience of presentation and optimization, the linear fractional programming (FPo) problem is replaced by the linear programming problem (LPo):
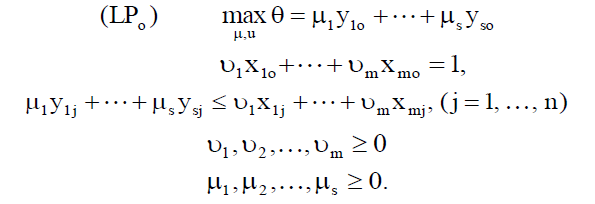
Assuming non-zero values of the vector of weights (vi) and a positive set of resources X>0, the equivalence of linear fractional and linear programming problems can be proved. There is also evidence of independence of the best values max θ=θ*from parameters that measure resources and results, provided that these parameters are equal for each DMU.
The best solution of the linear programming problem is solution (θ*, v*, u*), where v* and u* correspond to limitations (10) and (11). It must be considered that the best solution uses symbols v and u instead of υ and μ used in the linear programming problem.
Then the following definition of the technical performance of the DMU can be provided: DMUo is efficient if and there exists at least one optimal set (v*, u*), with v*> 0, u*> 0. In the absence of such a set, DMUo is technically inefficient. In other words, either or and at least one of the elements from the best set (v*, u*) is equal to 0 from each best solution (LPo).
If or DMUo is technical inefficient, there is at least one set (or DMU) at which the inequality from formula (9) becomes equality at weights (v*, u*) (otherwise θ* can be increased). Let the set of such parameters from {j=1…n} be represented as E’o:
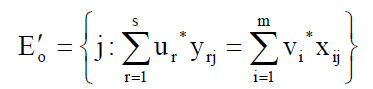
There is a set ?o inside this set, which consists from technically efficient units and is called the reference group for DMUo. They form the efficiency frontier.
One should also refer to the values of the best weights. The set (v*, u*) obtained as the best solution of the linear programming problem (LPo) is a set of the best weights for DMUo. Since we evaluate the relationship of results to resources, this can be written down as follows:
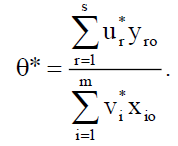
It follows from condition (8) that the denominator of formula (13) is equal to 1, hence:
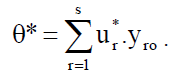
As noted above, (v*, u*) is the set of the most preferred weights for DMUo in terms of maximizing the referral of results to resources; v* describes the best weight for resource i and fluctuations in its values show how valuable this particular resource is. The same is true for the results: u*r describes significance of the result r. When each resource v*ixio in the resource set is analysed:
The relative significance of each resource in each v*ixio can be estimated. The same approach is valid for the results’ weights, u*ryro, where u*r is an estimate of the relative contribution of each yro to the general relation θ*.In other words, the values of the weights do not just describe how much certain result or resources contribute to the general ratio, but also provide an idea of the possible scale of their change.
One of the DEA advantages for analysing the innovation efficiency of the regions is the ability to assess overall performance as a result of the impact of many factors on costs and results. As such, this approach differs from the common approach associated with the formation of an index on the basis of weighted indicators that describe the cost and efficient components of innovation activity separately.
The following advantages of the data envelopment analysis are worth noting:
1. Ability to include several types of resources and results in the model.
2. Efficiency frontier is built on the basis of available data.
3. Absence of a priori limitations of the functional form. When a model is built, it is not necessary to bring the efficiency frontier to a certain "general" form, which significantly brings the research closer to reality.
4. Unlike regression analysis, it is not necessary to assume the exact functional form of interconnection between costs and output, because the model specification is based on a piecewise defined linear efficiency frontier.
5. Absence of random fluctuations: All deviations from the efficient frontier confirm inefficiency.
6. The production function can be built taking all observable parameters and data for all used companies into account. Therefore, the probability of incorrect model specification is equal to zero; moreover, tests on the significance of parameters are not required, since a researcher independently chooses the relevant indicators at the given moment.
One of the serious limitations of the approach based on the data envelopment analysis is a strict premise about the absence of random errors in the data. It assumes that the data are free from errors in measurements. If integrity of the data has been violated, the DEA results cannot be interpreted with certainty, because they will affect the efficiency values and the efficient frontier will be shifted. Therefore, it is desirable to build the efficiency frontier on large samples.
Another limitation of the proposed approach is that the performance of an economic unit is measured only in relation to other economic units included in the sample. In other words, only relative rather than absolute performance is described, which shows how successful the innovation activity of the region is compared to other regions, but not compared to the theoretically achievable maximum. However, this limitation is inherent in other approaches to evaluating the performance of innovation in the regions.
Results
The essence of the regional innovation system operation is determined by interaction of its participants who are interested in obtaining greater profits from innovation, along with the optimization or stabilization of the involved resources. The construction of this model allows bringing the research closer to these realities.
A CCR model with constant returns to scale was used to achieve the goals of the first stage. In fact, two models were tested: The resource-focused and the result-focused (Table 2).
| Table 2: Description Of Models Used In The First Stage | |||
| Resource-focused model | Result-focused model | ||
|---|---|---|---|
| Target function | 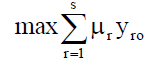 |
Target function | 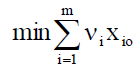 |
| Limitations | 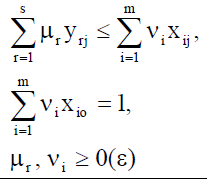 |
Limitations | 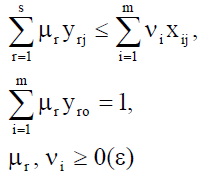 |
Note: x is resources, y is results, ν, µ are weights defined for each DMU.
The statistical reporting data for the Russian region relating to 2014 (collected in 2016) are used in the analysis. The data were collected on the basis of the Federal State Statistics Service website and regional state statistics bodies for all regions, except for the Crimea and the city of Sevastopol.
An economic unit, the performance of which is evaluated (decision-making unit, DMU), is an innovation system of the region that is responsible for transformation of innovation resources into innovation results.
The data related to the estimated resources and results are presented in Table 3. The choice of indicators is determined by the task of the current stage-to evaluate the performance of RIS as a whole, taking the interaction between the entities into account.
| Table 3: Resources And Results Evaluated At The First Stage Of The Study | |
| Resources (2012) | Results (2014) |
|---|---|
| Number of researchers, people Internal costs of the region for research and development, thou. Rub. Share of investment in the gross regional product, % |
Number of advanced production technologies developed in the region Number of advanced production technologies used in the region Ratio of innovation activity (share of innovation-active enterprises in the total number of enterprises) Share of innovative products (goods, works, services) in the total volume of manufactured products (performed works, rendered services), % Share of high-tech products (works, services) in the gross regional product, % |
"DEAFrontier Solver" package based on Microsoft Excel was used for calculations. Table 4 presents 28 regions, for which  , according to the modelling results of using the "DEAFrontier Solver" package i.e., they are efficient. The results of ranking the regions according to two existing ratings in Russia-Russian regional innovation index and Rating of innovative regions of Russia made by the Association of Innovative Regions-were later added to the table (Rating of innovation regions of Russia for the purposes of monitoring and management, 2015). The regions that either belong to the same category on both rating scales or the gap in positions between which does not exceed 10 points, regardless of the category, were marked with colour.
| Table 4: Technically Efficient Regional Innovation Systems | |||
| # | Region | Group by Russian regional innovation index | Group by method of Association of Innovative Regions |
|---|---|---|---|
| 11 | Vladimir region | III (35) | Moderately strong innovators (23) |
| 22 | Kostroma region | IV (75) | Moderately weak innovators (64) |
| 33 | Lipetsk region | II (14) | Average innovators (31) |
| 44 | Moscow region | II (17) | Strong innovators (6) |
| 55 | Tula region | III (42) | Moderately strong innovators (18) |
| 66 | Yaroslavl region | II (22) | Strong innovators (5) |
| 77 | City of Moscow | I (2) | Strong innovators (2) |
| 88 | Nenets autonomous region | Part of the Arkhangelsk region | Weak innovators (81) |
| 99 | Novgorod region | III (60) | Moderately strong innovators (24) |
| 110 | City of Saint Petersburg | I (3) | Strong innovators (1) |
| 111 | Republic of Adygea | III (69) | Moderately strong innovators (65) |
| 112 | Republic of Bashkortostan | II (15) | Moderately strong innovators (15) |
| 113 | Republic of Mari El | III (38) | Average innovators (37) |
| 114 | Republic of Mordovia | II (4) | Moderately strong innovators (20) |
| 115 | Udmurt Republic | III (61) | Moderately strong innovators (29) |
| 116 | Chuvash Republic | II (8) | Moderately strong innovators (19) |
| 117 | Perm region | II (19) | Moderately strong innovators (12) |
| 118 | Nizhny Novgorod region | II (6) | Strong innovators (4) |
| 119 | Penza region | II (10) | Moderately strong innovators (10) |
| 120 | Samara region | II (25) | Moderately strong innovators (14) |
| 221 | Sverdlovsk region | II (13) | Moderately strong innovators (9) |
| 222 | Yamal-Nenets autonomous region | II (26) | Moderately strong innovators (74) |
| 223 | Chelyabinsk region | II (18) | Moderately strong innovators (16) |
| 224 | Altai Republic | III (58) | Moderately weak innovators (75) |
| 225 | Republic of Buryatia | III (40) | Moderately weak innovators (51) |
| 226 | Republic of Tyva | III (72) | Weak innovators (82) |
| 227 | Sakhalin region | III (52) | Moderately weak innovators (50) |
| 228 | Chukotka autonomous region | IV (73) | Moderately weak innovators (73) |
As can be seen from Table 4, the technically efficient regions, first of all, belong to different groups by levels of innovation-driven growth. There is also a discrepancy between the two ratings. Distribution of the technically efficient regional innovation systems by categories characteristic of benchmarking ratings is shown in Figures 1 and 2.

Figure 1. Distribution Of The Technically Efficient Regions By Categories In The Rating Of Innovation-Driven Growth Of The Russian Federation Entities (Issek Nru Hse).

Figure 2. Distribution Of The Regions By Categories In Accordance With The Rating Of The Russian Innovation Regions (Association Of Innovative Regions).
Conclusion
As a result of the conducted analysis, despite the difference in the methodology for rating calculation, strong regions predominate among the technically efficient ones (their number is small, but representation among the efficient regions is significant), as well as moderately strong (second category), which indicates the overall efficiency of the authorities' efforts to conduct innovation policy and high exposure of the innovation environment to it. Attention is drawn to the absence of one of the leaders of both ratings-the Republic of Tatarstan-in the number of the efficient regions.
The number of technically efficient regions also includes the ones that do not belong to the leaders of innovation-driven growth. They are the Republic of Adygea, the Republic of Tyva, the Kostroma region, the Yamalo-Nenets autonomous region and the Chukotka autonomous region. Technical performance means that these regions will be able to adequately increase the results of innovation activities if the resource base is increased.
Unevenness of distribution of the technically efficient innovation regions across Russia is another interesting conclusion that confirms the importance of research of the regional aspect of innovation activity. The highest density falls on the Volga autonomous region, which indicates efficient interaction not only within the regions, but also between them. At the same time, there is only one technically efficient region in the Southern and North Caucasus Federal Districts-the Republic of Adygea.
Discussion
A logical continuation of the research would be to single out two subsystems in the regional innovation system: Knowledge creation subsystem and knowledge commercialization subsystem. These two subsystems are interrelated and function simultaneously, but according to the results of the conducted research, it can nevertheless be said that they could and should be considered as successive stages of the innovation process. This is because commercialization is an integral part of creating an innovative product in the region and is only possible if the knowledge creation subsystem has produced new knowledge and technologies that can bring valuable commercial results. Such results of the knowledge creation subsystem may include the share of investment in the gross regional product; advanced production technologies created in the region or registered patents. These results are further transformed into resources for the knowledge commercialization subsystem.
Acknowledgements
The article is prepared with the support of the Ministry of Science and Education of the Russian Federation (project No. 26.6446.2017/BCh).
References
- Aigner, D., Lovell, ?. & Schmidt, P. (1977). Formulation and estimation of stochastic frontier production function models. Journal of Econometrics, 6, 21-37.
- Banker, R.D., Charnes, A. & Cooper, W.W. (1984). Some models for estimating technical and scale inefficiencies in data envelopment analysis. Management Science, 39, 1079-1092.
- Bonaccorsi, A. & Daraio, C. (2004). Econometric approaches to the analysis of productivity of R&D systems: Production functions and production frontiers. In H.F. Moed et al. (eds.), Handbook of Quantitative Science and Technology Research (pp.51-74). Dordrecht: Kluwer academic publishers.
- Charnes, A., Cooper, W. & Rhodes, E. (1979). Measuring the efficiency of decision-making units. European Journal of Operational Research, 3(4), 429-444.
- Chen, K. & Guan, J. (2012). Measuring the efficiency of China’s regional innovation systems: Application of network Data Envelopment Analysis (DEA). Regional Studies, 46(3), 355-377.
- Coell, N.J., Rao, D.S.P., O’Donell, C.J. & George, E.B. (2005). An introduction to efficiency and productivity analysis: Springer Science Business Media, Inc., 327.
- Cooper, W.W., Seiford, L.M. & Tone, K. (2006). Introduction to data envelopment analysis and its uses: With DEA-solver software and references. New York: Springer.
- Debreu, G. (1951). The coefficient of resource utilization. Econometrica, 19, 273-292.
- Edquist, C. (1997). Systems of innovation: Technologies, institutions and organizations. London: Pinter Publisher.
- Farrell, M.J. (1957). The measurement of productive efficiency. Journal of the Royal Statistical Society, 120(3), 253-290.
- Farrell, M.J. (1957). The measurement of productive efficiency. Journal of the Royal Statistic Society, 120, 253-282.
- Fried H., Lovell C. & Schmidt S. (2008). The measurement of productive efficiency and productivity change. Oxford University Press: New York.
- Fritsch, M. & Slavchev, V. (2006). Measuring the efficiency of regional innovation systems: An empirical assessment. Freiberg Working Papers, 6.
- Griliches, Z. (1984). R&D, patents and productivity. Chicago: University of Chicago.
- Koopmans, T. (1951). An analysis of production as an efficient combination of activities. Activity analysis of production and allocation, monograph No. 13, New York: Wiley.
- Kotsemir, M. (2013). Measuring national innovation systems efficiency-A review of DEA approach. HSE basic research programme working papers. Series: Science, technology and innovation.
- Kudryavtseva, T., Rodionov, D., Kravchenko, V. & Maryta, V. (2016). Special economic zones as an instrument of industrial policy pharmaceutical clusters in Russia. Proceedings of the 28th International Business Information Management Association Conference-Vision 2020: Innovation Management, Development Sustainability and Competitive Economic Growth, 1008-1018.
- Reyting innovatsionnykh regionov Rossii dlya tseley monitoringa i upravleniya [Rating of innovation regions of Russia for the purposes of monitoring and management] (2015). Retrieved August 29, 2017, from http://www.i-regions.org/files/file_103.pdf
- Rodionov, D.G. & Rudskaya, I.A. (2016). Zarubezhnyy opyt ispolzovaniya forsayt-proyektov v strategicheskom razvitii regionov [Foreign practice of using foresight projects in the strategic development of regions]. Global scientific potential, 9(66), 93-100.
- Romer, P. (1990). Endogenous technological change. Journal of Political Economy, 98(5), 71-102.
- Rudskaya, I.A. (2015). Indeks innovatsionnogo razvitiya kak metod izmereniya potentsiala i effektivnosti funktsionirovaniya regionalnykh innovatsionnykh sistem [Index of innovation-driven growth as a method to measure the potential and performance of the regional innovation systems]. In the collection: Restructuring the Russian economy and industrial policy Proceedings of research-to-practice conference with foreign participation, 142-151.
- Zemtsov, S.P. & Baburin, V.L. (2017). Kak otsenit effektivnost regionalnykh innovatsionnykh sistem v Rossii? [How to evaluate the performance of regional innovation systems in Russia?]. Innovations, 2, 60-65
- Fare, R., Grosskopf, S. & Lovell, C.A.K. (1994). Production frontiers. Cambridge: Cambridge University Press.
- Fare, R., Grosskopf, S., Norris, M. & Zhang, Z. (1994). Productivity growth, technical progress and efficiency changes in industrialized countries. American Economic Review, 84, 66-83.