Research Article: 2022 Vol: 21 Issue: 2S
Economic Impact on Financial Efficiency of Microfinance Institutions in the Event of Pre and Post-financial Crisis
Nurazilah Zainal, Universiti Teknologi MARA
Sarah Roslan, Universiti Teknologi MARA
Zuraidah Mohd Sanusi, Universiti Teknologi MARA
Norlaila Md Zin, Universiti Teknologi MARA
Ancella Hermawan, University Indonesia
Keywords:
Financial Crisis, Financial Efficiency, Macroeconomic Conditions, Data Envelopment Analysis, Panel Regression
Abstract
Since the financial crisis of 2007–2009, a very tough situation has been encountered across the financial sector. The crisis has shown that it has hampered economic development, including banking institutions. The effect of the crisis is not excluded from the operations of the Microfinance Institutions (MFIs), as it today constitutes an integral part of the financial system. This paper intends to analyse the pre-crisis and post-crisis financial efficiency levels of the MFIs as the first objective. Next, to examine the effect on the financial efficiency level in both crisis periods upon macroeconomic conditions. Data were collected from 166 MFIs of ASEAN 4 countries from 2000-2007 (pre-crisis) and 2010-2017 (post-crisis), comprising Philippines, Vietnam, Cambodia, and Indonesia. The first phase of the analysis uses Data Envelopment Analysis to determine financial efficiency levels. The second phase employs Multivariate Panel Regression Analysis to examine the effect of macroeconomic conditions towards the level of financial efficiency obtained in the first phase. The first-phase result reveals the post-financial crisis efficiency score is barely higher than the pre-crisis efficiency score. This indicates that MFIs are financially efficient during crisis occurrences and afford to support the operation over a long-term basis. In the second phase, the regression analysis provides mixed findings, both significant and insignificant macroeconomic conditions affecting the financial efficiency of MFIs. The insignificant results show the consequences of the crisis explain some variables were unable to clarify the variation of the first-phase financial efficiency score of MFIs. Generally, the findings of this study will assist the microfinance industry to prepare itself for any potential crisis. This is important with the role of the MFIs in assisting the poor to ensure they are pulled out of a circle of poverty.
Introduction
In this study, financial efficiency fulfills as a proxy to display the performance of MFIs. According to a study conducted by (Vanroose & D’Espallier, 2013), they have found that it is growing a norm for assessing the performance of MFIs in the view of financial efficiency. It retains the MFIs' social position in poverty eradication while simultaneously striving to sustain business activities for a longer period. As several of the earlier studies revealed, financial efficiency approaches for sustainability could be regarded as exemplary practices that coincide with the principle of MFIs (Haq et al., 2010).
In revising the root of the financial crisis from 2007 until 2009, the high default rate in the United States subprime home mortgage business was the evolving factor that contributes to the crisis, since most home creditors were not paying regularly.
According to (Singhania & Anchalia, 2013), the crisis caused a collapse in most of the business, a significant decrease in consumers' incomes, and also a downturn in economic activities, which directly hampered and disrupted ASEAN markets. Numerous researches have reported that the financial crisis has adversely affected the banking industry (Dietrich & Wanzenried, 2011; Beltratti & Stulz, 2012; Berger & Bouwman, 2013). As MFIs today form an essential part of the financial system, the implication also not excepted from the activity of the MFIs. In fact, (Lützenkirchen & Weistroffer, 2012) have discovered the first crucial hindrance in microfinance in 2007.
The performance of MFIs by (Ngo, Mullineux & Ly, 2014) is being affected by the crisis since most poor borrowers are facing challenges in payment of the monthly loan and leading to a decrease in loan portfolio reliability. Savings had to be deferred and many consumers had difficulties paying back (Stephen, 2013). This shows that MFIs face major challenges in their profitability because they cannot manage loan portfolios effectively. That explains why MFIs have declined over ten years the growth in the gross loan portfolio (CGAP, 2011).
According to Mohammed & Farouq (2018), the most significant source of income for sustainable MFIs is financial revenue from the loan portfolio, which explains why prior literature (Lepetit & Nzongang, 2014; Wijesiri et al., 2015) included financial revenue as an indicator to measure MFI's performance. Despite this, the drastic decrease in financial revenue of the MFIs from 2007 until 2009 is observable, as shown in Figure 1 reported by the World Development Indicators. The percentage of financial revenues reported in 2007 was 18.34%, with the figure quickly falling to 16.04% in 2009.

Figure 1: Financial Revenue Of Microfinace Institutions
(Source: The World Bank, 2015 – World Development Indicator)
Even so, there was a minimal attempt to examine the significant differences in the financial performance of MFIs associate with the economic crisis (Bella, 2011; Aemiro & Mekonnen, 2012; Fernandez et al., 2015) as many are targeted at banks and have very few empirical findings available on efficiency in ASEAN countries (Tahir & Tahrim, 2013). With regards to financial efficiency, this issue addressing how MFIs has undergone pre and post-financial crisis.
On top of that, Adonsou & Sylwester (2015) issued the concern that the macroeconomic effects of microfinance have not been previously empirically examined. This was supported by (Buera, Kaboski & Shin, 2012) which also issued the same concern where the study of macroeconomic effects of economy-wide microfinance is largely undiscovered. This announces the next issue where the macroeconomic effects on the financial performance of microfinance throughout the crisis have been enormously unexplored. Therefore, it is undeniably necessary to investigate the shifts in external factors of macroeconomic variables that affect the financial efficiency of the MFIs during pre and post-financial crisis.
To rectify the issue adequately, the study aims at analyzing the financial performance of the MFIs as its first objective in the setting pre and post the financial crisis. Following that, the study also aims to examine the effect of macroeconomic conditions on financial efficiency level during the period of pre and post-financial crisis. The rest of this paper is arranged accordingly. Section 2 includes a review of the theoretical and prevailing literature concerning the financial performance of MFIs and the factors involved. The data, the estimation method, and the model are outlined in Section 3. The conceptual findings are contained in Section 4, and the summaries and conclusions in Section 5.
Theoretical and Literature Framework
Since the introduction by Charnes, Cooper & Rhodes (1978), which later was extended by (Banker, Charnes & Cooper 1984), most researchers and practitioners have taken Data Envelopment Analysis (DEA) as their approach to carrying out evaluations in financial institutions, including in MFIs. In the beginning period, the MFIs were recognized as microcredits, providing a credit delivery system for the poor in general. Wagner & Winkler (2013) disclosed that microfinance began functioning as an institution of subsidy dependence where the allocated funds were regulated by specific donors and administrations. Over the years, microfinance was no more a subsidy receiver and was commercialized in the 1990s from the subsidy scheme to full-scale banking businesses. It was eventually expanded to include a wide range of financial products such as money transfers, insurance, and investments.
Presently, the requirement for MFIs has been financially stable to cater to poor households with continued financial services. The concepts of financially stable in MFIs are different from other financial institutions (Wijesiri et al., 2015) since they demonstrate the capability of MFIs to alleviate subsidy dependency and reinforce their scope by providing financial services to an enormous number of the poor. The study conducted in Bangladesh by Hasan, et al., (2009) has shown that MFIs progressed towards achieving outreach and sustainability between 2001 and 2005, but the trend had worsened in 2006 and 2007. The study indicates that MFIs must concentrate on enhancing financial performance and reducing subsidy reliance.
In recent decades, there has been a comprehensive and thorough study of efficiency for financial institution. Efficiency in definition as described by (Othman et al., 2016) is the ratio of output to input, whereas more output per input unit means better efficiency, meanwhile, maximum output per input unit is optimum efficiency. Noor, et al., (2020) reported that efficiency measuring recognized the company's ability to maximize production and income and minimize its cost at the same time. Othman, et al., (2016) stated that the institution's total performance depending on the four aspects for an efficiency assessment; (1) technical efficiency, (2) efficiency scale, (3) price efficiency, and (4) allocative efficiency. Financial efficiency, as claimed by Zainal (2019), shall be seen as a measure of Technical Efficiency (TE), which assesses a reasonable reduction in the use of input, which can be achieved when the business operates at an optimal frontier, or when the effectiveness of a minimum set of inputs is used to obtain maximum output.
On another note, prior studies show that before disruptions from the crisis made a hard hit, MFIs' performance was stable. These included studies conducted by (Silva & Chávez, 2015; Wijesiri, 2016; Khan, Mustafa & Khursheed, 2018) that showed the recession's severe impact from MFIs including banking and non-banking financial institutions (NBFIs), an absolute gap before the crisis. Taking into account their success years before the crisis, all findings have shown that the MFIs have been in good shape and at their best performance. In parallel, Wagner & Winkler (2013) findings showed that MFIs are heavily involved in the domestic and global capital markets in the pre-crisis years that they achieve higher credit growth. Daher & Le Saout (2012) as well recorded the results in profitability and the years before the crisis of a statistically significant and positive relationship.
Eventually, in the years after the crisis, recent research has shown mixed findings. A decrease in ratio analysis was found by (Khan et al., 2018), which indicates an improvement in the performance of MFIs in years after the crisis. Contrary to banks, Silva & Chávez (2015) reported that MFI's were far more robust to the global financial crisis and claimed that governments are committing to ensuring greater access of countries with better-developed financial systems to financing and sustainability. Wijesiri (2016) described discrepancies in the productivity response of the MFI to the crisis, with Non-Governmental Organizations (NGOs) and cooperatives less disturbed, whereas microfinance banks and NBFIs did suffer badly. The latter is consistent with the findings by (Daher & Le Saout, 2012) and Wagner & Winkler (2013) that their post-crisis findings were too extreme for micro-entrepreneurs to endure.
In most cases, the researchers illustrated the economic growth in terms of real GDP per capita. Studies by (Kar & Swain, 2018; Vanroose & D’Espallier, 2013) as well as (Assefa et al., 2013) provided evidence that the GDP delivers a positive effect that lessens the risk of loan repayment, that the healthiness of the economy encourages more financing activities to be offered by the financial institutions, thus allows the MFIs to grant more credit to poor people. This situation facilitates poor people from setting up their small business, which then will generate returns progressively. Ngo (2012) however, had revealed the negative relationship, which signifies an increase in GDP yields to lower financial performance, immediately after poor households begin to produce a high level of income and have been destitute of poverty. They tend to enhance themselves from the incitement of the MFIs hence become part of the commercial banks. This situation deliver to a lower number of borrowers and subsequently produce an unfavorable impact on the revenue of the MFIs. While Alimi (2015) found no relation between financial performance and economic growth, which corresponds to statistical problems in the data, the insignificant result was presented.
Besides, inflation indicates the purchasing power of money and measured by studying at the Consumer Price Index (CPI) over a period of time. Assefa, et al., (2013), the study found a positive correlation between inflation and the performance of MFIs which suggests the MFIs hardly ever got affected during the period of soaring inflation since the operation in MFIs unusually involved in the financial market. Encouragement in economic activity result in reducing unemployment and facilitate the problems of balance of payment. Contrarily, Cull, Kunt & Morduch (2011) indicates a negative relationship pertaining to inflation, since MFIs nowadays are more involved in the financial market, therefore high inflation might affect the higher cost of inputs that drives to a lower level of revenue. Daher & Le Saout (2012) supports the findings since MFIs do not appropriately forecast an increase in inflation, thus faced with an increase in expenses, which would harm their profitability. Despite that, Ngo (2012) had presented evidence that inflation is insignificant to the performance of the MFIs, and inferred data to be unusual, and that explains for fluctuations in financial performance is unjustified.
Furthermore, the Foreign Direct Investment (FDI) is not solely on the changes of ownership, it typically involves the factors of respectful transfer to capital, including organizational skills, management, and technology enhancement. Vanroose & D’Espallier (2013) revealed that FDI is a significant factor to develop the performance of MFIs, through which a higher FDI contributes to the greater level of profitability of MFIs performance. In the meantime, (Hermes, Lensink & Meesters, 2011; Zainal, 2019) had provided different findings where the results displayed FDI to be negatively and significantly affecting the financial efficiency of MFIs. The large size, technology advancement, and skilled labour that are benefited by the FDI make the situation to be difficult for the MFIs to compete. Daher & Le Saout (2012) also adds, it develops the most significant external risk for MFIs profitability, outstandingly in the appearance of inappropriate asset-liability management. Notwithstanding, Forkusam (2015) found that FDI to be insignificantly related to the financial performance of MFIs. Any differences in the FDI, whether higher or lower FDI, does not affect the financial performance of MFIs.
Accordingly, the study suggests the following hypotheses from the literature:
H1: The level of financial efficiency differs significantly between microfinance institutions in ASEAN 4 countries during pre and post-financial crisis.
H2: Macroeconomic conditions provides a significant different effect to the level of financial efficiency of the MFIs during pre and post-financial crisis.
Data and Research Methodology
The MFI data has been obtained from the Microfinance Info Exchange (MIX) website, which contains detailed financial information from worldwide MFIs (Widiarto & Emrouznejad, 2015; Vanroose & D’Espallier, 2013; Assefa et al., 2013). According to Vanroose & D’Espallier (2013), the MIX market has been widely used in microfinance studies as the largest available database of MFIs.
Data were obtained from targeted South East Asian countries (ASEAN 4) comprising the Philippines, Vietnam, Cambodia, and Indonesia. The main reason for the inclusion of ASEAN 4 in the data analysis is that many are composed of developing countries with a significant number of vulnerable people served by MFIs.
Across nine regions worldwide, over 4,000 MFIs have been recorded to the MIX Market Database, as indicated by Hassan, et al., (2012). Despite that, 166 ASEAN 4 MFIs from 2000 to 2007 (pre-crisis) and from 2010 to 2017 (post-crisis) were presented for this study. This time was chosen based on how MFIs work in pre and post-financial crisis situations. Ultimately, the analysis would contain a total of 1328 observation data.
First Stage: Data Envelopment Analysis (DEA)
As Farrell (1957) proposed the generalization of efficiency, (Charnes, Cooper & Rhodes, 1978) presented the DEA for the first time and simplified it according to their names as the model of the CCR. The CCR model has been evaluated based on Constant Returns to Scale (CRS). The CCR model assumes that the application of the CRS does not have a significant connection between the operation scale and efficiency, where the overall technical efficiency (OTE) is achieved. The assumption of CRS would be acceptable only if all DMUs operated on an optimal scale. But, in practice, institutions or DMUs may face economies or diseconomies of scale (Zainal, 2019). Hence, if it is beliefs CRS, when not all DMUs are running at optimal scale, the evaluated OTE will have a negative impact by Scale Inefficiency (SIE). This presumption was not relevant in imperfectly competitive markets.
Later, in 1984, the improvement in the CCR model has been made by Banker, Charnes, & Cooper with an extended version model that minimizes the CRS assumptions. The generalization derived from their names was the BCC model, which used the Variable Returns to Scale (VRS) to calculate the efficiency of the DMU. The VRS assumptions include the score of Total Efficiency (TE) and segmented into (PTE & Zainal, 2019) suggested that the PTE tests the DMU from the perspective of managerial efficiencies in terms of financial efficiency without being corrupted by scale. In the meantime, the SE determines the appropriate size of the DMU to operate in the form of financial efficiency. The VRS results could thus produce accurate DMU efficiency results in comparison with CRS (Coelli, Rao & Battese, 1998; Sufian, 2004). In this study, the TE is used to calculate the financial efficiency for the MFIs, which reflects the overall score of efficiency.
In the course of CRS and VRS assumptions, Coelli, et al., (1998) suggests that DMU has Scale Inefficiency (SIE) if there are inconsistencies in the scores for a given DMU in the TE. In brief, the SIE is calculated on the basis of the variations between the score of VRS PTE and the score of CRS TE. Indeed, the existence of SIE under VRS, which partially due to an Increasing Return to Scale (IRS) or decreasing return to scale (DRS), is determined by additional DEA problems together with non-increasing return to scale (NIRS) (Kamarudin, Sufian, Md. Nassir & Mohamad Anwar, 2015).
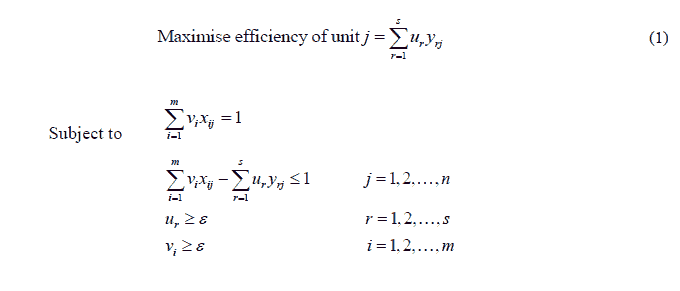
Charnes, et al., (1978) implied that DEA identifies units that can describe various inputs and outputs appropriately. DEA encourages the selection of its own proper weights for each DMU to optimize its efficiency. Therefore the efficiency of Unit j must be less than or equivalent in order to maximize its efficiency. It should be evaluated as (Bader et al., 2008):
As described, financial revenues are the metric used to measure financial efficiency. Table 1 best explains the variables involved in assessing financial efficiency:
| Table 1 Input And Output Variables For Financial Efficiency |
||||||
|---|---|---|---|---|---|---|
| Variables | Mean | Min | Max | SD | No. of DMU | |
| Pre-Crisis Events | ||||||
| Output of MFIs | ||||||
| Financial revenue (in million USD) | 13.31 | 6.765 | 18.63 | 1.48 | 608 | |
| Inputs of MFIs | ||||||
| Total assets (in million USD) | 14.79 | 10.51 | 21.53 | 1.55 | 608 | |
| Operating expense (in million USD) | 12.78 | 8.236 | 18.08 | 1.54 | 608 | |
| Personnel expense (in million USD) | 12.36 | 8.494 | 17.53 | 1.51 | 608 | |
| Post-Crisis Events | ||||||
| Output of MFIs | ||||||
| Financial revenue (in million USD) | 14.37 | 5.106 | 20.3 | 2.37 | 720 | |
| Inputs of MFIs | ||||||
| Total assets (in million USD) | 15.93 | 8.524 | 22.79 | 2.33 | 720 | |
| Operating expense (in million USD) | 13.9 | 7.662 | 19.31 | 2.25 | 720 | |
| Personnel expense (in million USD) | 13.38 | 6.999 | 18.58 | 2.19 | 720 | |
Undoubtedly, the number of input and output variables adopted in the analysis is consistent with the Cooper, et al., (2007) rule of thumb. In both crisis, 166 MFIs surpass financial efficiency input and output variables, the choice of variables is justifiable as m and s inputs and n DMUs, m×s≤n, where 15(3×2), and 15(3×1) (Boussofiane et al., 1991). This confirms the choice of variables for analysing the efficiency of DMUs in the study.
Second Stage: Multivariate Panel Regression Approach (MPRA)
The estimation methods employed in the second stage of MPRA shall involve the pooled Ordinary Least Square (OLS), the Fixed Effect Model (FEM), and the Random Effect Model (REM). Regression models, as reported in (McDonald, 2009), emanate from the White (1980) transformation. Only when the distribution of disturbances is present in regression analysis, which involves the dependent variable of the DEA score, this model is declared strong for heteroskedasticity. However, the Breusch Pagan (BP) and Lagrangian Multiplier (LM) tests should be performed to decide whether the data is suitable for pooling or paneling before the results have been fully focused according to the estimate of pooled OLS approach. Thus, when the p-value of the Breusch and Lagrangian Chi-Square (X^2) multipliers are relevant at 5%, panel data from pooling should be more acceptable (Zainal, 2019).
Gujarati (2004) showed that the panel data revealed a wide range of estimates and inference problems. Because these data include both the cross-sectional and time dimensions, problems such as heteroskedasticity and autocorrelation should be thoroughly recognised. There are various possible problems such as the cross-correlation at the same time of individual units. Therefore, different methods for estimating one of these problems are used to address. The two most important are FEM and REM. Hausman's testing figures include the asymptotic distribution of Chi-Square (X^2). As the null hypothesis is rejected (at 1% to 5% significant levels), it is best suited to use the FEM rather than the REM. However, when the null-hypothesis fail to reject, or at 10% significance, the REM is most suitable to use.
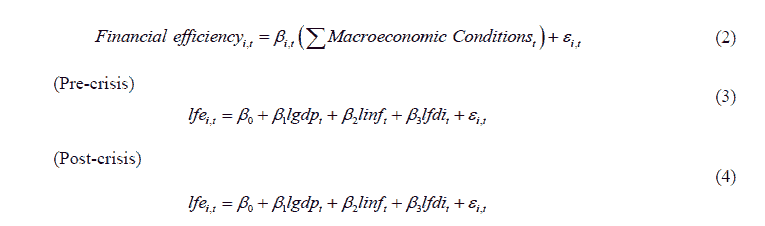
Previous empirical studies suggested that macroeconomic variables were primarily based on economic tradition, where they stressed the importance of external market factors in determining the success of a firm. They generally include inflation, Gross Domestic Product (GDP) per capita, population, unemployment, and interest rates as the external variables. The typical approach to explore the effect of macroeconomic conditions has been examining the influence caused by GDP growth per capita and inflation on the performance of MFIs (Ngo, 2012). The current study will, therefore, pursue previous studies (Vanroose & D’Espallier, 2013; Assefa et al., 2013; Ahlin, Lin & Maio, 2011; Obi et al., 2009) to recognize economy growth, inflation, and foreign direct investment as external factors that have specific effects on the degree of financial efficiency of MFIs. Table 2 displays all the details of external determinants that affect the efficiency of the MFIs.
| Table 2 Details On The Variables Of Macroeconomic Conditions Of Mfis |
|
|---|---|
| Variables | Descriptions |
| Dependent | |
| Financial Efficiency (lfe) | The level of financial efficiency in DEA |
| Independent | |
| Economy growth (lgdp) | The real GDP growth per capita |
| Inflation (linf) | The percentage change in the general level prices of goods and services |
| Foreign direct investment (lfdi) | Measures as a net outflow of inflow as percentage of GDP |
Hence, the general estimation models are then expressed as follows:
Results and Discussions
Financial Efficiency Score between Pre-Financial Crisis and Post-Financial Crisis Events
This section first presents the pre and post-financial crisis results obtained by the DEA analysis of the financial efficiency score. The section will then go through parametric and nonparametric robustness tests before the panel regression is finally carried out.
Table 3 provides the average mean TE for ASEAN 4 countries of their financial efficiency score in the period of pre and post-financial crisis. The average TE of financial efficiency during the post-crisis period equivalent to 83.4% is marginally higher for the whole year (see Table I and Panel R in Table 3) than the pre-crisis period, with TE of financial efficiency was 82.3%. In the pre-crisis period, there is undeniably a slightly high wastage generated, with a total of 17.7% wastage, compared to wastage for the post-crisis period, a total of 16.6% on producing financial efficiency. Table 3 further indicates that both crisis cycles were severely affectable to the management's inefficiency, despite the optimum efficiency of all MFIs in ASEAN 4 countries (as pre-crisis PTIE=10.6%>SIE=7.7%, and post-crisis PTIE=10.8%>SIE=6.4%).
The MFIs were able to record no major differences in the financial efficiency score in ASEAN 4 countries after the financial crisis, with an improvement of 1.07% compared with their levels before the crisis. The MFIs maintain the score for both crisis periods at around 80%. This implies ASEAN 4 MFIs are financially efficient, in terms of sustaining operation in the long term and providing financial services to poor people during the pre-crisis period (2000? 2007) and the post-crisis period (2010?2017).
In fact, in ASEAN 4 countries, MFIs have been proven resilient to the economic crisis since they are not significantly affect their financial efficiency. This condition is demonstrated by an excellent performance of MFIs in ASEAN 4 countries by concentrating more on the production of financial services and products that lead to well-maintained and higher financial efficiency during both crisis periods. This approves that MFIs are financially stable (Nanayakkara, 2012) in ASEAN 4 countries for a longer time and show the ability of the MFI to free themselves from the reliance on subsidies and to strengthen their reach by providing financial services for a large number of poor people (Wijesiri et al., 2015).
| Table 3 Financial Efficiency Score Of Mfis In Asean 4 Countries During Pre-Financial Crisis (2000?2007) And Post-Financial Crisis (2010?2017) |
||||
|---|---|---|---|---|
| Pre-Financial Crisis | Post-Financial Crisis | |||
| Efficiency Measures | No. of DMU | Mean | No. of DMU | Mean |
| Panel A: All Firms 2000 | Panel J: All Firms 2010 | |||
| Technical Efficiency | 76 | 0.848 | 90 | 0.843 |
| Pure Technical Efficiency | 76 | 0.909 | 90 | 0.897 |
| Scale Efficiency | 76 | 0.934 | 90 | 0.941 |
| Panel B: All Firms 2001 | Panel K: All Firms 2011 | |||
| Technical Efficiency | 76 | 0.83 | 90 | 0.804 |
| Pure Technical Efficiency | 76 | 0.901 | 90 | 0.878 |
| Scale Efficiency | 76 | 0.923 | 90 | 0.911 |
| Panel C: All Firms 2002 | Panel L: All Firms 2012 | |||
| Technical Efficiency | 76 | 0.802 | 90 | 0.816 |
| Pure Technical Efficiency | 76 | 0.891 | 90 | 0.876 |
| Scale Efficiency | 76 | 0.902 | 90 | 0.935 |
| Panel D: All Firms 2003 | Panel M: All Firms 2013 | |||
| Technical Efficiency | 76 | 0.795 | 90 | 0.821 |
| Pure Technical Efficiency | 76 | 0.882 | 90 | 0.869 |
| Scale Efficiency | 76 | 0.906 | 90 | 0.947 |
| Panel E: All Firms 2004 | Panel N: All Firms 2014 | |||
| Technical Efficiency | 76 | 0.796 | 90 | 0.841 |
| Pure Technical Efficiency | 76 | 0.885 | 90 | 0.9 |
| Scale Efficiency | 76 | 0.903 | 90 | 0.936 |
| Panel F: All Firms 2005 | Panel O: All Firms 2015 | |||
| Technical Efficiency | 76 | 0.826 | 90 | 0.833 |
| Pure Technical Efficiency | 76 | 0.876 | 90 | 0.902 |
| Scale Efficiency | 76 | 0.947 | 90 | 0.923 |
| Panel G: All Firms 2006 | Panel P: All Firms 2016 | |||
| Technical Efficiency | 76 | 0.829 | 90 | 0.854 |
| Pure Technical Efficiency | 76 | 0.897 | 90 | 0.902 |
| Scale Efficiency | 76 | 0.928 | 90 | 0.949 |
| Panel H: All Firms 2007 | Panel Q: All Firms 2017 | |||
| Technical Efficiency | 76 | 0.859 | 90 | 0.859 |
| Pure Technical Efficiency | 76 | 0.914 | 90 | 0.911 |
| Scale Efficiency | 76 | 0.942 | 90 | 0.945 |
| Panel I: All Years (2000?2007) |
Panel R: All Years (2010?2017) |
|||
| Technical Efficiency | 608 | 0.823 | 720 | 0.834 |
| Pure Technical Efficiency | 608 | 0.894 | 720 | 0.892 |
| Scale Efficiency | 608 | 0.923 | 720 | 0.936 |
Table 4 provides the robustness tests in pre and post-financial crisis times for the financial efficiency of MFIs in ASEAN 4 countries. Parametric t-test results show that the post-crisis TE for financial efficiency is exceeding the TE for pre-crisis (TE post-crisis=0.834>TE pre-crisis=0.823), whereas the pre-crisis PTE is surpassing the PTE for the financial efficiency of post-crisis (PTE pre-crisis=0.894>PTE post-crisis=0.892), and there is no statistically significant correlation between the pre-crisis and post-crisis periods for both TE and PTE measurements. In the meantime, the SE for financial efficiency after the crisis is higher than the SE before the crisis period and differs significantly at 1% (SE post-crisis=0.936>SEpre-crisis=0.923). Further confirmations of the parametric t-test results were made from the non-parametric tests of Mann-Whitney and Kruskall-Wallis. In short, the findings show that no significant difference between the pre-crisis and post-crisis levels of efficiency; the study concluded that the post-crisis period of MFIs in ASEAN 4 countries is not very much affected by the crisis and the score is a little higher than that in the period before the crisis. The following analysis will evaluate the related factors affecting the level of financial efficiency.
Table 4: Robustness Tests for Financial Efficiency Score of MFIs in the Event of Pre and Post-Financial Crisis
| Test Statistics | Parametric Test | Non-parametric Test | |||||
|---|---|---|---|---|---|---|---|
| t-test | Mann-Whitney Test | Kruskall-Wallis Test | |||||
| Mean | Mean Rank | Mean Rank | |||||
| Efficiency Measures | In Times of | ||||||
| TE | Pre-Crisis | 0.823 | -1.251 | 646.43 | -1.584 | 646.43 | 2.51 |
| Post-Crisis | 0.834 | 679.76 | 679.76 | ||||
| PTE | Pre-Crisis | 0.894 | 0.333 | 663.87 | -0.057 | 663.87 | 0.003 |
| Post-Crisis | 0.892 | 665.04 | 665.04 | ||||
| SE | Pre-Crisis | 0.923 | -2.062*** | 635.74 | -2.527*** | 635.74 | 6.384*** |
| Post-Crisis | 0.936 | 688.79 | 688.79 | ||||
Impact of Macroeconomic Conditions on Financial Efficiency of MFIs during the Pre-Crisis Period (2000–2007)
Findings of the panel static regression analysis in times of pre-crisis for the financial efficiency of MFIs are recorded in Table 5. The table shows that economic growth (lgdp) and inflation (linf) are negatively significant at a 1% level in relation to the financial efficiency score based on a panel-static regression analysis. Unlike foreign direct investment (lfdi), it presents no significant relationship to explain the financial efficiency of MFIs during the pre-crisis period.
There is a negative and significant correlation between economic growth (lgdp) and the financial performance of the MFIs. The result suggests during the pre-crisis period, high (low) GDP growth has decreases (increases) the score of financial efficiency of the MFIs. The outcome, therefore, shows that once poor households start to generate high incomes and have been deprived of poverty, they appear to become part of commercial banks because many of the advantages in terms of financial products have been offered as compare to MFIs. This situation slows down MFIs’ demand for microcredit and distracts funding initiatives, thus reducing financial system liquidity. In short, in line with (Ngo's, 2012) findings, the results suggested that increased economic growth bring a negative effect on the financial performance of MFIs.
Table 5 also reveals that the correlation between inflation (linf) and the financial efficiency of MFIs is negative and significant. This shows that the high (low) rate of inflation tends to yield a lower (higher) financial efficiency prior the crisis. The MFIs have been clarified that they can no longer sustain in high inflationary times, thus this condition will directly impacted both the borrowers and the MFIs. Since the high inflation situation increases prices for all commodities, the expenses of the MFIs and the cost of capital are projected to increase. The increase in expenditures and capital costs leads to lower sales, thus distracts the MFIs' funding operations. In concern of borrowers, the high price of products creates the issue in the repayment of the borrowers' loan because their incomes remain stagnant to cover high living costs. These two situations lead to reduced financial stability and have impacted MFIs' financial performance. Similar results were provided by the research conducted by (Cull et al., 2011; Daher & Le Saout, 2012; Ngo, 2012; Zainal, 2019).
On the contrary, the information in Table 5 of the Foreign Direct Investment (LFDI) coefficient does not suggest a significant connection to any financial efficiency improvements in the MFIs that occurred prior the crisis. This result indicates that any difference in the FDI, whether higher (lower) FDI, does not affect the financial performance of MFIs. The finding of this insignificant correlation coefficient is consistent with research done by (Forkusam, 2015; Claessens et al., 2001).
| Table 5 Result Of Panel Static Regression Analysis On Financial Efficiency In The Event Of Pre-Financial Crisis (2000?2007) |
|||
|---|---|---|---|
| Variables | Model 1 | ||
| OLS | REM | FEM | |
| Constant | -2.13 | -5.210*** | -8.020*** |
| -0.195 | -0.205 | -0.248 | |
| lgdp | 2.210*** | -0.41 | -2.940*** |
| -0.019 | -0.017 | -0.02 | |
| linf | 1.64 | 0.24 | -2.020*** |
| -0.023 | -0.021 | -0.023 | |
| lfdi | -0.39 | -0.15 | -1.28 |
| -0.028 | -0.026 | -0.028 | |
| Adjusted R2 | 0.091 | 0.071 | 0.057 |
| BP & LM x2 | 303.000*** | ||
| Hausman x2 | 36.330*** | ||
| Mean VIF | 1.2 | ||
| No. of Obs. | 608 | 608 | 608 |
Impact of Macroeconomic Conditions on Financial Efficiency of MFIs during the Post-Crisis Period (2010–2017)
The macroeconomic factors, according to Table 6, have significant as well as insignificant effects as an external factor to clarify the MFI's post-crisis financial efficiencies. Through the panel's static regression analysis, no significant link between economic growth (LGDP) and inflation (LINF) are formed in determining the score of the financial efficiency of the MFIs. Despite this, the variance of the financial performance of the MFIs is negatively associated with the Foreign Direct Investment (LFDI) at a 1% significance level.
As can be seen in Table 6, the result indicates the economy growth (LGDP) gives no significant relationship towards the financial efficiency of the MFIs for the post-crisis period. This indicates that the higher (lower) GDP growth failed to explain the financial efficiency of the MFIs. This result indicates that in subsequent crisis events, the effect on the financial efficiency of the MFIs was due to movement in GDP variables were unusual. The crisis is likely to cause the variance in financial performance of MFIs cannot be explained. This result is in line with (Alimi, 2015) that discovered the same insignificant finding.
In the same manner, Table 6 also revealed that inflation (LINF) variable and financial efficiency are not significantly correlated. This demonstrates that, any increases (decreases) in inflation does not justify the variation in financial efficiency of the MFIs for the post-crisis period. The sturdy impact of the crisis is likely to cause the inflation data to be uncommon and become the reason for the variations in financial efficiency to be unjustified. The result is found to be similar with the study from (Zaidi et al., 2008; Ngo, 2012).
On the other hand, as reported in Table 6, the foreign direct investment (LFDI) is negatively correlated to the MFIs’ financial efficiency at 1% significant level. The result justifies the more (lesser) number of the FDI being involved, the lower (higher) the score of efficiency level. This is because a more open country with FDI distract the stability of the MFIs, since the large size, technology advancement, and skilled labour that are benefited by the FDI make the situation to be difficult for the MFIs to compete. Amidst constant demand, the financing product provided by the MFIs will oversupply due to the domination of the FDI in the financial market, hence, the sustainability of the MFIs seems can no longer be maintained in the acceleration of the FDI. To add, the reduction of input labour due to labour switch to join the FDI leads to inefficiency in producing outputs and eventually cause lower revenue to the MFIs, hence provide poor financial performance to the institutions. Findings by (Hermes et al., 2011; Ahlin, et al., (2011); Zainal (2019) supported the grounds.
| Table 6 Result Of Panel Static Regression Analysis On Financial Efficiency During The Post-Financial Crisis (2010?2017) |
|||
|---|---|---|---|
| Variables | Model 2 | ||
| OLS | REM | FEM | |
| Constant | -1.48 | -2.460*** | -4.360*** |
| -0.242 | -0.235 | -0.361 | |
| LGDP | -1.48 | -1.3 | -1.02 |
| -0.059 | -0.048 | -0.047 | |
| LINF | -2.340*** | -1.14 | 0.96 |
| -0.016 | -0.014 | -0.015 | |
| LFDI | 0.96 | -0.12 | -1.990*** |
| -0.013 | -0.017 | -0.023 | |
| Adjusted R2 | 0.03 | 0.025 | 0.015 |
| BP & LM x2 | 260.670*** | ||
| Hausman x2 | 32.360*** | ||
| Mean VIF | 1.26 | ||
| No. of Obs. | 720 | 720 | 720 |
Eventually, the outcomes of the study reach the following hypotheses:
H1: The level of financial efficiency differs significantly between microfinance institutions in ASEAN 4 countries during pre and post-financial crisis.
H2: Macroeconomic conditions provide a significant different effect to the level of financial efficiency of the MFIs during pre and post-financial crisis.
Conclusions and Recommendations
H1 assuming that the level of financial efficiency differs significantly between microfinance institutions in ASEAN 4 countries in the period before and after the financial crisis, is achieved when the mean financial efficiency TE is slightly higher during the post-financial crisis (83.4%) than the mean TE in the pre-financial crisis (82.3%). This verifies that, in the post-crisis period from 2010 to 2017, the ASEAN 4 MFIs are resilient and not impacted in the sense of financial performance by the 2007-2009 crisis. The outcomes also revealed that financial efficiency in pre-crisis years have a higher waste of input than inputs wastage in post- crisis periods for financial efficiency of the MFIs. In both crisis periods, the main cause of inefficiency in financial efficiency was the management's inability to fully utilise resources. When in fact, the findings demonstrate that all MFIs in ASEAN 4 countries operate at an optimum level of efficiency.
H2 is also fulfilled as macroeconomic conditions have their effects to be significantly different on the financial efficiency of the MFIs in times before and after the financial crisis. The study shows a different direction to affect the financial performance of the MFIs given the macroeconomic conditions that serve as an external determinant. The MFIs have struggled to survive in good economic conditions and high inflation during the pre-crisis period, while foreign direct investment does not provide any connection. Conversely, the presence of FDI after the crisis distracts the MFIs' output, but there is no connection between economic growth and inflation.
By addressing specific intervals in the latest literature, the results of this study will add value to microfinance sector recognition, in particular the lack of a comprehensive study into the evaluations of the MFIs in pre and post-financial crisis times in ASEAN countries. The study will provide substantial insight into MFIs’ long-term sustainability and equipment to prepare themselves for the possible conflicting crisis in the future. This is crucial in continuing support for the poor, with a view to alleviating poverty among the poor, in line with the actual purpose of the MFIs.
The study also has a practical meaning for the management of MFIs that are aimed at achieving long-term financial efficiency. The results of this research will assist the management of MFIs in their decision-making to enhance the financial performance of MFIs. This includes an adjustment to the current economic situation of its macroeconomic conditions. It will eventually delivers the management of the MFIs the precautionary measures to prevent any economic vulnerability which can distract the development of microfinance. These could direct the institutions management to follow effective policies to improve the efficiency of the institutions.
The following are the limitations of this study that offer potential research opportunities. In the case of a financial crisis, the study only analyses the impact of the macroeconomic conditions on the financial aspects of the MFIs. In this comparative financial crisis analysis, many more contributing factors could be examined. This limitation should be taken into account by future researchers, among many case studies, including the institutional risk effect and the monetary policy effect. In addition, the concept of inputs and outputs for financial efficiency analysis is based solely on a production approach that helps to ease the bias resulting. Additional research should be done in an intermediate approach to assessing the MFI's efficiency. Furthermore, only a non-parametrical DEA approach is adopted by the method of this study. This study may therefore expand research for the assessment of financial efficiency through parametric approaches or by typical financial ratios such as Stochastic Frontier Analysis. The Generalized Method of Moments (GMM) estimation method of panel regression analysis can be used to further strengthen the current study to develop the intended connections in future research. The GMM approach to persistence and endogenous issues provides clear assessments of different structural and economic conditions.
References
Aemiro, T., & Mekonnen, D. (2012). The financial performance and sustainability of microfinance institutions during the current financial crisis: The case of Amhara Credit and Saving Institution (ACSI) in Ethiopia.
Ahlin, C., Lin, J., & Maio, M. (2011). Where does microfinance flourish? Microfinance institution performance in macroeconomic context.Journal of Development Economics, 95(2), 105-120.
Alimi, R.S. (2015). Financial deepening and economic growth: A System GMM Panel Analysis with application to 7 SSA Countries.Munich Personal RePEc Archive (MPRA).
Assefa, E., Hermes, N., & Meesters, A. (2013). Competition and the performance of Microfinance institutions.Applied Financial Economics, 23(9), 767-782.
Adonsou, D.F., & Sylwester, K. (2015). Macroeconomic effects of microfinance: Evidence from developing countries.Journal of Economic Insight (Formerly the Journal of Economics (MVEA)), 41(1), 21–35.
Bader, M.K.I., Mohamad, S., Ariff, M., & Hassan, T. (2008). Cost, revenue, and profit efficiency of Islamic versus conventional banks: International evidence using data envelopment analysis.Islamic Economic Studies, 15(2), 23-76.
Banker, R.D., Charnes, A., & Cooper, W.W. (1984). Some models for estimating technical and scale inefficiencies in data envelopment analysis.Management Science, 30(9), 1078-1092.
Beltratti, A., & Stulz, R.M. (2012). The credit crisis around the globe: Why did some banks perform better?Journal of Financial Economics, 105(1), 1-17.
Berger, A.N., & Bouwman, C.H.S. (2013). How does capital affect bank performance during financial crisesα. Journal of Financial Economics, 109(1), 146-176.
Boussofiane, A., Dyson, R.G., & Thanassoulis, E. (1991). Applied data envelopment analysis.European Journal of Operational Research, 52(1), 1-15.
Brunnermeier, M.K., & Oehmke, M. (2013). Bubbles, financial crises and systemic risk. In Handbook of the Economics of Finance.
Buera, F.J., Kaboski, J.P., & Shin, Y. (2012). Nber working paper series the macroeconomics of microfinance. Retrieved from https://doi.org/10.1093.
CGAP. (2011). Cross-border funding of microfinance.
Charnes, A., Cooper, W.W., & Rhodes, E. (1978). Measuring the efficiency of decision making units.European Journal of Operational Research, 2, 429-444.
Claessens, S., Kunt, D.A., & Huizinga, H. (2001). How does foreign entry affect domestic banking markets?Journal of Banking & Finance, 25, 891-911.
Coelli, T., Prasada Rao, D.S., & Battese, G. (1998). An introduction to efficiency and productivity analysis, 3(2). Kluwer Academic Publishers.
Cooper, W.W., Seiford, L.M., & Tone, K. (2007). Data envelopment analysis: A comprehensive text with models, applications, references and dea-solver software.
Cull, R., Kunt, D.A., & Morduch, J. (2011). Does regulatory supervision curtail microfinance profitability and outreach? World Development, 39(6), 949-965.
Daher, L., & Le Saout, E. (2012). The determinants of the financial performance of microfinance institutions: Impact of the global financial crisis.Strategic Change: Briefings in Entrepreneurial Finance Strategic, 21, 83-106.
Di Bella, G. (2011). The impact of the global financial crisis on microfinance and policy implications.
Dietrich, A., & Wanzenried, G. (2011). Determinants of bank profitability before and during the crisis: Evidence from Switzerland.Journal of International Financial Markets, Institutions and Money, 21(3), 307-327.
Farrell, M.J. (1957). The measurement of productive efficiency. Journal of the Royal Statistical Society.Series A (General), 120(3), 253-290.
Forkusam, A.N. (2015). Does financial globalization affect microfinance mission drift? Empirical Evidence from Sub-Saharan Africa.
Gujarati, D.N. (2004). Basic econometric, (Fourth Edition). In The McGraw-Hill Companies. The McGraw-Hill Companies.
Haq, M., Skully, M., & Pathan, S. (2010). Efficiency of microfinance institutions: A data envelopment analysis.Asia-Pacific Financial Markets, 17(1), 63-97.
Hasan, M.M., Hassan, M.K., & Uddin, M.R. (2009). Local government investment Outreach and sustainability of Microfinance institutions: A case study of euro, Bangladesh.Journal of Social, Political, and Economic Studies, 34(3), 318-346.
Hassan, M.K., Sanchez, B., & Ngene, G. (2012). Scales and technical efficiencies in Middle East and North African (MENA) micro financial institutions.International Journal of Islamic and Middle Eastern Finance and Management, 5(2), 157-170.
Hermes, N., Lensink, R., & Meesters, A. (2011). Outreach and efficiency of microfinance institutions. World Development, 39(6), 938-948.
Kamarudin, F., Sufian, F., Md. Nassir, A., & Anwar, N.A. (2015). Technical efficiency and returns to scale on banking sector: Empirical evidence from GCC Countries. Pertanika Journal of Social Sciences and Humanities, 23, 219–236.
Kar, A.K., & Swain, B.R. (2018). Competition, performance and portfolio quality in microfinance markets.The European Journal of Development Research, 30(5), 842-870.
Khan, A.A., Mustafa, F., & Khursheed, A. (2018). Impact of global financial crisis on socially innovative microfinance institutions in Pakistan.Journal of Accounting, Finance and Auditing Studies, 4(3), 67-86.
Lützenkirchen, C., & Weistroffer, C. (2012). Microfinance in evolution. Deutsche Bank Research.
McDonald, J. (2009). Using least squares and to bit in second stage DEA efficiency analyses. European Journal of Operational Research, 197, 792-798.
Mohammed, A., & Farouq, S.M. (2018). The causes of default loans risk in microfinance institutions in Ghana: Case study of some selected microfinance institutions in kumasi and accra. Global Journal of Management and Business Research, 18(2).
Mohd Noor, N.H.H., Bakri, M.H., Yusof, W.Y.R., Noor, N.R.A., & Zainal, N. (2020). The impact of the bank regulation and supervision on the efficiency of Islamic banks.Journal of Asian Finance, Economics and Business, 7(11), 747-757.
Nanayakkara, G. (2012). Measuring the performance of micro financing institutions: A new approach. South Asia Economic Journal, 13(1), 85-104.
Ngo, T.V., Mullineux, A.W., & Ly, A.H. (2014). The impact of scale of operation on financial performance in microfinance. Eurasian Economic Review, 4(2), 177-198.
Ngo, T.V. (2012). Capital structure and microfinance performance: A cross-country analysis and case study of vietnam (Issue January).
Obi, B., Nurudeen, A., & Wafure, O.G. (2009). an empirical investigation of the fisher effect in Nigeria: A co-integration and error correction approach. International Review of Business Research Papers, 5(5), 96-109.
Othman, F.M., Zamil, N.A., Rasid, S.Z.A., Vakilbashi, A., & Mokhber, M. (2016). Data envelopment analysis: A tool of measuring efficiency in banking sector. International Journal of Economics and Financial Issues, 6(3), 911-916.
Lepetit, P.I., & Nzongang, J. (2014). Financial sustainability and poverty outreach within a network of village banks in Cameroon: A multi-DEA approach. European Journal of Operational Research, 234(1), 319-330.
Fernandez, S.I., Olmo, T.B., Gutiérrez, L.C., & Azofra, S.S. (2015). Crisis in microfinance institutions: Identifying problems. Journal of International Development, 27(7), 1058-1073.
Silva, A.C., & Chávez, G.A. (2015). Microfinance, country governance, and the global financial crisis. Venture Capital, 17(1–2), 191-213.
Singhania, M., & Anchalia, J. (2013). Volatility in Asian stock markets and global financial crisis. Journal of Advances in Management Research, 10(3), 333-351.
Stephen, M. (2013). Microfinance and the Global Financial Crisis (GFC): Towards a sustainable solution for the poor in Africa. African Journal of Business Management, 7(35), 3602-3608.
Sufian, F. (2004). The eficiency effects of bank mergers and acquisitions in a developing economy: Evidence from Malaysia. International Journal of Applied Econometrics and Quantitative Studies, 1(4), 53-74.
Tahir, I., & Tahrim, S. (2013). Efficiency analysis of microfinance institutions in ASEAN: A DEA Approach. Business Management Dynamics, 3(4), 13-23.
The World Bank. (2015). World development indicators | DataBank. In DataBank. Retrieved from.
Vanroose, A., & D’Espallier, B. (2013). Do microfinance institutions accomplish their mission? Evidence from the relationship between traditional financial sector development and microfinance institutions’ outreach and performance. Applied Economics, 45(15), 1965-1982.
Wagner, C., & Winkler, A. (2013). The Vulnerability of microfinance to financial turmoil - evidence from the global financial crisis. World Development, 51, 71-90.
White, H. (1980). A heteroskedasticity-consistent covariance matrix estimator and a direct test for heteroskedasticity. Econometrica, 48(4), 817-838.
Widiarto, I., & Emrouznejad, A. (2015). Social and financial efficiency of Islamic microfinance institutions: A data envelopment analysis application. Socio-Economic Planning Sciences, 50, 1-17.
Wijesiri, M. (2016). Weathering the storm: Ownership structure and performance of microfinance institutions in the wake of the global financial crisis. Economic Modelling, 57, 238-247.
Wijesiri, M., Yaron, J., & Meoli, M. (2015). Performance of microfinance institutions in achieving the poverty outreach and financial sustainability: When age and size matter? Munich Personal RePEc Archive, 69821.
Zaidi, S.A., Farooqi, M.S., & Naseem, A. (2008). The impact of inflation on microfinance clients and its implications for microfinance practitioners. Pakistan Microfinance Network, 4(12).
Zainal, N.B. (2019). Impact of firm characteristics, macroeconomic conditions, bank regulation and supervision on social and financial efficiency of microfinance institutions. In Universiti Putra Malaysia, (1). Universiti Putra Malaysia.
Received: 16-Oct-2021, Manuscript No. ASMJ-21-7664; Editor assigned: 19-Oct-2021, PreQC No. ASMJ-21-7664 (PQ); Reviewed: 03-Nov-2021, QC No. ASMJ-21-7664; Revised: 10-Nov-2021, Manuscript No. ASMJ-21-7664; (R); Published: 16-Nov-2021