Research Article: 2023 Vol: 26 Issue: 4S
Efficiency evaluation into the European Union budget and its net beneficient
Antonio Sanchez Bayon, King Juan Carlos University
Francisco Javier Sastre, ESIC Business and Marketing School
Miguel A. Alonso-Neira, King Juan Carlos University
Citation Information: Sanchez-Bayon, A., Sastre, F.J., & Alonso-Neira, M.A. (2023). Efficiency evaluation into the European union budget and its net beneficient. Journal of Legal, Ethical and Regulatory Issues, 26(S4), 1-23.
Abstract
This qualitative study, according to the heterodox approaches, assessed the leading beneficient state under the European Union budget system. For this purpose, the study utilized the multiannual financial framework reports between 2014-2020, which dealt with more than 700 indicators, measuring success against more than 60 general objectives and more than 220 specific objectives in the performance framework. Therefore, trade globalization, political economy, economic history, social contribution by the European union budget and international economics under new-institutional economics have been evaluated in this process. Assessment outcomes found that poorer member states are the net beneficient regarding the European union budget's net balance and financial corrections. However, Germany is the leading beneficient of the European union budget system as it has extended trade to all along the border of the European union without tariffs and has become a more cost-effective economy against the outside economies (like the United States of America or China) of the European union territory. Thus, the current study suggested that nations under the European union budget system should invest more in sustainable production to get real-time benefit from the European union integration.
Keywords
European Union Budget, European Union, Trade Globalization, Net-Beneficent, Heterodox Approaches.
Introduction
The current European integration process started in the 1950’s; however, the Economic and Monetary Union (EMU) began in the 1990’s, implementing three main stages over a period of nine years. The first stage involved the free movement of capital inside the European Union (EU), a growing structural fund to reduce the inequalities between member states and the beginning of economic convergence. During the second stage (1994), the European Monetary Institute (EMI) introduced rules to curb national budget deficits, among other implementations. Finally, the Euro emerged in 1999; a new currency was adopted by eleven countries, including Austria, Germany, Belgium, Finland, France, Greece, Ireland, Italy, Luxembourg, the Netherlands, Portugal and Spain. The European Central Bank (ECB) offices takeover the EMI and took responsibility for monetary policy. In the upcoming years, other countries have since joined the monetary union. Slovenia joined the euro area in 2007, followed by Cyprus and Malta in 2008, Slovakia in 2009, Estonia in 2011, Latvia in 2014 and Lithuania in 2015, making 19 EU countries in total in this regard.
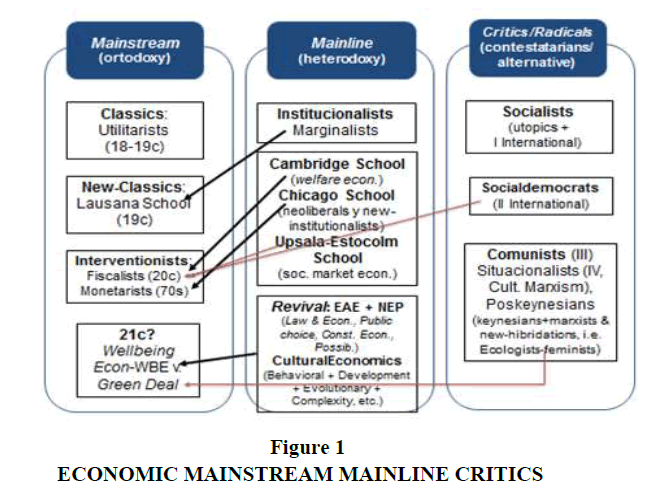
The Maastricht Treaty in 1992 summed up the convergence criteria for joining the European Monetary Union-EMU. This meant that countries must comply with specific economic conditions to ensure economic convergence (also, there was a renewal in economic thought and paradigm switch (Figure 1) (Arnedo et al., 2021; Butzen et al., 2006).
Thus, five main Maastricht convergence criteria have been set for this purpose including price stability (Consumer Price Index-CPI) not higher than 1.5% above the three bestperforming Member States), sound public finances (Government deficit not higher than 3% of Gross Domestic Product-GDP), sustainable public finances (Government debt not higher than 60% of GDP), the durability of convergence (long term interest rates not higher than 2% above the average of three Member States with the lowest inflation rates), and exchange rate stability (must remain within the authorized margin of fluctuation for 2 years) (Cipriani, 2010).
The introduction of the euro (as bills and coins) affected commodities prices in 2002. The overall inflation rate was 2.3%, directly linked to introducing the euro banknotes and coins. However, some argue that this only affected inflation by 0.3%. What spurge inflation mainly in this period was the fact that oil prices rose, along with high increases in fruit and vegetable price. However, the negative expectations, some retailers taking advantage and the price level in national currency frozen in time were mainly the real reasons for inflation in his period. Thus, the financial integration in the EU had a good impact. Furthermore, economies of scale resulted from the large variety of financial products at lower cost. It enhanced the transmission of monetary policy impulses and contributed to safeguarding financial stability and smoothing the payment system's operation (European Commission, 2021).
Thus, the European financial area comprises all the financial markets, institutions and instruments in the different countries that make it up and is part of the globalization of financial markets. As a result, the intended single European market is diluted in the global financial markets and takeovers of banks and companies by European operators occur equally within and outside the EU. Overall, by 2010 GDP was higher in the EU than in the USA and so were exports, gross savings and gross fixed capital formation.
Albeit a few nations’ commitments are more significant than others, each member state appreciates the advantages of the EU financial plan. As well as living in a landmass where individuals can move unreservedly through 27 nations, tiny and huge organizations have free admittance to a market of 500 million purchasers. Better streets in Spain mean a French transporter can convey its items to purchasers more quickly and securely. European examination programs unite the best personalities in the landmass to deal with answers for major cultural issues.
In the landmarks, the European Agricultural Fund for Rural Development (EAFRD) and the European Maritime and Fisheries Fund (EMFF) provide support of €12.3 and €1.6 billion, respectively. Spain is also a beneficiary of other EU programs, such as the connecting Europe facility, which allocated €1 billion to projects on strategic transport networks, horizon 2020, which allocated EU funding worth €4.2 billion (including to 1,800 Small and Medium-Sized Enterprises-SMEs) and Competitiveness of Enterprises and Small and Medium-sized Enterprises (COSME) which unlocked €4.1 billion in loans to 98,913 SMEs (European Commission, 2011).
EU money aids in the mobilization of substantial private investment. By the end of 2018, programs sponsored by the European Structural and Investment Funds (ESI Funds) had mobilized an extra EUR 2 billion-3 billion in loans, guarantees and equity, accounting for 7% of the total agreed allocations. EU funding has invested significant money in measures supporting the Sustainable Development Goals-SDGs. The European structural and investment funds support 13 of the 17 SDGs in Spain, with up to 96% of investment going toward achieving these goals. Thus, although there were winners and losers from introducing the euro of the European union as a whole, the current study attempted to identify the real-time benificient of the system considering the EU budget as only factor (European Union, 2021).
Material and Methods
Key Ideas on the EU and its Finance
The recent world events in Europe have been a clear example that its states do not share the same vision of Europe's role in the global society (Gutteridge, 2016). Moments make it clear that the European integration process was as tricky as it is necessary, especially when the process of globalization (that Europe is experiencing) appears more or less defined in its economic dimension. Nonetheless, the same is not true of its legal dimension today since the concept of the state as a legal phenomenon presupposes the existence of a territory where the human community is politically organized. Thus, different social groups are prone to be affected by EU integration. It is likely that, unless corrective action is taken, social groups (excluded from the benefits of transition and globalization) will also be excluded from these benefits. In the same case, the stabilization of democracy and democratic institutions can be seen as one of the main political advantages of EU accession. More generally, the stabilization of human rights and the rule of law (Garcia-Vaquero et al., 2021). For Bulgaria and Romania, in particular, the political benefits of accession have been cited as key, reflecting the slow progress in achieving democratic stability in these two countries.
The European union has created a legal system whose origins are in international law. However, once this phase is over, the Union moves on to another stage, which is more like domestic than international law models. Therefore, the European union is not an international organization or a state; however, it is in the process of forming a new political-legal structure. To legitimize the actions of the EU institutions, the proposal to bring them closer to parliamentary or semi-parliamentary democracies, i.e., to strengthen the powers of the European parliament and to have the president of the commission elected directly by the ballot box or indirectly through the European parliament, has been used time and again to solve the EU's notorious democratic deficit (Huerta et al., 2021).
The Uniqueness of the European Union
The European union arose from a desire to put a stop to the frequent and violent clashes between neighbours that had culminated in world war II (European Union, 2021). The European Coal and Steel Community (ECSC) was founded in the 1950’s as the first step toward a European economic and political union to ensure long-term peace. Belgium, France, Germany, Italy, Luxembourg and the Netherlands are the six original members. The cold war between East and West dominated this time period. The treaty of Rome, which established the European Economic Community (EEC) or common market, is signed in 1957 (Iram et al., 2020).
The budget of the EU is the expression of the Union's policies and the basis for its political activities. It defines the financial possibilities for action and gives an idea of the real will to pursue and achieve the objectives of the EU. Even more trade liberalization, which should improve competitiveness and boost exports; increased foreign investment inflows. This could provide needed capital, technology and skills; and access to EU funds, which could help upgrade infrastructure and boost regional development, are some of the main benefits. All these benefits, in turn, should boost growth, raise living standards and reduce regional disparities. EU accession will also bring higher environmental standards, with the green deal (Kashnitsky et al., 2020; Newman, 2001), also before (Romero, 2001).
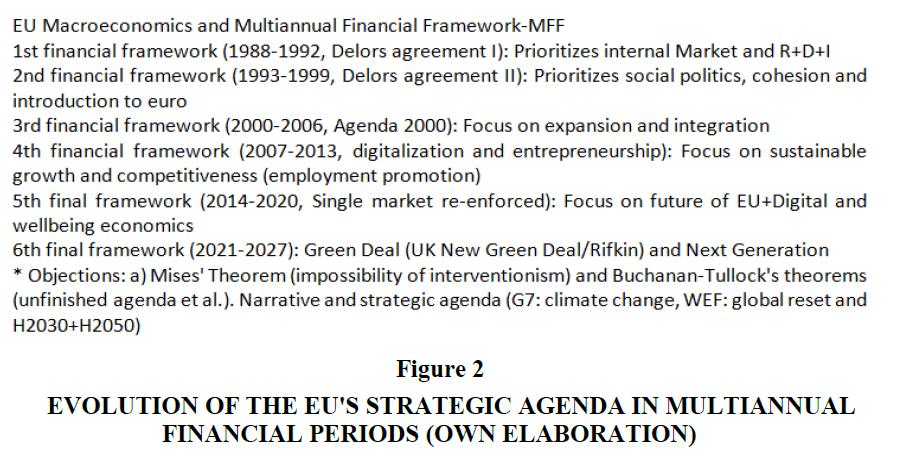
Thus, the budget must respect principles unity (must be a single document covering all the EU’s revenue and expenditure); universality (must not possible to earmark revenue for specific expenditure and on the other hand, the amount of revenue and expenditures must appear in details); and annuity (the budget is voted for one year, but into the Multiannual Financial Framework-MFF) (Figure 2).
The EU does not levy any taxes of its own and is financed by a system of own resources. A distinction is made between four own resources (revenue collected under community policies and which does not come from the member states) (Sanchez-Bayon, 2014). State sovereignty is not absolute either internally or externally, since in both cases it is limited by law (internal or international). However, all international legal instruments that can bind states have a common characteristic: Each sovereign state is free to assume compliance with a specific regulation: A treaty, a convention, a resolution, etc. This is precisely the major difference between the EU and any international organisation, since the union is capable of creating binding law for its member states (Sanchez-Bayon, 2014).
The distance between the EU institutions and the peoples of the states that form part of the union has been inherent to the integration process itself. The first and not unimportant reason, may be that if the integration process had been democratic it would most likely not have begun. The recent referendum experiences, fifty years later, serve as a point of reference to prove that public opinion in the states is divided 50/50 in favour and against the integration process. In other words, even if the process of how the union came into being is disregarded and believing that its formation process is no different from other structures (the organisation is first created and then works from it to get citizens to join it) what seems clear is that this has not been done, at least not sufficiently, in the EU. In the first years of the EU's existence, the objective was to convince European elites of the need for and advantages of the new order and the commission's attempts to reach out to citizens through social policies, which began in the 1960’s, met with opposition from the governments of the member states (Sanchez-Bayon, 2020).
Role of International Organisations
Relations between the EU and international organisations can be systematically articulated through the following three channels. The simplest and most primitive is based on relations of an administrative nature between the EU (formerly the European community or European economic community) and international organisations, with basic obligations to exchange information, based, at first, on mere exchanges of letters, which have gradually evolved towards more complex conventional formulas. An “ius ad tractatum” with a complex and variable impact, depending on the case, which has achieved a spectacular development taking into account that the union is not a state subject. Another means of relations between the EU and international organisations is the sending of representatives of the EU-currently with diplomatic status, as well as the reception of representatives with this rank from third states and other international organisations.
The EU's “ius legationis” has been progressively strengthened, giving it greater visibility in the international organisations to which it is accredited and from which the United Kingdom has benefited until its withdrawal from the union. Some factors to examine in order to gain a full understanding of the evolution and challenges of EU participation in international organisations can be summarised as follows: The EU seeks to acquire membership in an international organisation not only because it has an interest in the field developed in the body in question, but also because it possesses competences in it, generally on a shared basis with its member states. The EU's membership in an international organisation is not only a question of having an interest in the field developed in the body in question, but also because it possesses competences in it, generally on a shared basis with its member states. Secondly, the EU decides and influences the legal developments of numerous organizations in accordance with its postulates and rules, with greater consistency in cases where it adopts common positions agreed with its member states-if participation in the international organization is mixed or even if they participate only with the EU as an observer, with greater or lesser intensity depending on the union's competences (EU action also has an impact on the activities of the UN general assembly or the human rights council). This is irrespective of the fact that in most cases the acts adopted in the organizations do not have binding legal force. The lack of binding force does not prevent the soft law emanating from the Intergovernmental Organizations (IGOs) from having an impact on the EU legal order, as well as on the international legal order. The normative interaction between the EU and international organizations occurs in both directions (Sanchez- Bayon et al., 2018). The commission’s management process is presented in table below (Table 1).
| Table 1 Perspectives of the Commission and the European Court of Auditors | ||
| Commission | European court of auditors | |
| Roles | Provide annual management assurance | Provide annual management assurance |
| Identify weaknesses and take action on a multiannual basis | Identify weaknesses and take action on a multiannual basis | |
| Protect the EU budget | Protect the EU budget | |
| Level of granularity | Error rate for the EU budget as a whole and individual error rates for each department and policy area under headings 1 to 5, plus for revenue | Error rate for EU budget as a whole and individual error rates for headings 1a, 1b, 2 and 5, plus for revenue |
| Error rates calculated per policy area, programme and/or relevant (sub)segments | Expenditure and revenues of the year | |
| Expenditure and revenue of the year (or 2 years for research) with a multiannual perspective | ||
| Multiannuality | Two error rates: Risk at payment and risk at closure | One error rate (most likely error) |
| Multiannuality prospectively taken into account for the risk at closure through estimated future corrections for all programmes | Multiannuality retroactively taken into account, only through financial corrections implemented for closed programmes | |
The most important indicators from the program statements are presented in the program performance overview. It is important to remember that the indicators only provide a snapshot of each program's overall performance and accomplishments. Only by taking into account the exact implementation circumstances will you be able to make an informed decision, which includes both, qualitative and quantitative factors, can completely supported statements about the eventual performance of programs be made. This is something the commission performs on a regular basis as part of its spending program reviews. Thus, the most recent available performance data is used. This largely covers reported achievements measured at the end of 2019 for the commission's directly managed programs. The figures recorded and reported by member states of the situation at the end of 2018 are shown in the programs under shared management. The indirect management programs provide a mixed picture: Some have reported successes up to 2019, while others rely on data sources provided by the international organizations that implement the measures (i.e., the United Nations) and may be delayed as a result.
Economic and Financial Systems in the EU
The starting point of the so-called new European architecture for financial regulation and supervision stems from the communication of 27 May 2009 on European financial supervision, where the commission envisaged a series of reforms of the current arrangements aimed at preserving financial stability. The debate on the appropriate supervision model in the EU began in 2000. According to the report on financial stability, there is a need for greater cooperation between supervisors and the fundamental lines of financial regulation and supervisory practices to begin a convergence process. These extremes were spelled out in the so-called lamfalussy report, which was initially intended for securities markets; however, it later extended to banking and insurance and is at the core of the current supervisory system in the EU. A supervisory mechanism was thus established, with decentralized national responsibilities and more nearly fifty supervisory authorities where coordinating between national supervisors voluntary, through three sectoral committees (Committee of European Banking Supervisors (CEBS) for banking, Committee of European Insurance and Occupational Pensions Supervisors (CEIOPS) for insurance and Committee of European Securities Regulators (CESR) for securities).
In the past, the financial systems of the euro area countries were organised from a purely national perspective, around their own currency. However, today, following the creation of the single market and the introduction of the euro, the European financial system is increasingly interlinked and the importance of national borders is diminishing. The economic and monetary union was undoubtedly the most important challenge in the process of European financial integration. Indeed, the replacement of national currencies by the euro was the culmination of the project to create a single financial market. As the monetary policy concern, the European system of central banks has advisory functions by issuing opinions and sanctioning powers (European System of Central Banks, 2021). It must contribute to the smooth conduct of policies pursued by the competent authorities relating to the prudential supervision of credit institutions and the stability of the financial system (Art. 127.5 Treaty on the Functioning of the European Union (TFEU)). It is composed of the European Central Bank (ECB) and the national central banks (Art. 282.1 TFEU), including-with certain particularities-those of the member states that are not initially part of EMU (United Kingdom, Denmark, Greece and Sweden). It is governed by the European central bank's decision-making bodies. The transformation of the European model of nationally based financial market supervision to an EU supervisory model is based on a set of institutions, mechanisms and authorities that oversight and control the European union's financial system, treatment of so-called systemic risks (as a reflection of these risks) and potential financial and economic crises (Sanchez-Bayon & Lominchar, 2020).
Although both the ECB and the national central banks can issue banknotes in the euro area; however, only the ECB authorized their issuance. Member states may issue coins requiring the ECB’s approval as to the issue’s volume (section 128 TFEU). The ECB takes the decisions necessary for performing the tasks entrusted to the ESCB under the statute or the treaty (section 132 TFEU). Furthermore, the ECB assisted by the national central banks, collects the necessary statistical information from the competent national authorities or directly from economic agents (Article 5 of the statute). It is responsible for the smooth functioning of the trans-European automated real-time gross settlement express transfer system, a euro payment system linking national payment systems and the ECB payment mechanism. In addition, the ECB makes the necessary arrangements to integrate the European System of Central Banks (ESCB), the central banks of the euro area's members.
The ECB may carry out specific tasks concerning policies relating to the prudential supervision of credit institutions and other financial institutions. Under the Single Supervisory Mechanism (SSM), the ECB has been assigned additional tasks in relation to the direct supervision of significant banks in the euro area and other participating member states. National authorities in the member states continue to supervise less significant banks in cooperation with the ECB; cross-border cooperation of supervisory authorities within the union has been entrusted to the three European Supervisory Authorities (ESAs): The European Banking Authority (EBA), the European Securities and Markets Authority (ESMA) and the European Insurance and Occupational Pensions Authority (EIOPA). The new macro-prudential watchdog, the European Systemic Risk Board (ESRB), completes the supervisory system.
Member States were entitled to replace irregular expenditure with new expenditure throughout the programming periods 2000-2006 and 2007-2013 if they took the requisite corrective actions and applied the corresponding financial corrections. The financial correction resulted in a net correction if the member state had no such additional expenditure to declare (a loss of funding). On the other hand, a commission financial correction judgment always had a direct and net impact on the member state: The member state was required to repay the money and its financial allocation was decreased (i.e., the member state could spend less money throughout the programming period).
Due to the legal framework and kind of budget management used during the 2007-2013 period, net corrections were more of an exception (reinforced preventive mechanism). The regulatory guidelines for the 2014-2020 period enhance the commission's approach on protecting the EU budget from irregular expenditure. This is mostly due to the implementation of the new annual assurance approach, which significantly minimizes the probability of a substantial degree of error. Indeed, the new legal framework places greater responsibility on program controlling authorities, who must conduct competent management verifications in time for the annual filing of program accounts. The commission keeps 10% of each interim payment until the entire national control cycle is completed. Because the commission makes net financial corrections where member states have not appropriately addressed any deficiencies before submitting, it is in the best interests of the member states to ensure the timely identification of serious deficiencies in the functioning of the management and control system and the reporting of reliable error rates (Sanchez-Bayon & Aznar, 2020).
Analysis of the EU Budget
The EU’s budget is about €150 billion per financial year (and increasing each year). Although it is a significant figure in absolute terms; however, it only represents 1% of the total EU GDP and less than 3% of total public expenditure in Europe. The European parliament and the council are jointly responsible for its consumption. Furthermore, annual budgets must be framed within the Multiannual Financial Framework (MFF) parameters. Here, the main arguments over budgetary matters occur parallel to making the MFF. In these discussions, the governments of the member states are key political actors, all seeking to protect and benefit their national priorities. EU financing for local and social improvement is a significant hotspot for key speculation projects.
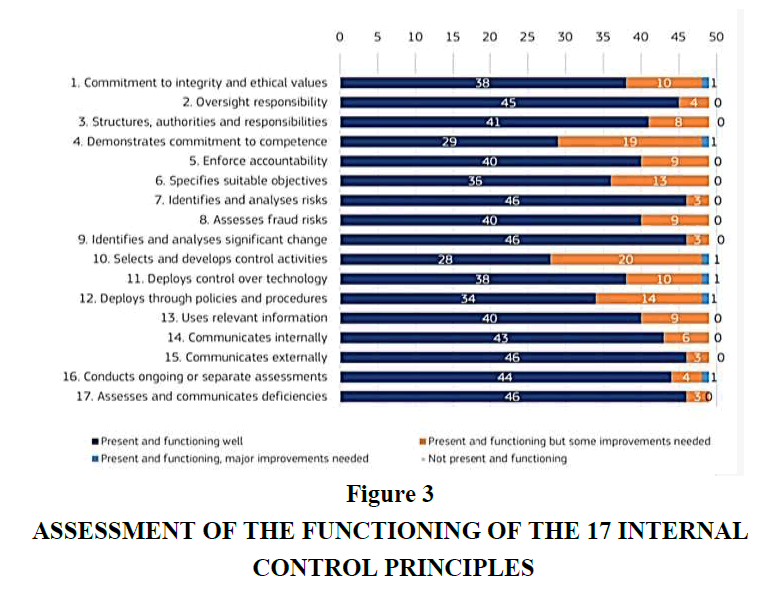
Furthermore, the EU budget is primarily used for investment. In some EU nations that have restricted methods (in any case), European subsidizing accounts for up to 80% of public speculation. Notwithstanding, EU provincial spending does not simply help more unfortunate areas. Thus, it puts resources into each EU country, improving the EU's economy in general. It is assessed that the profit from speculation by 2023 will be €2.74 for each €1 contributed between 2007-2013 (a 274% return). The EU has battled with low levels of investment since the 2008 financial crisis. It established the investment plan for Europe in 2014, intending to get Europe to invest again by mobilizing private and public funds. The investment plan was required to run until 2020 and aims to mobilize €500 billion. Without the EU budget, the boost to jobs, growth and investment would not be feasible (Figure 3).
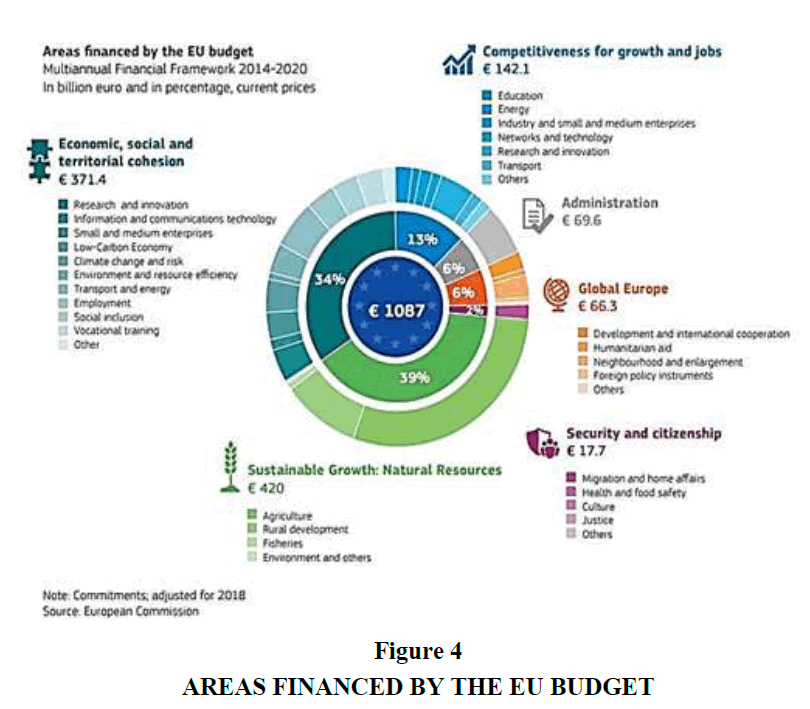
According to the database, the EU finances various projects from regional and urban development to employment and social inclusion, agriculture, rural development, research and innovation, and human aid. However, the Common Agricultural Policy (CAP) and structural funds are the primary areas in this regard. Here, the former concentrates around 40% of the EU expenditure while the latter concentrates 35% of EU expenditures on regional and social development. Furthermore, other expenditures include grants, development aid and loans. Under these scenarios, the EU provides funding for small businesses as well as aid to nongovernmental and civil society organizations. This is normally divided into two primaries categories of funding for young people. There are education and training programs, such as the erasmus+ and co-funding for projects that promote volunteer work and encourage civil involvement. Such funds have been inducted as a share in the EU budget. For example, the EU provided €80 billion for research and innovation through the Horizon 2020 program. Secondly, 20% of EU budget expenditure also supports climate goals. Here, the watertight nature of the headings indicates that each budget line is financed within a given heading. Each heading must, therefore, be sufficiently endowed to allow for a possible redistribution of expenditure between the various actions under the same heading according to needs or to allow for the financing of unforeseen expenditure (Sanchez-Bayon & Trincado, 2021).
Thus, the margin for unforeseen expenditure between the own resources ceiling and the ceiling on appropriations for payments is intended to allow for the revision of the financial framework, if necessary, to cover unforeseen expenditure when the financial perspective is adopted. Furthermore, in these circumstances, it helps absorb the consequences of lower-thanexpected economic growth with actual GNI lower than expected. The ceiling on appropriations for payments, which is an absolute amount, can be financed within the own resources ceiling (Figure 4).
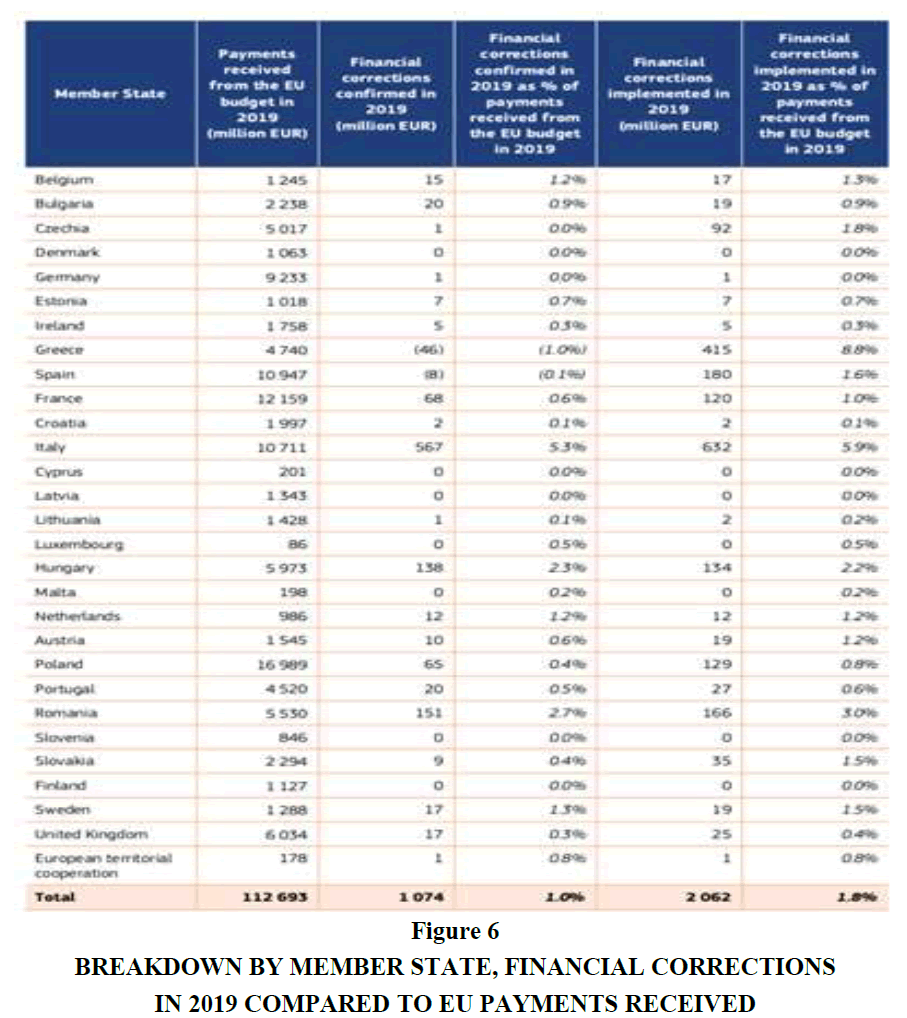
In a case where preventive mechanisms have not been so effective, EU expenditure are detected a posteriori (as errors affecting method), through controls on amounts accepted by the commission for paid out (ex-post controls). Thus, the commission corrects these errors through financial adjustments or replacement of ineligible expenditure in shared management. Furthermore, it makes recovery from ultimate receivers in direct and indirect management, throughout the same or succeeding years. For example, the confirmed corrective measures in 2019 were 1.5 billion € (25% higher than in 2018) in this regard. These are mostly payments from earlier years that have been tainted by errors. Parallel to this, control system flaws discovered through risk-based audits and systems rectified to prevent repeating the same errors in the future. It has been successfully practiced in the commencement by the implementing member states and partners in the context of shared and indirect management. Furthermore, the extent of exchanges examined by the court of auditors can be used to measure the commission's pertinent consumption from the EU budgetary plan.
According to this methodology, pre-financing and maintenance is possibly considered when the last beneficiary of EU reserves has given proof of their utilization and the commission (or another organization or body overseeing EU reserves) has acknowledged the last utilization of the assets (by clearing the pre-financing or delivering the sum held), on the grounds that this is the place where blunders of legitimateness or routineness may happen. Consequently, the dangers at instalment and the conclusion are resolved against this sum.
From an income perspective, the EU is not able to borrow, therefore, it needs to ensure a balanced budget. Thus, there are four main components of the EU’s income: Gross National Income (GNI), traditional own resources like tariffs and levies, Value Added Tax (VAT) and other sources. Here, each member state has to contribute equal amounts to the EU fund under the GNI-based arrangement. This income represented 70% of the EU revenues in 2017. Furthermore, the EU, a customs union, has a common external tariff regardless of where imports arrive to. In this case, the tariffs collected are seen as a natural source of EU income. A small proportion (1%) of revenues under this category also come from sugar levies. Thus, tariffs and levies generated around 13% of the EU income in 2017. Regarding VAT contributions, member states contribute to the EU budget by redirecting 0.3% of their VAT incomes to the EU funds (however, not all states have the same VAT). Due to this divergence, the VAT is adjusted or harmonized by the EU. Income from VAT contributed to 12.2% of the EU revenues in 2017. The remaining revenues come from other sources, including taxes on EU staff salaries, fines, late payments, etc.
There are many controversies still prevail in MFF included the size of the budget, the size of the CAP and the UK rebate, etc. For example, a sharp fall of expenditure on CAP (70% to 37%) has been monitored during 1985-2018. Even some new member of EU has been added during the last few years, the CAP’s budget continues to fall year by year as most of the new inclusions were based on primary sectors. Thus, MFF expenditures on primary sector is expected to fall up to 30% till 2027.
Thus, protection of EU’s agricultural products is being softened and it has generated popular perception that EU expenditure has been replacing national expenditure by a large extent over the past years. As it will be seen, however, the agricultural sector reform has become the centre for political debate.
Regarding the case of the United Kingdom, its rebate was between £3.1-£5.6 billion between 2011-2017. This rebate was introduced in 1985 backed by the argument that the country was making relatively larger net contributions compared to other member countries and was receiving in exchange very little from the budget. The logic behind the rebate was destined to finance the CAP; however, the UK not having a large agricultural sector at the time, was not gaining any benefit.
However, these figures only account for the net contributions to the EU budget, without taking into account the benefits obtained from being part of the single market and customs union. The formula used in the rebate means that the UK’s net contribution is reduced by around 60% and it has remained present since then.
Now the debate is, who pays for the rebate? The answer is the other member states. When adjusting the EU expenses to the GNI contribution to obtain a balanced budget, the cost of the rebate is included. However, Austria, Germany, the Netherlands and Sweden only pay one quarter of their outstanding amount. The cost of these reductions is also met by the other member states. In 2018, the UK was the second largest contributor to the EU budget, followed by France, Italy and falling just behind Germany as the main contributor. However, the Netherlands made the largest net contribution with respect to per person, followed by Denmark, Germany, Sweden, Austria and the UK.
Thus, here a second case of winners and losers prevail. Considering net contributions, France and Italy should only pay one-quarter of their outstanding amount. Denmark should also benefit from the reduction in the per-head contribution. However, not only do these three countries contribute more proportionally, but they also have to compensate for Austria, Germany, the Netherlands, Sweden and the UK’s reductions.
The European union lags behind other advanced industrial economies in basic measures of entrepreneurship and innovation. The European commission published a green paper in 2003 in response to the low rates of enterprise creation and growth relative to other economies which highlighted the low commitment to entrepreneurship training by European companies, a much greater problem when focusing on economies such as Spain. The Spanish business training system offers the possibility of accessing subsidised courses through the FUNDAE entity, a possibility that is not used by the majority of companies, especially small companies, entrepreneurs and start-ups.
Entrepreneurship remains an area where old Europe is at a clear disadvantage, with, for example, a higher proportion of US, Canadian and Australian working-age adults engaged in entrepreneurial activity than their European peers. In this respect, there is a notable exception in countries such as Estonia and Latvia, where the above trend is broken. However, in areas such as education, access to capital, regulatory frameworks, legal and commercial cultures, these countries have a distinguishing and favourable framework for entrepreneurship.
In recent years, the European commission has increased its efforts in this field, culminating in the formation of the entrepreneurship 2020 action plan in 2012. This action plan focused on three basic priorities. First, improving entrepreneurship education and training, secondly, removing administrative obstacles and finally, fostering the culture of entrepreneurship (European Commission, 2021).
In this sense entrepreneurship 2020 has been successful in to raise the overall importance of the issue of entrepreneurship education. The initiative deserves praise for the renewed interest from political circles, although the administrative obstacles to entrepreneurship are still very significant on the part of the administrations of the member countries (Eurostat, 2021).
Results and Discussion
Data Analysis
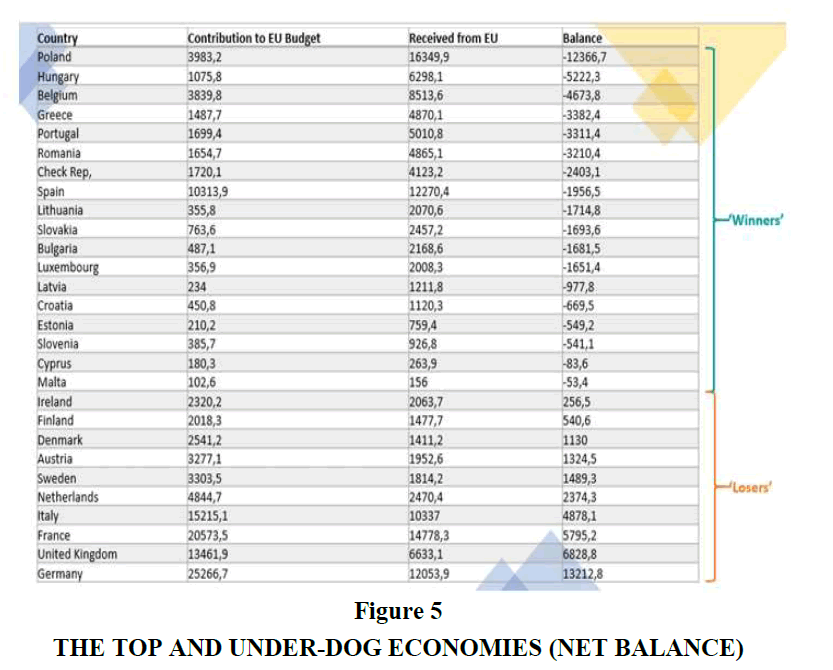
Considering the dataset of the EU budget from the European commission, poorer states generally are net recipients (receive more than pay). According to a 2018 report, eighteen economies were net recipients against only ten net payers (Figure 5).
According to this, there is a constant flow of wealth from west to east Europe, highlighting the inequality at the heart of how the EU budget is distributed. Official figures from the European commission between 2010 and 2014 indicated that Britain, France and German taxpayers contributed €127.5 billion to the EU’s project; however, eastern European members took out €134.5 billion through funding and subsidies during this same period. Thus, according to these facts and figures, German citizens funded neighbouring Poland under this arrangement. In this case, the UK, Germany, France and Italy are the big losers, while the eastern countries are the significant beneficiaries of the system. Furthermore, southern countries like Greece and Italy that seek deeper support for claims, such as the specific migration challenges, they face or climate change, demand support just like poorer Eastern states receive budget subsidies (Sanchez-Bayon et al., 2021).
The logic behind this distribution has been justified on the official site of the European commission as follows: In addition to living in a continent where people can move freely through 27 countries, companies small and large have free access to a market of 500 million consumers (European Commission, 2020). Better roads in Spain mean a French truck driver can deliver its products to consumers in a faster and safer way. In times of natural disasters, member states are there for each other. By having this collective money pot, the EU is in a position to take on challenges which individual countries alone would never be able to (European Commission, 2020).
Furthermore, the effect of the revision component fluctuates depending upon the sort of spending execution, the sectorial administration, and the monetary guidelines of the arrangement region. Altogether, the amendment systems intend to shield the EU financial plan from consumption-caused that is in a break of the law. Ex-post checks on a sample of claims conducted at the recipients facilities after costs have been expended and declared are a significant source of assurance. Over the course of the program's lifespan, a significant number of such in-depth checks are performed. Any amounts paid over what is owed are refunded and systematic errors are applied to the beneficiary's ongoing EU-funded initiatives (Sun et al., 2021).
Overall, winners are concentrated in the east and south of Europe, while losers tend to be geographically located in the west of Europe. Belgium and Luxembourg are the only exceptions in this case, as both hold the EU headquarters and other key offices. Furthermore, the payments received by each member country in 2019 are presented in Figure 6 for more clarity.
In the case of expenditures, as the primary beneficiaries from the EU budget have been discussed earlier, breaking down these expenditures and finding out where they go to and for what ends? Thus, why and who benefits the most from the EU budget can be better understood. Furthermore, nearly half of the funds of the EU budget in 2018 went to making the economy stronger through smart and inclusive growth for more competitive universities and companies better equipped to compete in the global marketplace. According to the study findings, Poland, Spain, Germany, Italy and France are the main beneficiaries. This section (smart and inclusive growth) concentrates on expenditures on the Erasmus programme, cohesion and project horizon 2020 among other.
Germany and France took the leading share of the budget head of competitiveness for growth and jobs; however, France is the leading beneficiary regarding large infrastructure projects. Furthermore, again Germany and France take most of the pie for project horizon 2020 project as well, while France keeps most of the funds in the thermonuclear experimentation category. Considering energy and transport, Germany is the leading recipient, followed by cyprus in the case of energy and Italy for transport. Poland is the main receiver under the economic, social, and territorial cohesion section of the EU budget. Most of these funds (over € 11billion) are used for the rural and less developed regions. Hungary, Spain and Italy fall behind in this regard. Under investment for growth and jobs, Poland again is the most significant receiver while for the most deprived and transition regions, Spain has been given top priority. Finally, Germany has received the leading share of EU budget regarding competitiveness.
Although the sections and beneficiaries countries have been addressed above, the decision of who is the real winner or loser is subjective. This is because investment under these sections has a multiplier effect on the economy. For example, subsidies and other grants are yearly aids to farmers. Innovation, energy, transport and infrastructure are longer-term investments that help bust the economy and make these countries more competitive.
Furthermore, even though the EU budget is not significant enough compared to public expenditures in these economies, it complements each country's key sectors. For example, it is not a coincidence that nuclear power is France's largest energy source while Germany is Europe’s largest energy consumer. Furthermore, due to these investments, two German companies have been rated in the top five trucking companies with the largest fleet worldwide.
Moving forward toward the national contribution of individual countries, the breakdown of sources of revenue and the assessment of the impact on each country of this contribution to the EU fund can be found below. Here, the GNI-based contribution figures show the expected outcomes; the order of highest to lowest contributors is linked to the size of the economy. For example, Germany, being the largest economy in the EU pays the highest contribution with respect to the other member economies. Thus, in this case, large economies are losers, whereas the small and marginal economies are benefitted (Tang, 2000).
Furthermore, Germany is the EU's leading customs duties payer, followed by the UK, the Netherlands, Belgium and Italy. During 2019, 40% of the EU imports came from Asia, other European countries accounted for 31% and North America for 17%. The main destination for EU exports were other European countries, with over 33%, followed by Asia (28%) and north America (25%).
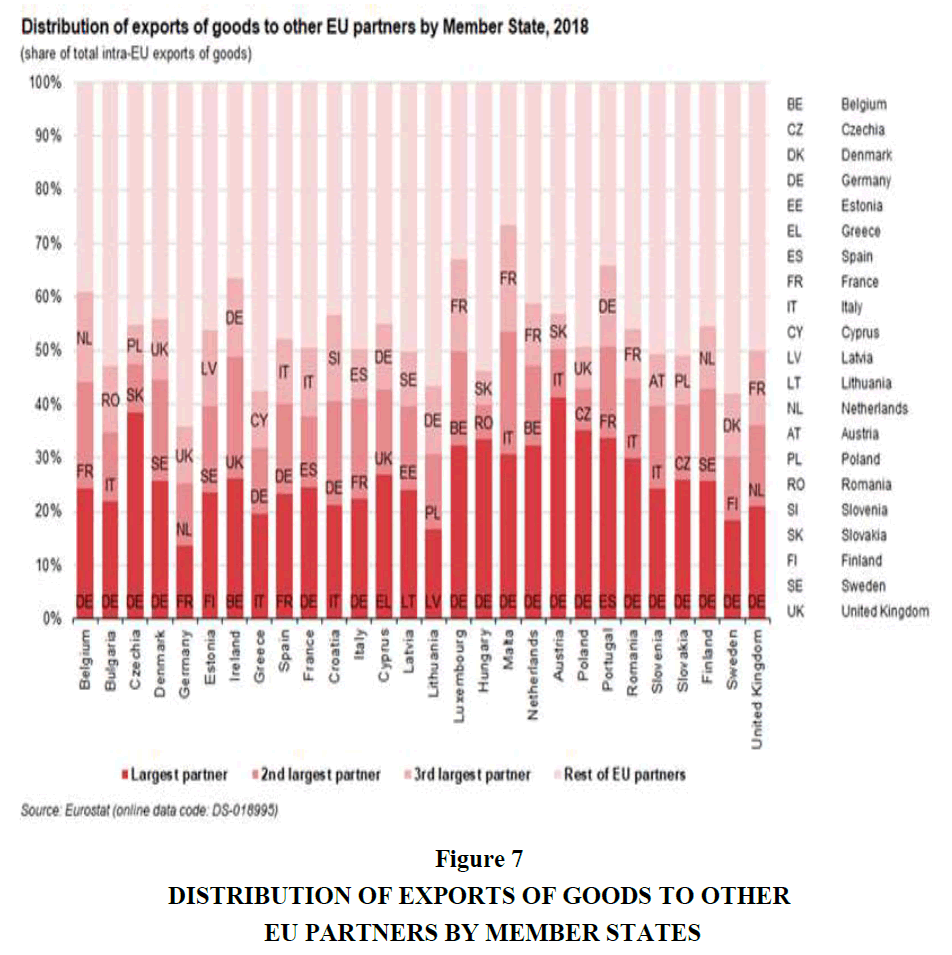
According to OEC (Observatory of Economic Complexity) database, Germany was at second as an exporter and third as an importer in 2017. Her main exporting destinations were USA, France, China, the UK and the Netherlands while top import origins were China, the Netherlands, France, USA and Italy. The graph below Figure 7 shows trade between countries.
Notably, Germany is the first, second or third trade partner of all EU economies except for Estonia and Latvia. Thus, even though Germany looks a leading loser according to earlier indicators (like trade barriers), she has gained signifincat and positive impact from the evaluation of EU.
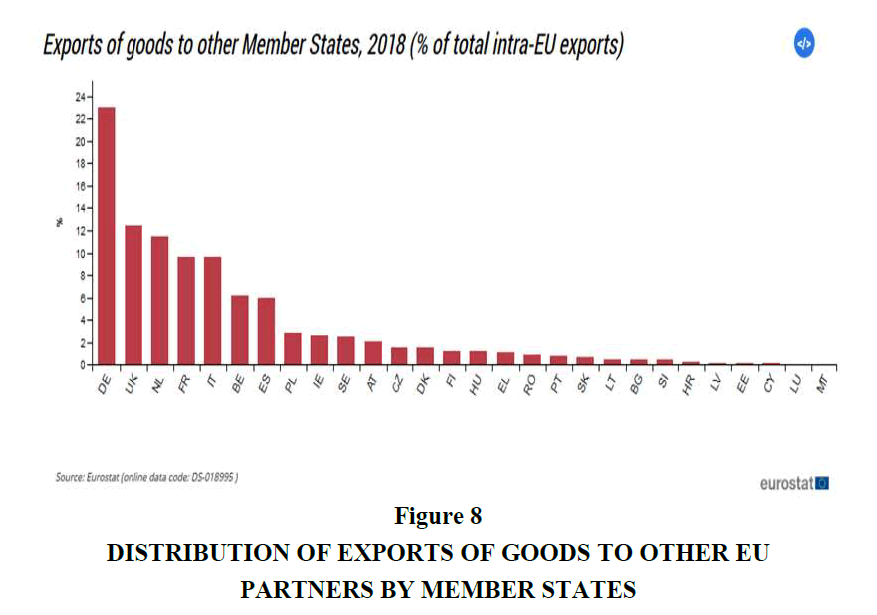
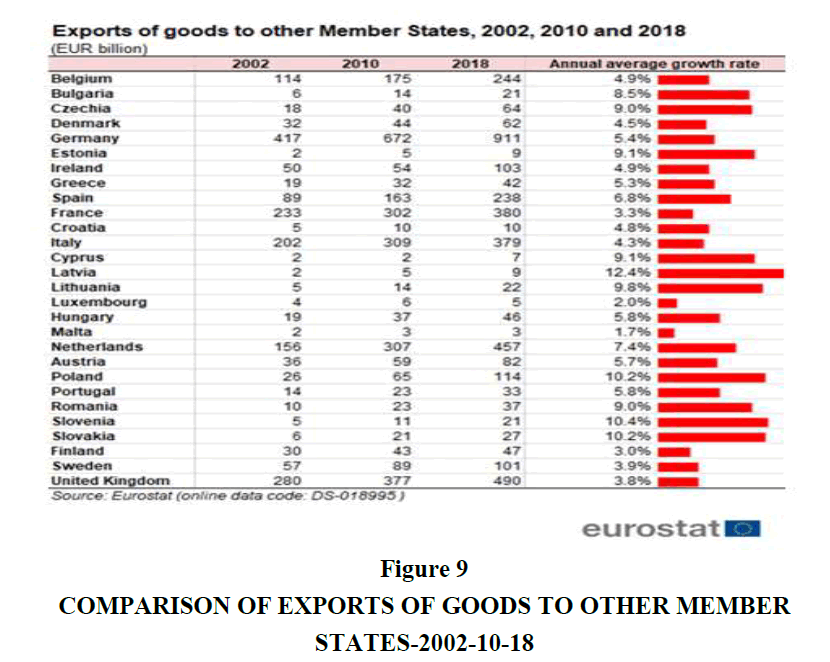
Therefore, it can be concluded that Germany is the number one beneficiary of the customs union as the market size of Europe has access to their goods without being taxed a tariff which makes her goods more competitive compared to those coming from USA, China or other large economies outside the union. It has been presented in following graphs (Figures 8 and 9).
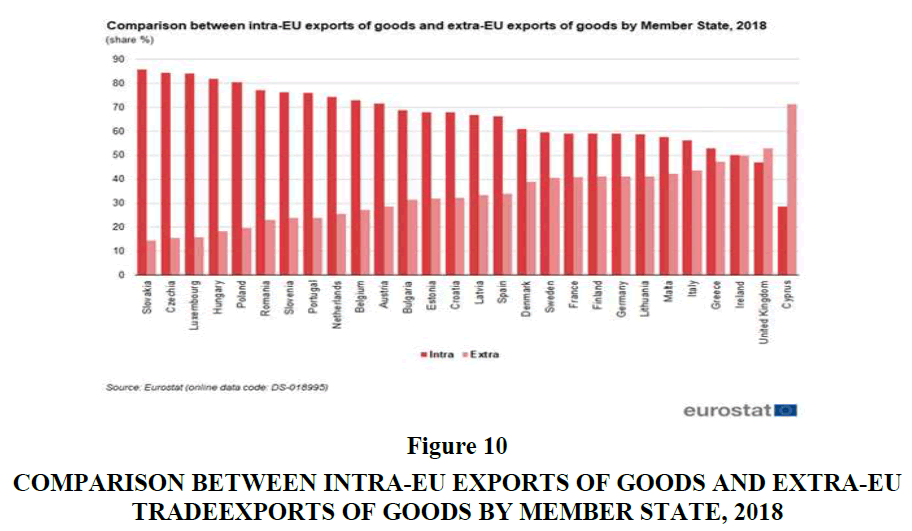
Now considering the intra-EU and extra-EU trade of goods (proportion), the UK, Cyprus and possibly Ireland are the main losers in this regard. However, these countries have more or equal trade with external EU countries than with member states. So there might be a chance that different trade agreements could benefit their trade. This is also a key point in explaining Brexit (Figure 10).
Figure 10 Comparison Between Intra-EU Exports of Goods and Extra-EU Tradeexports of Goods by Member State, 2018
The VAT resource currently accounts for 14% of total resources and is also on a downward trend. It was created by the own resources decision of 21 April 1970 and is derived through a reference rate to the harmonized national bases. It is a contribution from the member states corresponding to the proceeds of VAT levied at 1% on a harmonized base (this rate was raised to 0.75% in 2002 and to 0.50% in 2004). The VAT base of each member state is capped at 50% of Gross National Income (GNI). According to this, if the VAT base of a given member state exceeds 50% of its GNI, 50% of GNI will be used as the basis for calculating the VAT resource. This change has made it possible to reduce the regressivity of the revenue system since the VAT base is higher in relative terms in the less prosperous member states. Thus, considering the VAT-based contribution, the UK and France pay the highest contributions. Italy, Germany and Spain are next in the lineup. Furthermore, if a country's harmonized VAT base is still large compared to its national income, its burden is capped and if the harmonized base is over 50% of its GNI, the contribution is capped at 0.15% of its GNI. For the MFF 2014-2020, the uniform call rate was 0.30% except for Germany, the Netherlands and Sweden, which have benefited from a reduced call rate of 0.15%. In addition, due to the 50% limit, the VAT contributions of eight countries (Croatia, Cyprus, Estonia, Luxembourg, Malta, Poland, Portugal and Slovenia) were capped (Trincado et al., 2021).
Considering the role of sugar in EU revenues, it can be asked, why it is being levied. This levy was charged on sugar producers in the EU for aiming to recover part of the subsidy to EU sugar exporters. This is because the EU is the world’s leading producer of beet sugar. Although, its levied represents a small proportion of EU income (less than 1%), its quota was last implemented in the marketing in 2016-2017. However, last time member states paid this tax to the EU in March 2017 and June 2018, respectively. This tax is on beet sugar which normally produced in northern Europe (most competitive countries are France, Germany, the Netherlands, Belgium and Poland). Furthermore, the EU also has an important sugar refining industry. Thus, Germany, France, Italy and the Netherlands are the most negatively affected countries in this regard (Urbina & Rodriguez, 2022).
It has been abserved that most of the sustainable growth regarding natural ressources are CAP’s funds. The objective of the CAP is to maximize production which led to oversaturation of the market. Exported surplus products that cannot be sold in the EU are exported to developing countries. In this case, losers are not those countries who receive less subsidies or have other sectors more developed, like the UK in 1985 becoming their excuse for obtaining the rebate. Thus, France leading this section followed by Spain, Germany and Italy. France and Germany are among the top four exporters of agricultural output worldwide. As previously seen, the EU budget is one major driving force of member countries agricultural sector, even replacing national expenditure. Thus, the CAP has brought many winners and benefitted EU farmers by a great extent, but these practices have also destroyed local farming, benefitting large producers mainly. From the reduction in the CAP’s budget for the upcoming MFF, the argument that price dumping should be stopped seems to be gaining support. New losers may appear and this conflict has already originated protests in several European countries in which the agricultural sector is relatively large. Farmers, in countries such as Spain or Italy, are the main losers of this new decision.
Form Asylum and Migration section, Germany and Spain are the main beneficiaries. This seems logical and justified as Germany has been involved in many projects concerning refugee crisis from the Syria and Palestine conflicts. Likewise, Spain receives rising number of refugees and migrants reaching it by sea.
European Globalisation Adjustment Fund
The European Globalisation adjustment Fund (EGF) demonstrates union solidarity by assisting workers who have been laid off as a result of large structural changes in world trade patterns, globalisation, and global economic and financial crisis. The EGF is a disaster relief fund that helps unemployed workers by co-financing active labour market policies. In regions of high youth unemployment, the EGF provides support for young people in employment, education or training (NEETs). Thus, nearly 60% of the cost of the measures recommended by the member states is covered by the EGF. It is not part of the multiannual financial framework and it does not have an annual budget that must be absorbed because of its uniqueness. However, this fund is implemented with the help of the member states. Thus, the member states obligation to plan and execute active labour market initiatives that are most suited to reintegrating targeted beneficiaries into long-term employment, either within or outside their initial sector of activity. As EGF is only activated if a member state seeks financial assesstan; therefore, it is a special instrument (not an operational program) that is used in unanticipated occurrences. The quantity of EGF applications has historically been highly cyclical, fluctuating in accordance with economic fluctuations. In 2019, the commission received only one application, which could be explained by fewer mass layoffs (involving more than 500 redundancies) as a result of globalisation and an overall improvement in the member states economic situation, which makes it easier for workers to reintegrate into the labor market. The EGF's objectives have been realized and the EU's additional value has been demonstrated to the general public. It has been reported that 61% of the supported workers found new jobs as a result of the EGF intervention during 2017-2019. However, when looking at individual cases, this ranged from 40% to 92%. Taking into account that the beneficiaries of EGF co-funded measures are typically among those who are having the most difficulty in finding work, these results are very encouraging (Uren, 2019).
European Union Solidarity Fund
Furthermore, the European Union Solidarity Fund (EUSF), established in 2002, can be activated in the event of significant and regional disasters upon request from the country's national authority; the commission cannot activate it on its own initiative. Financial assistance from the EUSF is awarded from appropriations raised by the budgetary authority (council and european parliament) over and above the normal EU budget. This ensures that in each case EUSF aid comes as an expression of solidarity with the full backing of member states and the parliament, not just as an administrative act of the commission. It is one of the most concrete demonstrations of solidarity between member states in acute times of need caused by the occurrence of a severe natural disaster by providing financial assistance to member states and to countries negotiating their accession to the EU. In 2019, the commission received only four applications (Austria, Greece, Portugal and Spain) in this regard (Yzquierdo & Sanchez-Bayon, 2015).
A Note on GDP and the Issue of Convergence
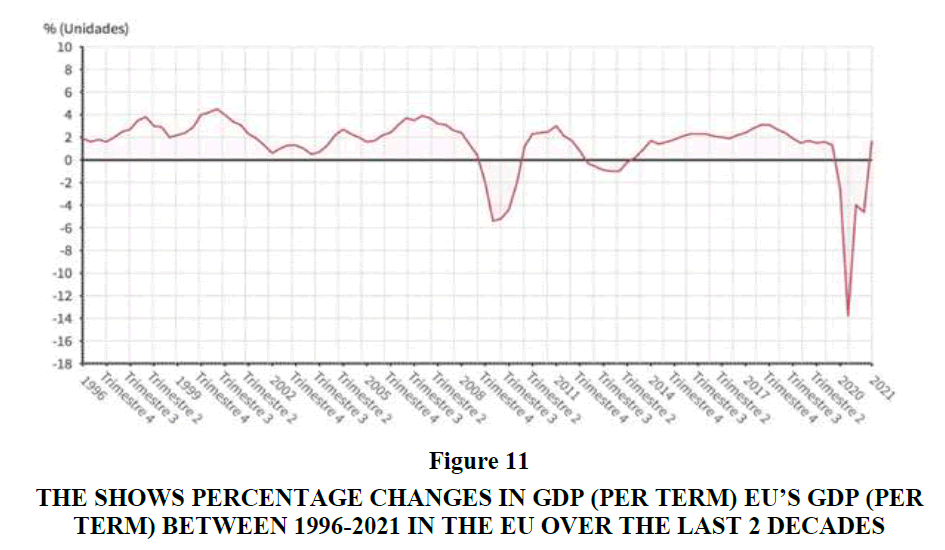
Convergence in per capita income levels is called real convergence while nominal convergence between countries refers to the approximation of those economic magnitudes that measure the degree of macroeconomic stability of a country (Figure 11).
Figure 11 The Shows Percentage Changes in GDP (Per Term) EU’S GDP (Per Term) between 1996-2021 in the EU over the Last 2 Decades
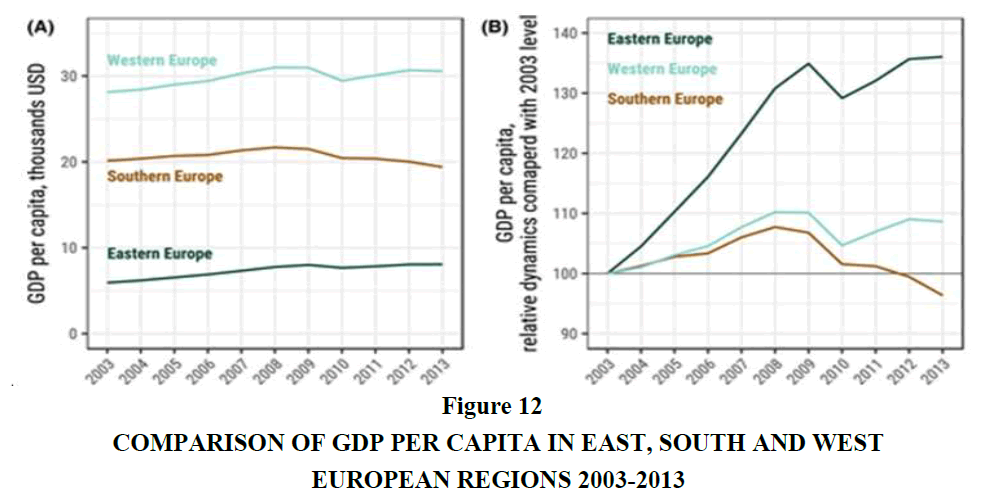
The convergence rate of Europe can be helpful tool for more clearity to understand the winners and losers (Kashnitsky et al., 2020). The evolution of the main three European regions can be observed. It allows for analysis on whether the GDPs per capita has tended to converge or not over time. The graph concludes that winners are eastern European countries, while southern countries are main losers (Figure 12).
Conclusion
This study attempted to assess the impact of Euorpean budget on the sustainable economic progress of the member states. For the said perpose, study utilized the MFF reports between 2014-2020. The economic and social factors have been assessed based on the income and expenditures for each nation from the EU buget circumstances. According to the qualitative assessment of the study based on the contribution to the EU budget, the UK, Germany, France, and Italy are the most contributing economies, while the east and south Europe countries are the significant beneficiaries by receipting assesstance from the system. However, Poland, Spain, Germany, Italy and France are the main beneficiaries in term of expenditure share from budget. Furthermore, considering the individual share contribution, Germany, pays the highest contribution with respect to the other member economies due to largest economy of the region. Thus, in this case, large economies are losers, whereas the small and marginal economies are benefitted. The UK, Cyprus and possibly Ireland are the main losers in intra-EU and extra-EU trade of goods. France and Germany are among the top four exporters of agricultural output worldwide while form asylum and migration section, Germany and Spain are the main beneficiaries. However, as Germany remained highest benifisheries of the EU budget system as it has second highest exporter and third as an importer in 2017 in the region. Furthermore, Germany is the first, second or third trade partner of mostly EU economies. Therefore, it can be concluded that Germany is the number one beneficiary of the EU budget than the other member states.
It is possible that a way of understanding winners and losers could be comparing economic convergence in Europe. Studies on economic convergence conclude that winners are eastern European countries, while southern countries are main losers. The data on the results of economic convergence in Europe are not always in line with the expectations. The net recipients should be the countries where this convergence has not yet been achieved. The reality is that there has been given the case of countries like Italy that are net payers and that are also moving away from this pursued economic convergence.
Looking towards the future, the MFF for 2021-2027 is supposed to be a budget for Europe’s priorities: Simplification, transparency and flexibility according to published data from the European commission. Now the question is whether any improvements will be seen. The picture is therefore complex and both financial regulation and the configuration of its architecture are up in the air. There is consensus on the broad points of the financial stability board but not on the details. Also at stake is the role of central banks in preserving the stability of the financial system. Substantive regulatory reform cannot be limited to essentially cosmetic changes. If this was the case, the crisis would have been a missed opportunity to build a more robust financial system and one could only expect new episodes in which Europe would again approach the abyss.
References
Arnedo, E.G., Valero-Matas, J.A., & Sanchez-Bayon, A. (2021). Spanish tourist sector sustainability: Recovery plan, green jobs and wellbeing opportunity. Sustainability, 13(20), 11447.
Butzen, P., de Prest, E., & Geeroms, H. (2006). Notable trends in the EU budget. Economic Review, 49-67.
Cipriani, G. (2010). The EU budget: Responsibility without accountability? Archive of European Integration, 159.
European Commission (2021). Third EU health programme 2014-2020. Brussels: European Commission.
European Commission (2011). EU Budget at a glance. Brussels: European Commission, Belgium.
European Commission (2020). Sugar. Brussels: European Commission, Belgium.
European Commission (2020). EU budget. Brussels: European Commission, Belgium.
European Commission (2021). EU budget own resources. Brussels: European Commission, Belgium.
European System of Central Banks (2021). Consolidated version of the treaty on European union. Official Journal of the European Union, 13-45.
European Union (2021). EU funding. Brussels: European Commission, Belgium.
European Union (2021). VAT rules and rates. Brussels: European Commission, Belgium.
Eurostat (2021). Intra-EU trade in goods-main features. Eurostat.
Gutteridge, N. (2016). Mapped: The real winners and losers from the EU (and surprise-Britain gets a raw deal. Express publisher.
Garcia-Vaquero, M., Sanchez-Bayon, A., & Lominchar, J. (2021). European green deal and recovery plan: Green jobs, skills and wellbeing economics in Spain. Energies, 14(14): 4145.
Huerta, de Soto, J., Sanchez-Bayon, A., & Bagus, P. (2021). Principles of monetary and financial sustainability and wellbeing in a post-COVID-19 world: The crisis and its management. Sustainability, 13(9), 4655.
Iram, R., Zhang, J., Erdogan, S., Abbas, Q., & Mohsin, M. (2020). Economics of energy and environmental efficiency: Evidence from OECD countries. Environmental Science and Pollution Research, 27, 3858-3870.
Indexed at, Google Scholar, Cross Ref
Kashnitsky, I., de Beer, J., & van Wissen, L. (2020). Economic convergence in ageing Europe. Journal of Economic and Social Geography, 111(1), 28-44.
Newman, M. (2001). Allegiance, legitimation, democracy and the European union. EUI Working Paper.
Romero, N. (2001). The labyrinth of the European union. The Information Professional, 10(12): 60-61.
Sanchez-Bayon, A. (2014). Foundations on global and comparative law: Kind of common order in the globalization? Mexican Bulletin of Comparative Law, 47(141), 1021-1051.
Sanchez-Bayon, A. (2014). Global system in a changing social reality: How to rethink and to study it. Beijing Law Review, 5, 196-209.
Sanchez-Bayon, A. (2020). Renewal of business and economic thought after the globalization. Bajo Palabra, 24, 293-318.
Sanchez-Bayon, A., Campos, G., & Fuente, C. (2018) Evolution and evaluation of the European construction and its institutional relations (1946-2011). Law and Social Change, 52: 1-69.
Sanchez-Bayon, A., & Lominchar, J. (2020). Labour relations development and changes in digital economy. Journal of Legal Ethical and Regulatory Issues, 23(6), 1-12.
Sanchez-Bayon, A., & Aznar, E. T. (2020). Business and labour culture changes in digital paradigm: Rise and fall of human resources and the emergence of talent development. Cogito: Multidisciplinary Research Journal, 12(3), 225-243.
Sanchez-Bayon, A., & Trincado, E. (2021) Rise and fall of human research and the improvement of talent development in digital economy. Studies in Business and Economics, 16(3), 200-214.
Sanchez-Bayon, A., Garcia-Vaquero, M., & Lominchar, J. (2021) Wellbeing economics: Beyond the labour compliance and challenge for business culture. Journal of Legal, Ethical and Regulatory Issues, 24(1), 1-13.
Sun, H., Ikram, M., Mohsin, M., & Abbas, Q. (2021). Energy security and environmental efficiency: Evidence from OECD countries. The Singapore Economic Review, 66(2), 489-506.
Tang, H. (2000). Winners and losers of EU integration: Policy issues for central and eastern Europe. World Bank Publications, Washington DC, pp. 1-326.
Trincado, E., Sanchez-Bayon, A., & Vindel, J.M. (2021). The European union green deal: Clean energy wellbeing opportunities and the risk of the jevons paradox. Energies, 14(14), 4148.
Urbina, D.A., & Rodriguez, G. (2022). The effects of corruption on growth, human development and natural resources sector: empirical evidence from a bayesian panel VAR for Latin American and Nordic countries. Journal of Economic Studies, 49(2), 346-363.
Uren, D. (2019). Winners and losers in the European Union. European Union Politics, 5(1), 5-23.
Yzquierdo, F. J. H., & Sanchez-Bayon, A. (2015). Air navigation and tourism on trial: Current controversy into the EU regulation. Modern Economy, 6(5), 595.
Received: 20-Feb-2023, Manuscript No. JLERI-23-13532; Editor assigned: 23-Feb-2023, PreQC No. JLERI-23-13532(PQ); Reviewed: 09-Mar-2023, QC No. JLERI-23-13532; Revised: 29-Mar-2023, Manuscript No. JLERI-23-13532(R); Published: 26-Apr-2023
