Research Article: 2022 Vol: 21 Issue: 1
Efficiency of Nifty Pharma Index during the Covid-19 Pandemic in India
A. Antony Lourdesraj, Bharathidasan University
M. Babu, Bharathidasan University
J. Gayathri, Bharathidasan University
G. Indhumathi, Mother Teresa Women’s University
J. Sathya, Sri Sarada College for Women
Citation Information: Lourdesraj, A.A., Babu, M., Gayathri, J., Indhumathi, G., & Sathya, J. (2021). Efficiency of nifty pharma index during the covid-19 pandemic in India. Academy of Strategic Management Journal, 21(S1), 1-7.
Abstract
The study measures the efficiency of NSE Pharma Index listed companies, during the COVID-19 pandemic period, ranging from December 2019 to November 2020.The main objective of this paper was to test the price movement of pharmaceutical companies, by using the statistical tools like descriptive statistics, ADF and GARCH (1,1) model. NIFTY Pharma Index reported high volatility duringCOVID-19 pandemic period.
Keywords
COVID-19, GARCH (1, 1) and NIFTY Pharma Index
Introduction
During the COVID-19 pandemic situation, researchers tried to study the aftermath of COVID-19 pandemic in their discipline. Though COVID-19 affected all sectors, it was a boon in disguise to pharmaceutical industry. According to IBEF, India is third largest in the world in terms of volume and fourteenth in value for pharmaceutical manufacturing. The Government has created a national pharmaceutical sector with a large network of three thousand medical firms and approximately ten thousand five hundred production plants. The Department of Pharmaceutical reported forty-three billion US dollars’ worth of business volume and it is currently growing at 7-8 percent and it is 15-16 percent in the medical equipment business. Net exports account for twenty billion U.S. dollars, of which 90 percent of the total exports are medicines. According to news announcements issued by SEBI in March, the stock markets were extremely volatile. As a result of market uncertainty and the resulting concern of a financial recession due to COVID-19 pandemic crisis, SEBI had taken remedial measures like solid risk management framework, in both BSE and NSE. Investors are affected by anxiety and confusion in investing. US stock market index also had fallen to one third since the COVID-19 crisis. The disruption triggered by this outbreak in the west affected the business and market system. The outbreak of COVID-19 had taken the whole world closer to a financial crisis than the early 21st century Global Crashes (Georgieva (2020)); Igwe (2020); Ozili & Arun (2020) and Azimli (2020) ). The government's lock-down announcement leads to halting of numerous operations. As a result of the disruption of the world economy, India's stock market is seen to be more volatile. The Indian stock market has also face strong uncertainty as a result of its collapse in the global financial market. This paper explores the volatility behaviour of Pharmaceutical Industries, particularly NSE NIFTY Pharma Index during the period of one year ranging from December 2019 to November 2020.
Review of Literature
Krishnamurthy et al. (2017) studied various stock indices returns like Nifty IT, Nifty Pharma etc and observed the volatility in the returns in these indices. Pandya (2017) found positive returns for all NIFTY pharma index companies from2010 to 2016. Batra & Taneja (2020) found that NIFTY Pharma and NIFTY50 are the most volatile compared to other indices before the COVID-19 pandemic. Jain (2020) compared pre-crisis and crisis times and found Automobile and Nifty 50 were more volatile during the pandemic while FMCG, Pharma, Metals, etc experience positive movement during this pandemic period. Jasuja & Sharma (2020) ) analysed the risk and return during the pandemic on different sectors of Indian stock market. Sinha et al. (2020) found that BSE SENSEX recorded abnormal return from January to June 2020 and also found that large-cap stocks reported positive movement while Small and Mid-cap stocks recorded negative movement during the COVID-19 period. Sugirtha et al. (2021) studied the price movement of commodities market using VEC model. Sugirtha et al. (2021) conducted a study using Descriptive Statistics and ADF test, to observe the market movement. Mittal & Sharma (2021) reported that healthcare and pharmaceutical companies yielded abnormal and cumulative abnormal returns during the pandemic period. Thomas et al. (2020) recorded that the foreign institutional investors sold out more than Rupees sixty thousand crores from equity market during the first quarter of 2020. Bora & Basistha (2020) explored the volatility of these indices pre and post event, using the actual closing prices of indices such as NIFTY and SENSEX. Results indicated that during the pandemic era, the stock market had suffered volatility in India. Gayathiri (2021) observed Nifty 500 and Nifty Pharma sector Trend and Regression movement during the COVID- 19 period. Regression line was positive compared to the last five years before the COVID-19 period. By observing the earlier studies, Indian pharmaceutical sector needs to have special attention during the COVID-19 pandemic, ranging from December 2019 to November 2020 by observing the price volatility (Adenomon & Maijamaa, 2020; Azimli, 2020).
Objectives of the Study
1. To analyse the stationarity of daily prices of NSE NIFTY Pharma Index listed companies during the COVID -19.
2. To construct a GARCH (1,1) model to examine volatility of select pharmaceutical companies listed in the NSE NIFTY Pharma Index during the COVID-19.
Hypotheses of the Study
NH01 There is no stationarity of daily prices of NSE NIFTY Pharma Index listed companies during the COVID-19.
NH02 There is no significant volatility in daily returns of NSE NIFTY Pharma Index listed companies during the COVID-19.
Methodology
NSE NIFTY Pharma Index consists of ten companies and all the ten companies were taken for the study. During the COVID-19 pandemic, the daily closing prices of sample companies were collected from the NSE's official website, for the period December 2019 to November 2020.
Estimation of ADF Test
To verify whether a time series is stationary or not, the following regression is estimated:
 (1)
(1)
Here, Δ → 1st difference operator
α → represents constant
β → coefficient on a time trend
P →symbolized lag
ε →error term
Since the p-value was less than 0.05, reject the null hypothesis.
Estimation of GARCH (1, 1) Model
To estimate the volatility of stock prices, the following expression is used:
 (2)
(2)
Here,  conditional volatility
ω → constant
 ARCH term
 GARCH term
 coefficients
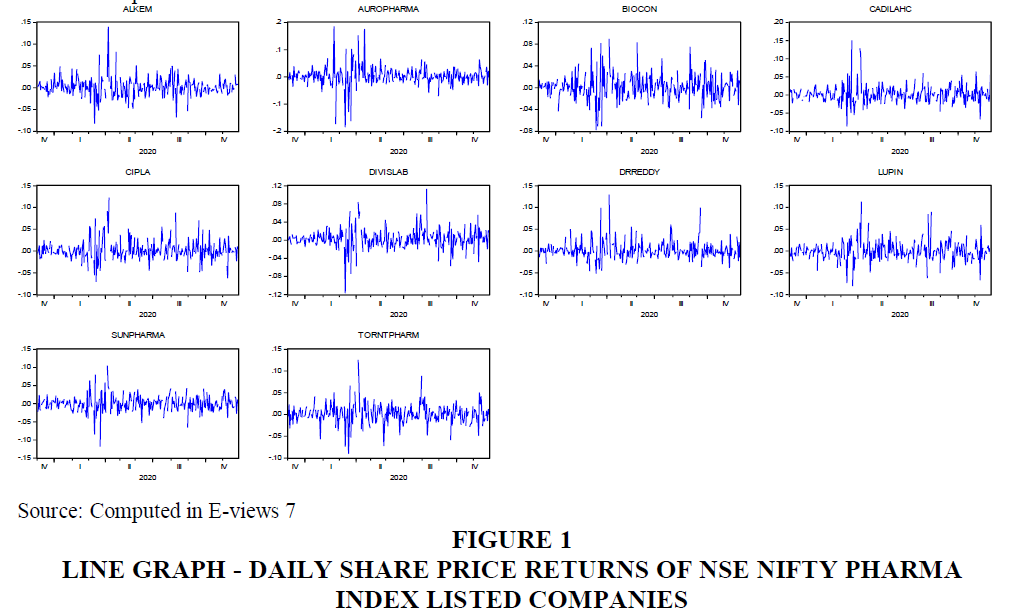
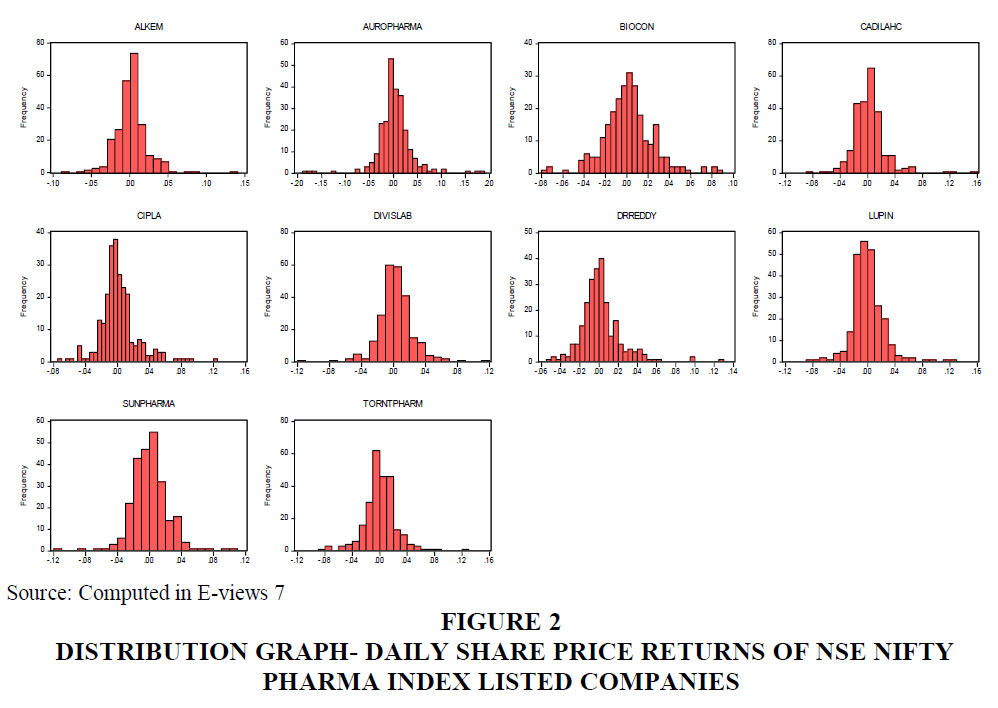
Results of Descriptive Statistics Analysis in NSE Nifty Pharma Index, during the COVID-19 pandemic from December 2019 to November 2020, are discussed in Table 1. The highest mean and standard deviation were recorded for Divi's Laboratories Ltd. The lowest mean value was found in Lupin Ltd. In the case of Skewness, Aurobindo Pharma Ltd and Divi's Laboratories Ltd both were negatively skewed. All the companies were Leptokurtic in nature. Jarque-Bera revealed that the stock returns of all sample companies were normally distributed during the study period (Figures 1 and 2).
| Table 1 Results of Descriptive Statistics Analysis | ||||||||||
| Companies | ALKEM | AURO PHARMA | BIOCON | CADILAHC | CIPLA | DIVISLAB | DRREDDY | LUPIN | SUN PHARMA | TORNT PHARM |
| Statistics | ||||||||||
| Mean | 0.001342 | 0.002621 | 0.001680 | 0.002277 | 0.001867 | 0.002798 | 0.002013 | 0.000430 | 0.000513 | 0.001276 |
| Median | 0.000934 | 0.000556 | 0.000992 | 0.001375 | -0.000861 | 0.003014 | -0.000747 | -0.000866 | 0.000000 | 7.50E-05 |
| Maximum | 0.139198 | 0.184600 | 0.089843 | 0.150571 | 0.122550 | 0.112934 | 0.129870 | 0.124543 | 0.104469 | 0.125340 |
| Minimum | -0.082197 | -0.183989 | -0.077588 | -0.085709 | -0.070959 | -0.116501 | -0.051353 | -0.08075 | -0.118297 | -0.089899 |
| Std. Dev. | 0.022195 | 0.038559 | 0.023949 | 0.025502 | 0.024439 | 0.022955 | 0.021815 | 0.024636 | 0.023670 | 0.024373 |
| Skewness | 0.954829 | -0.074845 | 0.365872 | 1.504406 | 1.103401 | -0.000489 | 1.668453 | 1.032148 | 0.071552 | 0.297921 |
| Kurtosis | 10.03267 | 11.51285 | 5.054671 | 10.73471 | 6.883129 | 8.391582 | 9.848276 | 8.179022 | 7.619026 | 7.149360 |
| Jarque-Bera | 555.3926 | 758.1349 | 49.75154 | 720.3569 | 208.6298 | 304.0150 | 606.9371 | 325.0826 | 223.3469 | 183.7761 |
Results of Augmented Dickey Fuller Test
Table 2 shows the results for unit root test at level, for all companies listed on NIFTY Pharma Index. The statistical values were greater than the test critical values, denoting the stationarity of data. Hence the study rejected the null hypothesis NH01 “There is no stationarity of daily prices of NSE NIFTY Pharma Index listed companies.”
| Table 2 Results of Augmented Dickey Fuller Test | |||||
| NIFTY Pharma Index | t-Statistic | Test Critical Values | Prob | ||
| Company Name | 1% level | 5% level | 10% level | ||
| Alkem Laboratories Ltd. (ALKEM) | -15.1414 | -3.456408 | -2.872904 | -2.5729 | 0.0000 |
| Aurobindo Pharma Ltd. (AUROPHARMA) | -16.6517 | -3.456408 | -2.872904 | -2.5729 | 0.0000 |
| Biocon Ltd. (BIOCON) | -17.8081 | -3.456408 | -2.872904 | -2.5729 | 0.0000 |
| Cadila Healthcare Ltd. (CADILAHC) | -15.8169 | -3.456408 | -2.872904 | -2.5729 | 0.0000 |
| Cipla Ltd. (CIPLA) | -16.181 | -3.456408 | -2.872904 | -2.5729 | 0.0000 |
| Divi's Laboratories Ltd. (DIVISLAB) | -16.9942 | -3.456408 | -2.872904 | -2.5729 | 0.0000 |
| Dr. Reddy's Laboratories Ltd. (DRREDDY) | -15.9652 | -3.456408 | -2.872904 | -2.5729 | 0.0000 |
| Lupin Ltd. (LUPIN) | -15.8793 | -3.456408 | -2.872904 | -2.5729 | 0.0000 |
| Sun Pharmaceutical Industries Ltd. (SUNPHARMA) | -16.955 | -3.456408 | -2.872904 | -2.5729 | 0.0000 |
| Torrent Pharmaceuticals Ltd. (TORNTPHARM) | -14.1629 | -3.456408 | -2.872904 | -2.5729 | 0.0000 |
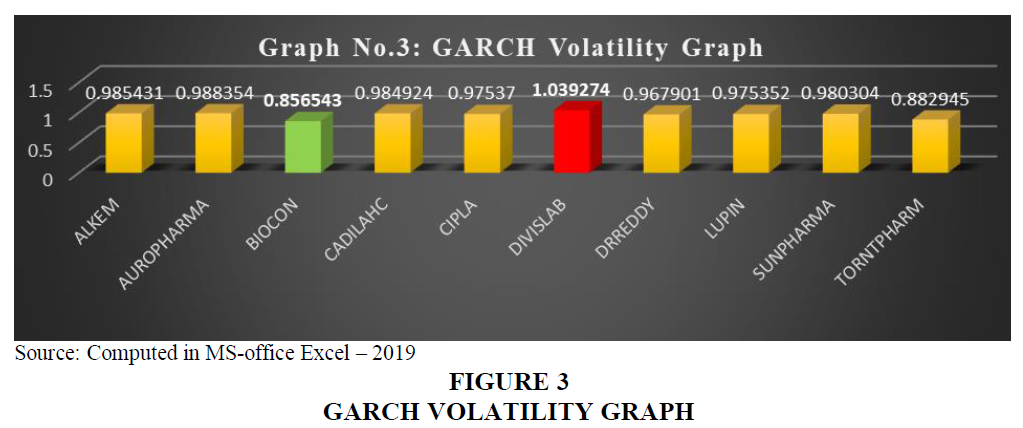
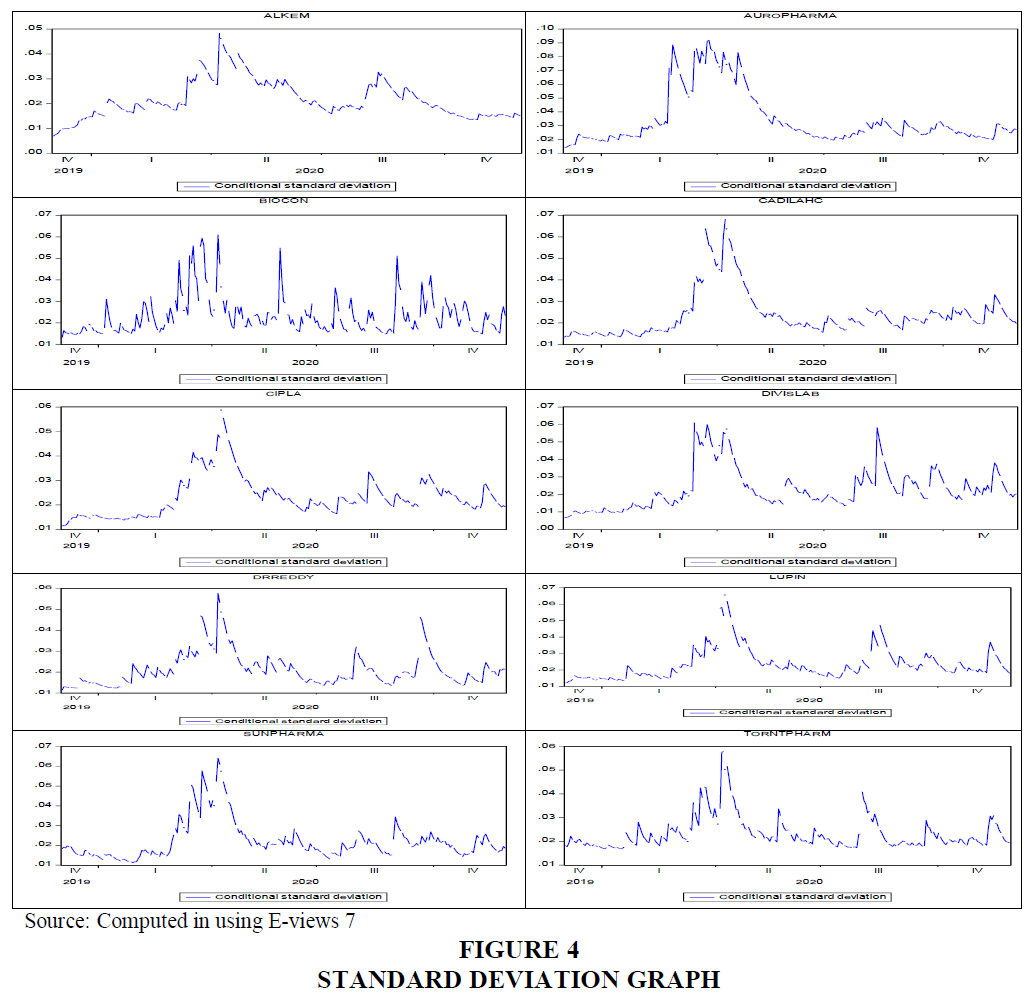
Results of GARCH (1, 1) in NSE Nifty Pharma Index, during the COVID-19 pandemic from December 2019 to November 2020, are displayed in Table 3. The DIVISLAB recorded top rank in the case of volatility among listed companies and BIOCON was the least in the case of volatility. Hence the study rejected the null hypothesis NH02 “There is no significant volatility in daily returns of NSE NIFTY Pharma Index listed companies.” The following graph (Figures 3 and 4) shows the volatility patterns and standard deviation of the pharmaceutical companies, listed in NSE Nifty Pharma Index.
| Table 3 Result of Garch (1,1) Model | |||
| NIFTY Pharma Index | Variable | Coefficient | α+β |
| Company Symbol | |||
| ALKEM | RESID(-1)2 (α=ARCH effect) | 0.08753 | 0.985431 |
| GARCH(-1) (β=GARCH effect) | 0.897901 | ||
| AUROPHARMA | RESID(-1)2 (α=ARCH effect) | 0.128139 | 0.988354 |
| GARCH(-1) (β=GARCH effect) | 0.860215 | ||
| BIOCON | RESID(-1)2 (α=ARCH effect) | 0.386858 | 0.856543 |
| GARCH(-1) (β=GARCH effect) | 0.469685 | ||
| CADILAHC | RESID(-1)2 (α=ARCH effect) | 0.121519 | 0.984924 |
| GARCH(-1) (β=GARCH effect) | 0.863405 | ||
| CIPLA | RESID(-1)2 (α=ARCH effect) | 0.096431 | 0.97537 |
| GARCH(-1) (β=GARCH effect) | 0.878939 | ||
| DIVISLAB | RESID(-1)2 (α=ARCH effect) | 0.235938 | 1.039274 |
| GARCH(-1) (β=GARCH effect) | 0.803336 | ||
| DRREDDY | RESID(-1)2 (α=ARCH effect) | 0.158772 | 0.967901 |
| GARCH(-1) (β=GARCH effect) | 0.809129 | ||
| LUPIN | RESID(-1)2 (α=ARCH effect) | 0.162616 | 0.975352 |
| GARCH(-1) (β=GARCH effect) | 0.812736 | ||
| SUNPHARMA | RESID(-1)2 (α=ARCH effect) | 0.172055 | 0.980304 |
| GARCH(-1) (β=GARCH effect) | 0.808249 | ||
| TORNTPHARM | RESID(-1)2 (α=ARCH effect) | 0.152832 | 0.882945 |
| GARCH(-1) (β=GARCH effect) | 0.730113 | ||
Conclusion
The study observed the share price volatility of pharmaceutical companies, listed on NSE NIFTY Pharma Index, during the COVID-19 pandemic. Divi's Laboratories Ltd recorded top rank and Biocon Ltd recorded the least rank with respect to movement of share price. The share returns of all sample companies were volatile during the COVID-19 pandemic period, ranging from December 2019 to November 2020. The result shows that the NSE NIFTY Pharma Index companies share returns were volatile during the COVID-19 pandemic period. There was huge fall in stock price between 1ndand 2nd quarter of 2020 and standard deviation also varied to a large extent during the pandemic period. As the result, COVID-19 pandemic recorded significant impact on the pharmaceutical companies listed in NIFTY Pharma Index. The result revealed that the share price keeps on increasing or decreasing and resulted in overall high share price volatility, during the study period. Hence the result also suggests that investors should carefully invest during the pandemic period and policy makers should give special assistance to the investors during such a time of uncertainty.
References
Georgieva, K. (2020). IMF managing director Kristalina Georgieva's statement following a G20 ministerial call on the coronavirus emergency. International Monetary Fund.
Government of India Ministry of Chemicals & Fertilizers, Department of Pharmaceutical-Annual Report. (2019-20). Retrieved from https://pharmaceuticals.gov.in/sites/default/files/Annual%20Report%202019-20.pdf
Igwe, P.A. (2020). Coronavirus with looming global health and economic doom. African Development Institute of research methodology.
India Brand Equity Foundation (IBEF). Indian Pharmaceuticals Industry Report. (2020). Retrieved from https://www.ibef.org/industry/pharmaceutical-india/infographic
Pandya, B. (2017). Total shareholder return and excess return: An analysis of NIFTY pharma index companies. BVIMSR’s Journal of Management Research, 9(2), 148-156.
SEBI press-releases-Regulatory measures taken by SEBI in view of ongoing market volatility. (2020). Retrieved from: https://www.sebi.gov.in/media/press-releases/mar-2020/regulatory-measures-taken-by-sebi-in-view-of-ongoing-market-volatility_46389.html
SEBI press-releases-SEBI statement on market movement. (2020). Retrieved from https://www.sebi.gov.in/media/press-releases/mar-2020/sebi-statement-on-market-movement_46300.html
Sinha, P., Sawaliya, P., & Sinha, P. (2020). Surviving Coronavirus scare: A journey of stock market amid a slowdown in Indian Economy. Munich Personal RePEc Archive.
Sugirtha, R., Babu, M., Gayathri, J., & Indhumathi, G. (2021). Futures market hedging in indian commodities market-a comparative study on spot and futures price. Academy of Strategic Management Journal, 20(2).
Sugirtha, R., Babu, M., Gayathri, J., & Indhumathi, G. (2021). Testing of co movement in commodities markets. Academy of Strategic Management Journal, 20(3).


