Research Article: 2017 Vol: 16 Issue: 2
Empirical Characteristics of Russian Business Growth
Galina Igorevna Khotinskaya, Financial University under the Government of the Russian Federation
Lyudmila Ivanovna Chernikova, Financial University under the Government of the Russian Federation
Keywords
Corporate Growth, Growth Quality Indicators, Intensity and Growth Efficiency, Financial Risks.
Introduction
The issues of economic growth have been an area of increased scientific interest since the second half of the 20th century. This is due to the desire of economists and politicians to identify the determinants that would allow to overcome the so-called "diminishing returns" (means a smaller increment in the result with each additional unit of capital advanced to the primary factors of production), as well as to find toolkit for sustainable long-term growth of economic systems. Interest in the issues of macroeconomic growth has determined the popularity of the dynamic theory of the firm, the shift in corporate priorities towards the dynamics of development and the change of dominants in growth instruments from endogenous (internal, primarily revenue) to exogenous (external, market) ones. The priorities focused on the corporate growth have been established under these conditions in the economic science and practice since the second half of the 20th century.
Models Of Studying The Corporate Growth
In modern research, the authors have different approaches to the identification of corporate growth. Corporate growth depends on the competitive advantages of the company. In this case, the company should develop a model to identify and use their advantages. As an example, such models can consist of several stages: Preparation, implementation and sustainability of growth. Each stage contains the identification of the most important growth factors. For example in the implementation stage consists of marketing and distribution, project management and business evaluation (Saragih & Anggadwita, 2016). Also competitive advantage can be estimated using the most widely known mathematical theories of war in firms (Chalikias & Skordoulis, 2014). However, this approach is only applicable when comparing two companies (markets, countries, etc.) and is not applicable for individual company.
Another aspect of corporate growth may be the increase of private equity through M&A (Hammer, Knauer, Pflucke & Schwetzler, 2017). But this approach is a special case and cannot be applicable everywhere.
The corporate growth issue in developed markets is interpreted in terms of the VBM concept, which has many interpretations and varieties today (SVA (Shareholders Value Added), EVA (Economic Value Added), CVA (Cash Value Added), EBM (Expectations-Based Management), MVA (Market Value Added), EBO (Edwards-Bell-Ohlson Valuation Model), FEVA (Financial and Economic Value Added), CFROI (Cash Flow Return on Investments), RCF (Residual Cash Flow), CFA (Confirmatory Factor Analysis), FCF (Free Cash Flow), etc.). Each of the VBM concept varieties focuses on its key indicator, which can help measure, forecast and hence manage the corporate value. The concept of value-based management is undoubtedly promising, as it allows bringing corporate management to a higher level:
1. Move from balance to market valuations,
2. Reorient from tactical goals and tasks to strategic priorities,
3. Shift the management emphasis from the current accounting and control to financial forecasting,
4. Change priorities: Replace the sources of profit generation by drivers of the company's value growth (Khotinskaya & Chernikova, 2013).
However, the VBM concept has not been widely adopted in the emerging markets, largely due to the fact that not all of the proposed key indicators are measurable in the conditions of underdeveloped stock market. The issue of corporate growth in this case is interpreted not so much in the perspective of the growth of business value as in the perspective of increasing the scale of activity with its measurement system.
At the same time, practice shows that not any quality of corporate growth can contribute to the company's prosperity in the medium and long term. For example, the unbalanced growth contributes to the accumulation of risks. The growth understood as an increase in book profit can turn into a trap for the company. The growth focused on the exploitation of assets is much more primitive than the one considered a standard of quality. The growth in the company's cost perspective exclusively can be "short-sighted" (Ivashkovskaya, 2006).
This means that maintaining growth in the medium and long term requires indicators that describe the growth quality and tools that enable the development and implementation of appropriate corporate strategies. Various methods to measure dimensions of the quality of corporate growth are used in modern practices, which serve as the basis of management technologies in this field. They include: The criteria for balanced growth (The "Golden rule of the enterprise economy", R. Marris model), the model of growth in terms of sales and profit (Higgins, J. Van Horne, BCG (Boston Consulting Group) models, etc.) (Higgins, 1977), combined models in terms of EVA (Economic Value Added), FCF (Free Cash Flow) and FGV (Future Growth Valuations). FGV is the development of Stern Stewart & Co, a modification of the KBM model. The latter was formulated in the early 80-s of the 20th century by Kester, Brealey & Myers and named after its creators. According to it, the market value of each share can be divided into the share of the company's current assets (capitalized earnings per share) and the share of growth prospects. Empirical estimates of the authors of the KBM model suggest that the value of growth prospects usually exceeds 50% of the share price. (Bradley, Jarrell & Kim, 1984) Table 1.
| Table 1 : Models For Evaluating The Quality Of Corporate Growth | |||
| Indicator name | Economic content | Algorithm of calculation | Note |
|---|---|---|---|
| "Golden rule of the enterprise economy" |
Comparison of the growth rates of profit, sales and assets (property) to evaluate the balance of growth | 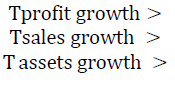 |
>100% |
| Coefficient of Growth Stability (CGS) | Growth secured by an increase in equity capital due to retained earnings or raising additional stock capital | 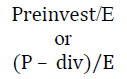 |
?reinvest -reinvested profit ?-equity Div-dividend payments from profit |
| SGR model (sustainable growth rate) | Growth secured by the amount of reinvested earnings | 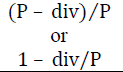 |
P-profit Div-dividend payments from profit |
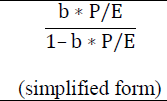
| Higgins model (coefficient of internal growth-A Model Of Optimal Growth Strategy) |
Growth secured by internal funding sources, with the existing return on equity | 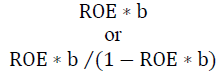 |
b-accumulation ratio ROE-return on equity |
| Model of achievable growth by J. Van Horne | Growth secured by the growth of assets, liabilities and equity (set of equations) |
 |
b-accumulation ratio P-net profit ?-equity |
| BCG model (Boston Consulting Group) |
Growth in sales, subject to maintaining the unchanged operating and financial policies | 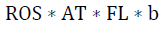 |
ROS-returnonsales AT-asset turnover FL (financial leverage)-in this case, the multiplier of capital b-accumulation rate |
| FGV model (Future Growth Value) | Potential for future growth as a result of the active use of innovative products; proxy indicator of intellectual capital |  |
MV-market value BV-balance valuation EVA/WACC-discounted value |
When evaluating the quality of corporate growth, it is important to compare the dynamic characteristics (g-factors) with indicators of intensity, efficiency and risks, in addition to the above assessment models.
The turnover indicators are used as indicators of the development/growth rate: The overall turnover ratio (turnover of aggregate capital, resource return, return on assets, ??-asset turnover, total assets turnover, turnover ratio, asset management ratio) and its modification BEP (basic earning power, ratio of generated income/gross value added/EVA/profit/cash inflows/net cash flow), describing the generation capacity of this combination of assets.
The indicators of profitability are used as indicators of the efficiency of development/growth: ROS (return on sales), ROCC (return on current costs), ROA (return on assets), ROE (return on equity), ROI (return on investment), etc.
Traditional short-term (cover ratio, current ratio, liquidity ratio, total coverage ratio, total, current liquidity) and long-term characteristics of financial condition can be used as indicators of financial risk: Ratio of autonomy (independence, ownership, concentration of equity), debt burden ratio (dependency, concentration of borrowed capital), as well as the financing ratio describing the ratio of borrowed and internal funding sources or total debt per unit of equity.
Empirical Study Of The Corporate Growth
Comparison of the above indicators with the dynamics of absolute indicators allows formulating a verbal model of development/growth. Let's formulate the basic types of models:
1. Intensive growth is described by high dynamics of absolute indicators, which is primarily secured by acceleration of asset turnover; in this case, high g-factors are observed against the backdrop of growing turnover of aggregate capital and BEP-factors, growth and/or stagnation of profitability are possible, as well as non-observance of proportions in the balances and high but not increasing financial risks; modification of the intensive growth model is catch-up growth, i.e., growth through expansion of the resource base with stable and/or growing indicators of intensity and efficiency;
2. Extensive growth is described by positive dynamics of absolute indicators, which is primarily ensured by the expansion of the resource base; in this case, high g-factors are observed against the backdrop of stagnation of turnover and profitability indicators, imbalances (failure of the "golden rule of the economy" test) and high financial risks are possible; the most flawed variety of extensive growth is the “growth for growth” model, in which high dynamics of absolute indicators is observed against a background of declining turnover and return, growing imbalances and financial risks;
3. Aggressive growth is described by high dynamics of absolute indicators against a background of high intensity and efficiency; the flawed aspect of this growth model is accumulation of financial risks that arise, inter alia, due to imbalance in the dynamics of financial results, sales and resource base;
4. Balanced growth is described by positive dynamics of absolute indicators that meet the requirements of the "golden rule of the economy", with stable and/or improving indicators of short-term and long-term financial condition, against the backdrop of stable or positive (usually low) dynamics of turnover and return.
The Financial University has regularly held empirical studies of the quality of Russian business growth in recent years on the basis of descriptive statistics of Rosstat and the SPARK database. The results of the research allowed making a conclusion that the growth strategy is an unconditional priority for most of the Russian companies. However, specific tools for generating increments are characteristic for Russian business. The key growth indicators proposed in various VBM interpretations are insufficiently informative in the Russian economic environment. Book and economic profit, economic value added, cash flow in net valuation and its modifications in the overwhelming majority of Russian companies either cannot be objectively measured or have negligible values or reveal relatively low dynamics over time. Due to this, they can hardly be considered as corporate priorities. Of course, this does not exclude special cases of using these indicators as key or auxiliary indicators for evaluating the company performance, but on a national scale, corporate priorities are built in another area. The highest growth dynamics is described by such absolute indicators as sales volume (net income), value added, assets and cash inflows. Moreover, the exponential dynamics of these absolute indicators is observed against the background of worsening of relative indicators of development. The main trends in the development of modern Russian companies in 2005-2015 are described as follows:
1. Incremental Dynamics: Incremental dynamics of absolute indicators is illustrated by the exponential trend in terms of sales volume (3.9 times), value added (3 times), assets (5.5 times), cash inflows (4 times); this is partly determined by the impact of inflation on cost values (Figure 1).

Figure 1.Growth Dynamics Of Absolute Indicators Of Russian Business.
2. Development Balance: High g-factors and their comparison in terms of the "golden rule of the economy" point at the imbalanced development/growth (all inequation components exceed 100%, but the assets growth rate exceeds the sales growth rate, while the sales growth rate exceeds the return growth rate); such proportions of development determine the accumulation of systemic risks.
3. Financial Risks: The current liquidity ratio as a key characteristic of the short-term financial condition ranges between 1.21-1.36, which is significantly lower than the foreign criteria-this indicates high risks in the short term, although the liquidity ratio trend is positive; the autonomy ratio as a key characteristic of the long-term financial condition had been consistent with the Russian criterion of financial stability until 2012, because equity capital exceeded the borrowed capital; since 2012, the risks of long-term financial instability have been diagnosed (Figure 2).

Figure 2.Trends Of The Change In Liquidity And Financial Stability.
4. Intensity of Development: The dynamics of turnover ratios is described by a negative trend in the generation of rapidly growing assets (from 0.99 to 0.7), value added (from 0.73 to 0.4), cash inflows (from 1.16 to 0.86), profit (from 0.09 to 0.04)-this points at a decline in the speed of capital turnover (Figure 3).

Figure 3.Intensity Of The Russian Business Development.
5. Growth Efficiency: Classic performance indicators (ROS, ROA & ROCC) grow only in short-term periods, demonstrating negative trends in the decade period (ROS from 8.8% to 5.3%, ROA from 8.8% to 3.7% and ROCC from 13.5% to 8.1%)-this points at a decline in the efficiency of the resource potential usage (Figure 4).

Figure 4.Efficiency Of The Russian Business Development.
Identified Specifics Of The Corporate Growth In Russia
As such, the priorities of Russian business are mostly focused on the dynamic increment of assets, net proceeds (after indirect taxes) and cash inflows. On the one hand, the shift of emphasis to these development indicators organically fits into the strategic objectives of the new paradigm-the cost model of measurement and management; while on the other hand, it indicates "growth diseases" and the specifics of adaptive development of Russian business to the conditions of the modern economic environment. The latter thesis is explained by the fact that the growth indicators in the overwhelming majority of Russian companies are not accompanied by declining financial risks and adequately increasing intensity and efficiency of financial and economic activities. Exponential growth of absolute indicators against the background of financial risks accumulation, declining intensity and efficiency means extensive development, at which most companies inefficiently use the resource potential against the backdrop of underdeveloped financial technology. In accordance with the earlier formulated criteria, such a development format represents a "growth for growth" model.
It must be noted that the results obtained and provided above describe the Russian economy in general. The study was extended to the level of the industry markets and leading companies in these markets. The following activities were analyzed for this purpose: Agriculture, hunting and forestry, fishing, fish farming, extraction of fossil fuels, mining (other than fuel), food production, textile and clothing production, chemical production, metallurgy, production of machinery and equipment, production of electrical equipment, electronic and optical equipment, production and distribution of electricity, gas and water, construction, trade, hotels and restaurants, transport and communications, financial activities, real estate operations, lease and provision of services.
Research Of The Other Countries
In the research by Bravo-Biosca, Criscuolo & Menon (2016) finds the drivers of corporate growth across ten OECD countries (United States, Canada and eight European countries: Austria, Denmark, Finland, Italy, Netherlands, Norway, Spain and the United Kingdom). Using regression analysis, the authors identify the impact on growth at different points of the firms’ employment growth distribution of the regulatory and judicial framework (i.e., bankruptcy law, employment protection legislation), financial market development and R&D fiscal incentives. The study revealed the following major empirical regularities:
1. There is a clear correlation between job expansion and job contraction; these occur simultaneously, confirming the existence of an active process of creative destruction. It also suggests that the process of creative destruction operates both at the “intensive 6 margin” (i.e., the expansion and contraction of incumbent firms) and at the “extensive margin” (i.e., firm entry and exit).
2. High-growth firms (HGFs) make a disproportionate contribution to employment growth. These firms account only for between 3.2% (Norway) and 6.4% (United Kingdom) of all surviving firms with ten or more employees, yet they account for 40% and 64% of all jobs created by surviving firms with ten or more employees in Norway and United Kingdom, respectively. However, non-HGFs still account for between a third and three-quarters of job creation, highlighting the need to consider the full growth distribution when designing policies to foster job creation.
3. Growth is more volatile amongst young businesses and less so among larger and more mature businesses.
4. Services and construction are much more dynamic sectors than manufacturing, with higher levels of both job creation and job destruction.
Conclusion
The results of the study of industry markets and their leading companies match at the trend level. This means that large companies largely generate vectors for the industry markets development. Minor discrepancies are only observed at the level of financial risks: Leading companies are often public joint stock companies (PJSC) and therefore pay more attention to financial statements, including short-term and long-term financial indicators. Overall, the following conclusions were made based on the results of the study of industry markets:
1. Incremental Dynamics: Exponential or linear trends of absolute indicators are observed for all types of activity (primarily for assets, sales volume and value added);
2. Balance of Development: The balance test is performed discretely (in certain years); the cumulative total test for the entire analyzed period (10 years) is not performed in any of the activities under study;
3. Financial Risks: Half of the analyzed financial markets for financial risks are in the all-Russian trend-the current liquidity ratio is below the recommended value but steadily grows, while the autonomy ratio consistently declines; in other cases, the indicators either remain stable or worsen;
4. Intensity of Development: Capital turnover indicators point at a slowdown in most types of economic activity, except for the chemical industry and fishing/fish farming;
5. Growth Efficiency: A downward trend in indicators of return is characteristic for all the industry markets under study, except for construction, production of electrical equipment and fishing/fish farming - there are unstable but growing indicators of return in these industry markets.
As such, the indicators of corporate growth in Russia point at its low quality. This can be traced at the corporate, industry and all-country levels. Exponential growth of absolute indicators against the background of accumulation of financial risks, declining intensity and efficiency indicates extensive development. In accordance with the previously formulated criteria, such a development format represents a "growth for growth" model.
References
- Bradley, M., Jarrell, G. & Kim, E. (1984). On the existence of an optimal capital structure: Theory and evidence. Journal of Finance, 39, 857-878
- Bravo-Biosca, A., Criscuolo, C. & Menon, C. (2016). What drives the dynamics of business growth? Economic Policy, 31(88), 703-742.
- Chalikias, M. & Skordoulis, M. (2014). Implementation of Richardson's arms race model in advertising expenditure of two competitive firms. Applied Mathematical Sciences, 8(81), 4013-4023.
- Chernikova, L.I. (2013). Finansovyye transformatsii v ekonomicheskikh sistemakh: Metody izmereniya i adaptivnyye instrumenty [Financial transformations in economic systems: Methods of measurement and adaptive tools]. Dissertation of the Doctor of Economics, Moscow.
- Donaldson, T. & Preston, L.E. (1995). The stakeholder theory of the corporation: Concepts, evidence, implications. Academy of Management Review, 20(1), 85-91.
- Evans, D.S. (1987). Tests of alternative theories of firm growth. The Journal of political Economy, 4(95), 657-674.
- Gugler, K., Mueller, D. & Yurtoglu, B. (2003). The impact of corporate governance on investment returns in developed and developing countries. The Economic Journal, 113, 511-539
- Hammer, B., Knauer, A., Pflucke, M. & Schwetzler, B. (2017). Inorganic growth strategies and the evolution of the private equity business model. Journal of Corporate Finance, 45, 31-63.
- Higgins, R.C. (1977). How much growth can a firm afford? Financial Management, 6(3).
- Ivashkovskaya, I.V. (2006), Finansovyye izmereniya kachestva rosta [Financial measurements of the growth quality]. Company management, 9.
- Khotinskaya, G.I. (2013). Osobennosti razvitiya rossiyskikh kompaniy v usloviyakh ekonomicheskogo rosta [Specifics of the development of Russian companies in the context of economic growth]. Financial analytics: Problems and solutions, 15(153).
- Khotinskaya, G.I. & Chernikova, L.I. (2013). Sistemnyye transformatsii v makro I mikro finansakh [Systemic transformations in macro and microfinance]. Moscow: Scientific technology.
- Saragih, R. & Anggadwita, G. (2016). Strategy competitive for creating sustainable growth in software development in Indonesia: A conceptual model. Procedia-Social and Behavioral Sciences, 219, 668-675.
- Varadarajan, P. (1983). The sustainable growth model: A tool for evaluating the financial feasibility of market share strategies. Strategic management journal, 4(4), 353-367.