Research Article: 2022 Vol: 25 Issue: 5S
Estimating competitiveness in the food service market using fuzzy logic
Gertrudis Ziritt-Trejo, Business School of la Universidad
Zahira Moreno-Freites, Business School of la Universidad
Marilú Acurero-Luzardo, FACEA Corporación Universitaria del
Lucimio Jiménez-Paternina, FACEA Corporación Universitaria del
Citation Information: Ziritt-Trejo, G., Moreno-Freites, Z., Acurero-Luzardo, M., & Jiménez-Paternina, L. (2022). Estimating competitiveness in the food service market using fuzzy logic. Journal of Management Information and Decision Sciences, 25(S5), 1-17.Abstract
Computational intelligence framed in the discipline of fuzzy logic is currently a highly used tool for complex decisions in the field of business, however, little used as an instrument for public policy formulation in the agri-food sector, specifically in the FoodService ecosystem, which represents a novelty. The objective of this study is to estimate the competitiveness of the FoodService market in the Department of Sucre, Colombia. From this analysis perspective, this method allowed to address the gap that exists between the use of traditional economic analysis strategies and the technological contributions of diffuse control characterized by imprecision; benefiting the practical reality of management in the ecosystem. The results of the model suggested a 30-degree output that translates into a basic level of competitiveness; important information that can be used by decision makers, on the one hand, for sector optimization in terms of competitiveness and, on the other hand, an opportunity for the adequate elaboration of policies and projects that generate and promote a sustainable development of the FoodService ecosystem in the region.
Keywords
Food Service Market; Competitiveness; Fuzzy logic; MATLAB; Fuzzy Inference System.
Introduction
The economic panorama of the food services sector is increasingly experiencing the opening of different orientations and markets which explain its growth over time (Girod et al., 2014). This sector has evolved since its creation and will presumably continue to do so in future. It involves the entire network of production and distribution of food, equipment and services, and is aimed at serving establishments which prepare and supply food for people outside their home (Huidobro et al., 2019).
According to Clúster Foodservice (2019), this sector is expanding in an extraordinary way, especially in the work environment due to “the impediments to eat home during the workday or because of the short time to eat in order to reduce the working day". Around the world, the development of this market has been most pronounced in China. However, the Latin American economy is underpinned by new opportunities for competitiveness in the sector, worthy of being studied with a view to promoting local development (Antunes et al., 2010).
In Colombia, food services are being developed in a structured way in the main cities of the country, directed by large food industries to serve gastronomic operators. These establishments require agricultural products such as meat, fruit, vegetables, grains, among others, as well as diversity in terms of flavors, smells and colors in food for mass consumption on the one hand as well as food which is more typical of the regions. The Department of Sucre is a major player in terms of the supply of the relevant raw materials and the generation of gastronomic varieties. However, improvements could be made in terms of configuring a competitive food service system which would allow it to boost its growth and performance in the country's food sector.
Given that competitiveness can be conceived as a sustainability instrument to find factors that generate distinctive advantages in the business field (Porter, 2011; Horlings & Marsden, 2014), and that there are various ways to search for, measure and promote such factors, many authors have carried out studies with innovative methods, such as applying fuzzy inference systems (Herrera et al., 2013; Mathison et al., 2007; Schmidt et al., 2012), to improve the competitive capacity of organizations by increasing their market share.
However, the review of the scientific literature to 2020 of high impact (WoS/Scopus) evidences the null relation of diffuse methods for the study of the sector of Food Service. Similarly, it is evident that research linked to the study of public policies and fuzzy logic has been fundamentally and poorly directed towards environmental evaluation and sustainable development.
In this context, the scale and scope of business dynamics are important for realizing and leveraging competitiveness in the Colombian agri-food sector. Hence, it is necessary to develop viable analyses of new strategies for management which contribute to decision-making by virtue of generating results which are transferable and generalizable beyond contextualized study models. Such is the case of fuzzy inference models, a domain which is receiving increasing attention in the literature (Blanco, 2020; Blanco et al., 2017; Radović-Marković et al., 2019). These models transcend classical logic towards a fuzzy logic (FL) system, by means of which imprecise information is put to use by combining input variables, fuzzy sets, and groups of rules directed to output values in a control mechanism using oscillating expressions between absolute truth and total falsehood to construct reasoning in terms of possibilities (Martínez, 2007; Moghadamzadeh et al., 2020). Consequently, the present study is carried out with the objective of estimating the competitiveness of the food service market in the Department of Sucre, Colombia through fuzzy logic.
It is considered viable to analyze competitiveness using fuzzy logic systems, since FL-based models allow representing experience and common knowledge via linguistic labels which are commonly used in human reasoning; these labels are then combined with numerical expressions that estimate the certainty of a proposition in degrees (Pérez, 2005). From this analytical perspective, the modeling of the problem under study considers the dimensions of competitiveness as input variables, while the level of competitiveness of the food service market estimated is an output variable.
Fuzzy logic has been frequently used successfully in technological systems of control; however, it is considered necessary to continue searching for new areas for its application, as it is the case of this research, in the field of agri-food productive economy through the Food Service market, whose practical use could be recognized as a strategy of prospective analysis useful for the approach of policies and projects that generate and promote a sustainable development in the ecosystem of the region's Food Service (Crowder & Reganold, 2015; Dixit et al., 2022).
In what follows, the model is applied to the five municipalities which constitute the Department of Sucre, Colombia. The aim is to provide results which can be leveraged by decision-makers pursuant of sectoral optimization in terms of competitiveness and the appropriate configuration of economic development policies in public and private sectors.
The productive economic analysis of the Foodservice in Colombia, seen from this perspective of diffuse control, through the techno-logical recognition of mathematical and linguistic patterns, addresses the procedural gap between the use of alternative strategies and methods from different and distant disciplines.
It is worth mentioning that even though there are limitations in this study referred to the same lack of diffusion of the focus in the socioproductive field and to the almost null explanatory theory of economic analysis from the postulates of this method; investigations such as the present one, open the portal for the study of new economic models and a change in the concept of the administrative function of control, for new structures in modeled controllers.
Methodology
Food services involve different companies dedicated to the business of catering or food preparation. Accordingly, data from 253 establishments (i.e. suppliers, restaurants and event organizers), legally constituted in the municipalities of the Department of Sucre, Colombia were considered: Sincelejo, Corozal, Sampués, Tolú and Coveñas.
First, a descriptive exploratory investigation was carried out as a precursor to the main analysis which has the overall aim of generating policy-relevant insights for the food services sector using a fuzzy Mamdani-type inference system constructed using MATLAB.
Fuzzy System Design
The computational foundation of the fuzzy inference system (FIS) is fuzzy set theory, fuzzy IF-THEN rules, and fuzzy reasoning. Structurally, this follows a procedure oriented on three foundations: fuzzy rules base, knowledge base (membership functions) and reasoning mechanisms which execute the fuzzy inference procedure where the inputs and outputs can be hard or fuzzy values (Buckley & Eslami, 2002).
Following the block diagram presented by Jang et al. (1997), the steps involved in the design of a fuzzy system involve input, fuzzification, inference mechanisms, aggregation, defuzzification and output, as seen in Figure 1.
To operationalize this, the extant literature was leveraged in conjunction with input from 15 experts in the agri-food sector. To meet validation and robustness objectives, the model is constructed according to the following steps.
1. The input and output variables are defined, that is, the dimensions of competitiveness and the realized competitiveness, respectively.
2. Fuzzy features are formulated in a Mamdani type FIS - this method was chosen based on the nature and extent of the available data. As well as being intuitive, this model offers advantages in terms of its amenability to implementation. It is also the most-widely used model of its type and hence its fitness-for-purpose has already been established in the literature. The fuzzy sets and linguistic labels considered in all dimensions will be ´favorable´, ´less favorable´ and ´unfavorable´ to infer desirable and counterproductive behaviors of the companies in the sector. Fuzzy ranges of 0-10 are designated for the input variables according to the programmed logic in the parameters of each fuzzy set.
3. The membership functions follow Gaussian distributions for the input variables (chosen for their flexibility and concise nonzero notation at all points). While for the output variable, a triangular function is implemented due to its practicality, ease of computation and conclusive logical structure.
4. The knowledge base and decision rules are built with IF-THEN statements e.g., "IF X1 is A1 and X2 is A2 and X3 is A3 THEN Y is B" where IF indicates one or more background conditions and THEN are the consequences. In this sense, taking the knowledge and recommendations of domain-relevant experts as the reference, a great variety of drift sentences are generated that indicate diffuse relationships in all possible combinations, with the assistance of the logical connector.
5. Taking into account the operations of composition, inference mechanisms, and aggregation, the final diagnosis is carried out in the concretion sub-process, linking the evaluations of each variable, obtaining a specific value for the solution of the created system.
Modeling the Market Competitiveness of Food Services by Diffuse Inference
Identification of input variables
The design of a model by diffuse inference for estimating the competitiveness of the food service Market in the Department of Sucre, Colombia, begins with the selection and categorization of the input and output variables. It is important to highlight that the food service market arises in the absence of a service that is truly adapted to the needs of those gastronomy businesses that acquire their supplies in wholesaler stores or retail clubs and experience excessive waste of products (Balaji & Arshinder, 2016). Thus this market can fill the gap that the food manufacturing industry had with respect to these users. Consequently, the beneficiaries of the food service system are all those companies and individuals (restaurants, hotels, resorts, social and sports clubs, and fast food services) that have a direct or indirect relationship with food handling, seeking competitiveness in quality, presentation and prices (Karipidis et al., 2009; Kaganzi et al., 2009; Van Wijnbergen, 1986). Expanding the benefits of the food service market through technology is a key objective in Colombia, especially in the Department under study. The achievement of a culture of competitiveness, new econometric concepts, management technologies, and expansion of supply are critical in this respect. For this, it is necessary to be clear about the dimensions of competitiveness as critical elements whose optimization will allow the development of the sector. In this study, six groups of operational activities that generate value for this type of organization are considered, through an adaptation of the elements considered in the value chain exposed by Porter (2011) and the competitiveness factors proposed by the Inter-American Development Bank (Saavedra, 2012). Consequently, the level of competitiveness is analyzed with each sub-process: Planning, Purchasing, Food production, Services (sale of food), Personnel Management, and Technological development/Equipment (Cleveland et al., 2003).
Planning
Planning implies transcendental decisions related to future phenomena and processes. It is "the selection and relationship of facts, as well as the formulation and use of assumptions regarding the future in the visualization and formulation of the proposed activities that are believed to be necessary to achieve the expected results." (Terry & Franklin, 1986). Planning which takes place for the purposes of optimizing future competitiveness is strategic by definition and its success, or lack thereof, can be gauged by defining and using appropriate indicators (Bostock et al., 2010).
For its structuring in the FIS, fuzzy sets located in the range of 0-10 are considered and three response levels are established as follows
Favorable: When planning is applied in the company and its development is favorable to obtain optimum levels of competitiveness.
Less favorable: When planning is only applied sometimes, being less favorable to the value sys-tem.
Unfavorable: When planning disadvantages the normal flow of the company’s periodic activities.
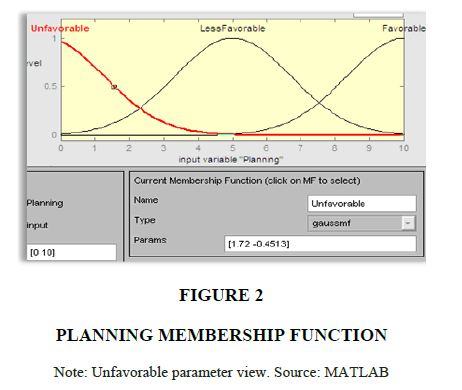
The Membership Function is presented as a Gaussian distribution with the following parameters: Favorable 1.7 10.03 (from 8-10); Less Favorable 1.7 5.01 (3-7); Unfavorable 1.72 0.451 (0-1.72), as observed in Figure 2.
Purchases
This variable shapes the logistics of the company and is linked to purchasing activities, disposition of inputs, and raw materials for the next food production sub-process. It is based on the menu provided in the planning stage, through a procedure considered complex due to its diversity, which requires a high degree of competence to make decisions at the right time, in the right quantity and the quality level of the products to buy, in such a way that provisioning and inventory management are its main indicators.
Similarly to planning, three levels of responses for this variable are considered in fuzzy sets located in the range of 0-10.
Favorable: the purchasing subprocess effectively favors the fulfillment of the company's com-mercial commitments.
Less favorable: the criteria in the purchasing process are less favorable to the system in terms of its periodic application.
Unfavorable: when supply and inventory management undermine the improvement of the company's competitiveness.
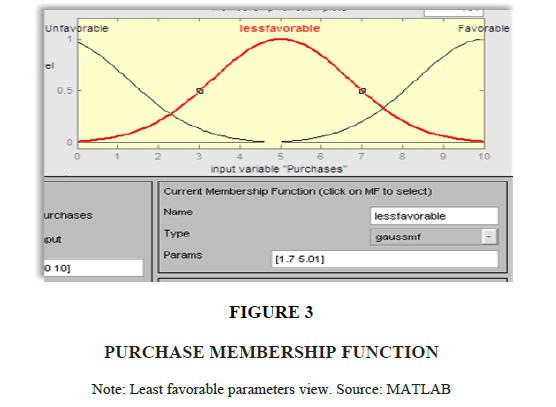
The Membership Function is presented as a Gaussian distribution with the following parameters: Favorable 1.7 10.03 (from 8-10); Less Favorable 1.7 5.01 (3-7); Unfavorable 1.72 0.451 (0-1.72), as seen in Figure 3.
Food production
Control of the food production area in the food service market constitutes one of the most influential requirements in its value chain as the main point in the elaboration of the final product, where it will have to adequately manage costs and each activity in such a way that they do not affect the output in the services and sales thread. It includes the following indicators: planning and production process, production capacity, general aspects of quality and quality system.
The three levels of responses for this variable are estimated in fuzzy sets located in the range of 0-10.
Favorable: the Company’s production sub-process favors the production of products with quality and competitive costs.
Less favorable: the application of the indicators in the food production sub-process is less favorable to a competitive quality system in the market.
Unfavorable: when weaknesses in planning, production capacity and quality disadvantage the improvement of the company's competitiveness.
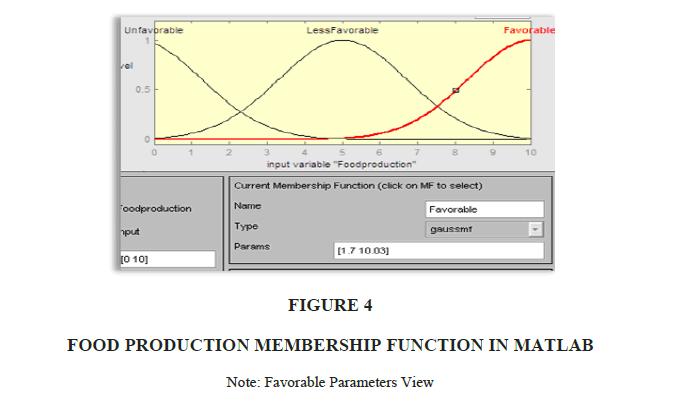
The Membership Function is presented as a Gaussian distribution with the following parameters: Favorable 1.7 10.03 (from 8-10); Less Favorable 1.7 5.01 (3-7); Unfavorable 1.72 0.451 (0-1.72), as seen in Figure 4.
Services (food sales)
The Services variable, food sales, translates to the identifiable and intangible activities that are the main object of a transaction designed to provide customer satisfaction (Stanton et al., 2004, Sethi et al 2022). These activities are framed in the definition of objectives, strategies, plans, information on competitors, innovation and forms of distribution. This includes the following indicators: Marketing and sales, Services and Distribution.
The three levels of responses for this variable are estimated in fuzzy sets located in the range of 0-10.
Favorable: the marketing and sales plans applied by the company favor its competitive positioning and commercialization.
Less favorable: the application of the indicators in the Services sub-process (sale of food) is less favorable to its competitive situation.
Unfavorable: the marketing, sales, services and distribution mechanisms that are used do not favor the development of the company in the market in which it competes.
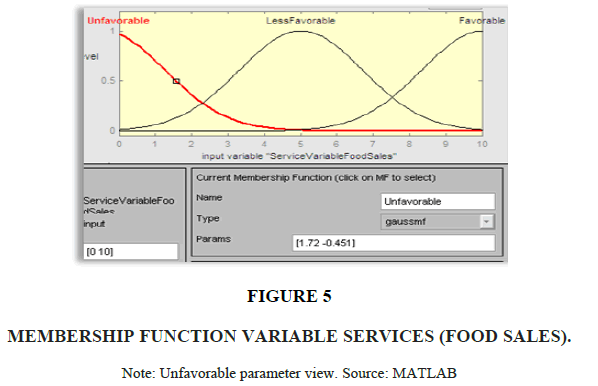
The Membership Function is presented as a Gaussian distribution with the following parameters: Favorable 1.7 10.03 (from 8-10); Less Favorable 1.7 5.01 (3-7); Unfavorable 1.72 0.451 (0-1.72), as seen in Figure 5.
Personnel management
Human resources are the main asset in the food service market and the extent of business success is inextricably linked with the quality of the employees. The variable Personnel management is defined as the application of organizational strategies based on needs and human characterization to harmonize workgroups with the purpose of achieving the objectives set out in business strategic planning with the greatest satisfaction of the available human talent (Porret, 2010). It is based on the following indicators: General aspects regarding the structure and organization within the company, training and promotion of personnel, organizational culture, industrial health and safety.
The three levels of responses for this variable are estimated in fuzzy sets located in the range of 0-10.
Favorable: personnel management is conducive to high employee performance, in accordance with the company’s competitiveness objectives.
Less favorable: the personnel management activities promoted by the company are less favorable to the motivation and sense of belonging of its workers, thus jeopardizing competitiveness.
Unfavorable: the weaknesses in the programs and personnel policies in the company disadvantage their identification with determining objectives in the development of competitiveness.
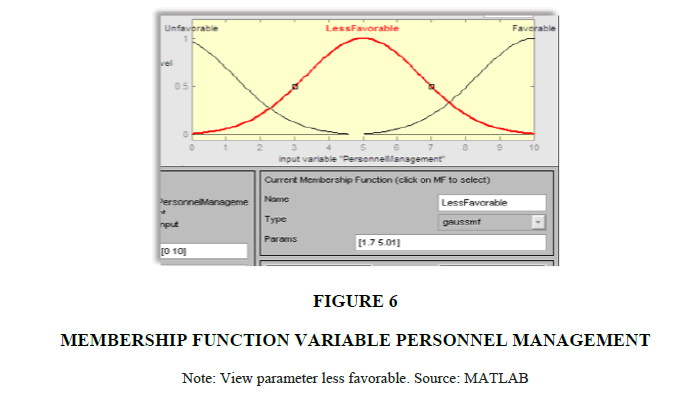
The Membership Function is presented as a Gaussian distribution with the following parameters: Favorable 1.7 10.03 (from 8-10); Less Favorable 1.7 5.01 (3-7); Unfavorable 1.72 0.451 (0-1.72), as seen in Figure 6.
Technological development/equipment
The use of new technology and the consideration of adequate infrastructure and equipment are elements appreciated by the end user of the product in the food service market, therefore, they constitute not only the ability to offer an excellent food sales service, but also guarantee convenience and comfort at the time of sale and final consumption of the product. This variable is measured through the following indicators: research and development, location of infrastructure, equipment and maintenance.
The three levels of responses for this variable are estimated in fuzzy sets located in the range of 0-10.
Favorable: the use of adequate technology, infrastructure and equipment favors the approach and the creation of loyalty of current and future clients to support the achievement of improved business competitiveness.
Less favorable: the orientation that the company presents in technological development and equipment is less favorable for customer satisfaction in its perception of attention and service.
Unfavorable: the development of technology and equipment in the company is unfavorable to the appreciation of customers who seek, in addition to a good product, comfort and up-to-date technology in the company's facilities that position it competitively in the market.
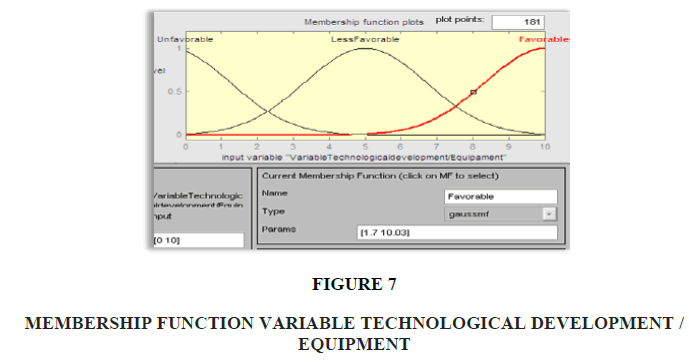
The Membership Function is presented as a Gaussian distribution with the following parameters: Favorable 1.7 10.03 (from 8-10); Less Favorable 1.7 5.01 (3-7); Unfavorable 1.72 0.451 (0-1.72), as seen in Figure 7.
Identification of output variable: Level of competitiveness
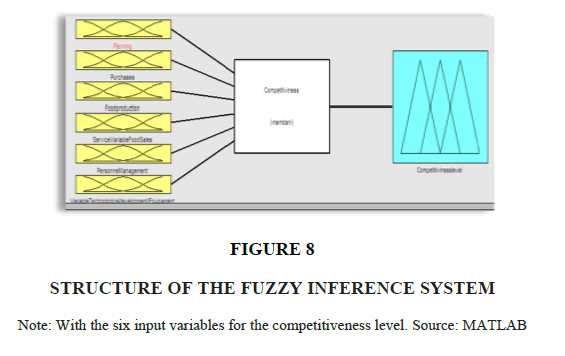
The estimation of the level of competitiveness of the food service market is essentially based on the competitive advantage that it can obtain from the production and organization processes, highlighting that today innovation and quality are also part of its measurement, as it is a dynamic concept that is transformed over time (Mathison et al., 2007; Moreno et al., 2018). In identifying the output variable in the case study, competitiveness is made up of the favorable to unfavorable application of the six subprocesses identified as input variables, resulting in the fuzzy inference system presented in Figure 8.
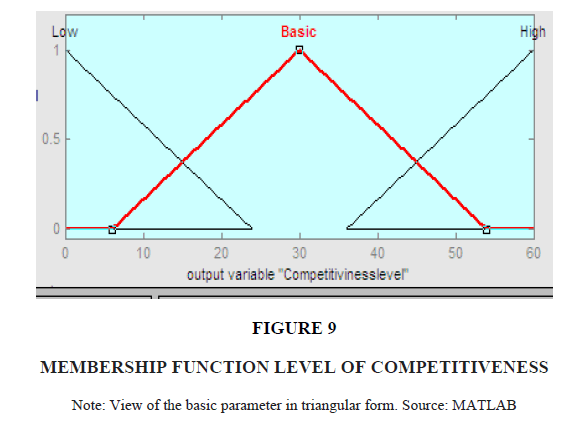
The output variable reflects the fuzzy analysis of the input variables and their relationships ac-cording to each estimation criterion, recognizing three fuzzy sets located in the range of 0-60 with an equidistant partition of the six competitiveness sub-processes. The program that returns the relevant parameters for the fuzzy sets as follows
High: the favorable application of sub-processes in the value chain generates high competitiveness, allowing the company to maintain or increase its market share.
Basic: the less favorable application of the sub-processes reduces relevance to the achievement of advantageous levels of competitiveness.
Low: unfavorable sub-process management in the value chain leads to low levels of competitiveness in the company (Acurero et al., 2020).
The Membership Function is presented as a Triangular distribution with the following parameters High (36-60-84) Basic (6-30-54) Low (-24-0-24), as observed in Figure 9.
Knowledge base for the model
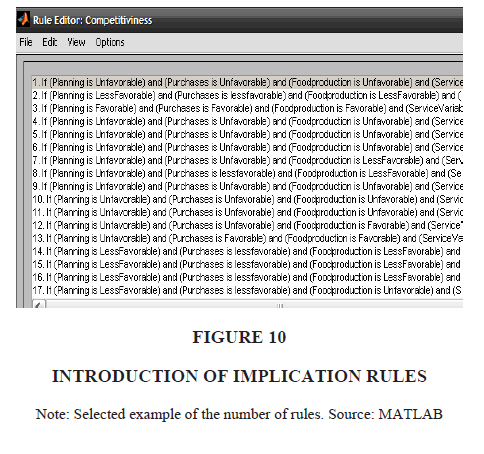
Once the system variables, the linguistic labels that qualify them, the ranks and the membership functions were defined, the knowledge bases or model rules that allow predicting the behavior between variables were defined. According to Restrepo & Vanegas (2015), these implication rules are used in fuzzy reasoning as a method that allows the quantification of a particular type of fuzzy relationship: it serves to translate the fuzzy condition A → B to a fuzzy relationship. Table 1 presents an extract of the large number of judgments derived from the production and organization processes.
| Table 1 Competitiveness Positioning In The Food Service Market |
||||||
|---|---|---|---|---|---|---|
| IF | THEN | |||||
| Planning | Purchases | Food Production | Services (Food Sales) | Personnel Management | Technological Development / Equipment | Level of competitiveness |
| Favorable | Favorable | Favorable | Favorable | Favorable | Favorable | High |
| Favorable | Favorable | Favorable | Favorable | Favorable | Favorable | Basic |
| Favorable | Favorable | Favorable | Favorable | Favorable | Favorable | Low |
| Unfavorable | Unfavorable | Unfavorable | Unfavorable | Unfavorable | Unfavorable | Low |
| Less-favorable | Less-favorable | Less-favorable | Less-favorable | Less-favorable | Less-favorable | Basic |
| Favorable | Favorable | Favorable | Favorable | Favorable | Favorable | High |
| Unfavorable | Unfavorable | Unfavorable | Unfavorable | Unfavorable | Less-favorable | Low |
| Unfavorable | Unfavorable | Unfavorable | Unfavorable | Less-favorable | Less-favorable | Low |
| Less-favorable | Less-favorable | Less-favorable | Favorable | Favorable | Favorable | High |
| Favorable | Favorable | Favorable | Less-favorable | Less-favorable | Unfavorable | Basic |
The sentences were exchanged through the And logical connector, creating all the possible combinations of system control rules. An excerpt of this is shown in Figure 10, as they were introduced to the model, taking into account that "the more rules and use cases are specified in the model based on the possible combinations and scenarios that may arise, the greater the precision obtained as the final result of the model" (Herrera et al., 2013).
Fuzzy Inference System In The Competitiveness Of The Food Service Market: Implementation And Results
With all the organized system data and the information collected through surveys with 15 experts in the sector (3 experts for each municipality), the MATLAB fuzzy logic toolbox was used to evaluate the behavior of the model's input variables.
Graphing Rules and Grades
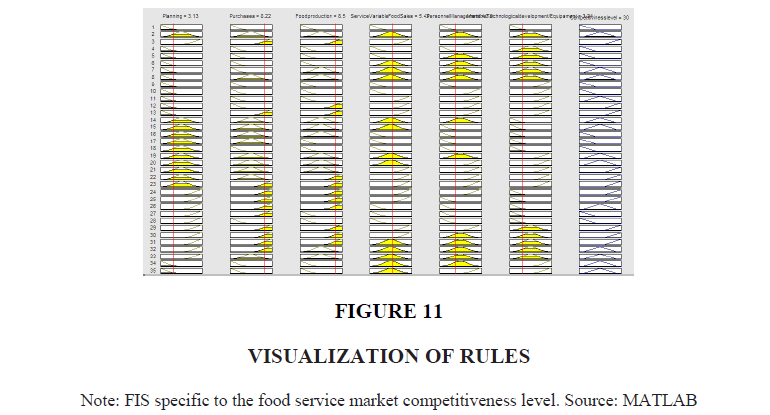
Results pertaining to the competitiveness of the food service market are visualized in Figure 11.
This is based on values of each input variable as follows: Planning (3.13), Purchases (8.22), Food Production (8.5), Food Sales (5.43), Personnel Management (3.9), and Technological Development/Equipment (3.24). The output response of 30 translates to a basic level of competitiveness.
Consequently, the resulting rule is stated as follows: If Planning is Less Favorable, Favorable Purchases, Favorable Food Production, Less favorable Food Sales, Less favorable Personnel Management and Development.
Technological/Less Favorable Equipment IN-TONCES the level of competitiveness is Basic. It thus evidences favorable tendencies regarding Purchases and Food Production, which had been predicted as, geographically, the Department of Sucre in Colombia offers great opportunities in the agri-food industry. However, there is a need for substantial improvement with respect to the remaining variables to move them from the least favorable to favorable label.
Fuzzy Surfaces
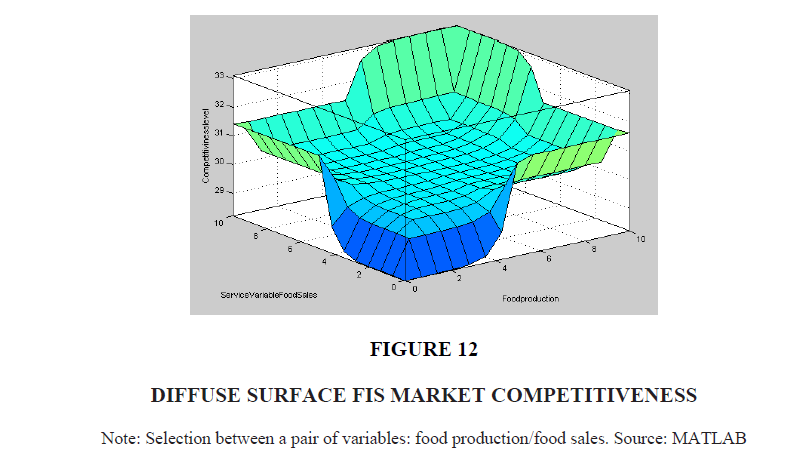
The diffuse surfaces resulting from the implementation of the FIS allow us to visualize the potential relationships between input and output variables, combining pairs of variables with the level of competitiveness. In Figure 12, the predictor variables are shown on the X and Y scales and the response variable is Z. This represents a significant tool for the detailed analysis of the results. According to (Restrepo & Vanegas, 2015), its reading depends on the shape of the graph, "if the surface is deformed, it indicates that the model is consistent".
In Figure 12, where the results of the Food Production (8.50) and Food Sales (5.43) pair are combined with respect to the output variable, a deformed graph indicating nonlinearity between variables is apparent. The response surface is curved because the model contains quadratic terms that are statistically significant.
The data indicates that the application of the first variable is Favorable and the second is less favorable, even so, they contribute to the increase in the level of competitiveness and form a binding double for decision-making on the growth opportunities of the sector (García et al., 2014).
From the same perspective there is a constant effect on the level of competitiveness from the following pairs of variables: Personnel Management-Food Production; Personnel management-Purchases; Food Shopping-Sale.
Conclusion
This paper serves to highlight the advantages of artificial intelligence to econometrics, as a novel way to analyze predictive situations and uncertainty in competitiveness studies. Likewise, it is highlighted that it has constituted a significant contribution that approaches and diminishes the gap of knowledge and acceptance of new methods of fluctuating economic measurement be-tween probabilities and estimation of projections in complex ecosystems like Foodservice that are in constant change, among other aspects, due to consumers' preferences. The practical use of the dissemination methodology could thus become a fundamental part of the sectoral decision-making process and for the development of public policy formulation processes.
Via the case study, it was possible to verify the data analyzed in a previous descriptive investigation, increasing the thoroughness of the results in the SID and revealing new findings that make it possible to take advantage of the benefits of this tool to diagnose the economic environment and the impact of its application to the agri-food sector, specifically the food service market. The competitiveness of this market was estimated to be at a basic level. This is consistent with publicly available rankings which have suggested that the competitiveness in the Department is one of the lowest in Colombia. Sucre has been ranked 20th among 29 territorial entities. Whilst, according to Observatory of Labor Marketing Corporation for Sucre in 2011 Sincelejo, the capital of the Department of Sucre, is ranked 21st among 22 analyzed cities in the country. Finally, ìt was in position 16 among 23 cities in Colombia.
Going forward, a commitment to the development of the agro-industrial sector as well as the integration of the food service market value chain as part of public policy is important. Therein, technology and information have a fundamental role in implementation and it is important to include all salient actors and entities across the public and private sectors. Undoubtedly, addressing decision-making for the improvement of the sector in some practices of the investigated sub-processes, especially in Planning, Personnel Management and Technological Development/Equipment is necessary, as they are critical for achieving high levels of competitiveness. This is the overarching challenge so that the food sector market contributes optimally to the economic development of the Sucre Department, Colombia.
In the analysis of the fuzzy surface graphs, some inconsistent behaviors were manifested. Hence it is recommended to carry out new investigations that lead to the revision of knowledge rules, append more combinations, and exhaust possibilities. There is also scope to propose the creation of other fuzzy sets for the input and output variables.
growth and potential of the food service market in the Sucre Department, specifically in the municipalities of Sincelejo, Corozal, Sampués, Tolú and Coveñas, is evident in evolution and consolidation. As an example, this was observed in the behavior of the following variables: Production of Food, Purchases and Services (food sales). As such it is an attractive economic model worthy of support in terms of financial investments and policy interventions.
References
Acurero, M; Paternina, L; Ziritt, G; Moreno, Z (2020). Competitiveness and foodservice: a situational analysis of the sector in the department of Sucre – Colombia). En el libro Sostenibilidad, competitividad y gestión en las organizaciones: experiencias Latinoamericanas. Jorge Salas Ruiz y Lisandro Alvarado, Editores/ Compiladores. Fondo Editorial de la Universidad César Vallejo, Perú.
Antunes, L.D.C., Levandovski, R., Dantas, G., Caumo, W., & Hidalgo, M. P. (2010). Obesity and shift work: chronobiological aspects.Nutrition Research Reviews,23(1), 155-168.
Indexed at, Google Scholar, Cross Ref
Balaji, M., & Arshinder, K. (2016). Modeling the causes of food wastage in Indian perishable food supply chain.Resources, Conservation and Recycling,114, 153-167.
Indexed at, Google Scholar, Cross Ref
Blanco-Mesa, F. (2020). La ciencia de la decisión.Revista UIS Ingenierías,19(2), 193-197.
Blanco-Mesa, F., Merigó, J.M., & Gil-Lafuente, A.M. (2017). Fuzzy decision making: A bibliometric-based review.Journal of Intelligent & Fuzzy Systems,32(3), 2033-2050.
Indexed at, Google Scholar, Cross Ref
Bostock, J., McAndrew, B., Richards, R., Jauncey, K., Telfer, T., Lorenzen, K., ... & Corner, R. (2010). Aquaculture: global status and trends.Philosophical Transactions of the Royal Society B: Biological Sciences,365(1554), 2897-2912.
Buckley, J. J., & Eslami, E. (2002).An introduction to fuzzy logic and fuzzy sets(Vol. 13). Springer Science & Business Media.
Indexed at, Google Scholar, Cross Ref
Cleveland, T. E., Dowd, P. F., Desjardins, A. E., Bhatnagar, D., & Cotty, P. J. (2003). United States Department of Agriculture—Agricultural Research Service research on pre‐harvest prevention of mycotoxins and mycotoxigenic fungi in US crops.Pest Management Science: formerly Pesticide Science,59(6‐7), 629-642.
Indexed at, Google Scholar, Cross Ref
Clúster FoodService (2019). Business development project in the food service markets of Chile and Colombia. Proyectos realizados.
Crowder, D.W., & Reganold, J.P. (2015). Financial competitiveness of organic agriculture on a global scale.Proceedings of the National Academy of Sciences,112(24), 7611-7616.
Indexed at, Google Scholar, Cross Ref
Dixit, R.S., Choudhary, S.L., Jain, S., & Srivastava, R. (2022). Public sentiment analysis of the major competitors in the electronics sector in the Indian context. Journal of Management Information and Decision Sciences, 25(S3), 1-16.
García, R.E., Benjamin, G.F., & Perez, R.B. (2014). Impact assessment of training with fuzzy logic.Revista chilena de ingeniería,22(1), 41-52.
Girod, B., van Vuuren, D. P., & Hertwich, E. G. (2014). Climate policy through changing consumption choices: Options and obstacles for reducing greenhouse gas emissions.Global Environmental Change,25, 5-15.
Herrera, F., Romero, R., & Olmos, C. (2013). Competency-based recruitment method based on fuzzy logic. Red Internacional de Investigadores en Competitividad, 7(1), 419-438.
Horlings, L. G., & Marsden, T. K. (2014). Exploring the ‘New Rural Paradigm’in Europe: Eco-economic strategies as a counterforce to the global competitiveness agenda.European Urban and Regional Studies,21(1), 4-20.
Indexed at, Google Scholar, Cross Ref
Huidobro, D., Lomparte, V., Morales, G. & Valdez, M. (2019). Proposal of a new distribution model for the Horeca channel of a mass consumption company. (Master's thesis). Lima, Perú: Universidad Peruana de Ciencias Aplicadas (UPC).
Jang, J. S. R., Sun, C. T., & Mizutani, E. (1997). Neuro-fuzzy and soft computing-a computational approach to learning and machine intelligence[Book Review]. IEEE Transactions on automatic control, 42(10), 1482-1484.
Kaganzi, E., Ferris, S., Barham, J., Abenakyo, A., Sanginga, P., & Njuki, J. (2009). Sustaining linkages to high value markets through collective action in Uganda.Food policy,34(1), 23-30.
Karipidis, P., Athanassiadis, K., Aggelopoulos, S., & Giompliakis, E. (2009). Factors affecting the adoption of quality assurance systems in small food enterprises.Food control,20(2), 93-98.
Martínez, C. (2007). Use of Data Preprocessing and Artificial Intelligence (Fuzzy Logic) Techniques in Banking Risk Classification/Prediction (Bachelor's thesis). Universidad de los Andes, Bogotá, Colombia.
Mathison, L., Gándara, J., Primera, C., & García, L. (2007). Innovation: key factor to achieve competitive advantages.Revista Negotium, (7), 65-83.
Moghadamzadeh, A., Ebrahimi, P., Radfard, S., Salamzadeh, A., & Khajeheian, D. (2020). Investigating the role of customer co-creation behavior on social media platforms in rendering innovative services.Sustainability,12(17), 6926.
Moreno, Z., Castellano, M., Ziritt, G. & Silva, H. (2018). Labor Happiness and SMEs: Views from a Conflicting Latin American Context. Opción, 34(18). 1037-1068.
Pérez, R. (2005). Processing and Optimization of Raman Spectra by means of Fuzzy Logic Techniques: Application to the identification of Pictorial Materials (Doctoral thesis).Polytechnic University of Cataluña, Barcelona, España.
Porret, M. (2010). People: A Handbook for Managing Human Capital in Organizations. (4 ed). Madrid, España: ESIC Editorial.
Porter, M. (2011). The Competitive Advantage: Creating and Sustaining Superior Performance. New York, Estados Unidos: Simon and Schuster.
Radović-Marković, M., Salamzadeh, A., & Vujičić, S. (2019). Selection of organization models and creation of competences of the employed people for the sake of competitiveness growth in global business environment.International Review, (1-2), 64-71.
Restrepo Morales, J.A., & Vanegas López, J.G. (2015). Internationalization of SMEs: analysis of resources and internal capabilities using fuzzy logic.Contaduría y administración,60(4), 836-863.
Saavedra, M. (2012). Determining the competitiveness of the Latin American SMEs. Macroproyecto de investigacion ALAFEC.
Schmidt, O., Padel, S., & Levidow, L. (2012). The bio-economy concept and knowledge base in a public goods and farmer perspective.Bio-based and applied economics,1(1), 47-63.
Sethi, G., Yadav, A. S., & Singh, C. (2022). Two ware-houses fuzzy inventory model for deteriorating items with ramp type demand and shortages. Journal of Management Information and Decision Sciences, 25(2), 1-22.
Stanton, W., Etzel, M. & Walker, B. (2004). Fundamentals of Marketing. (13ª ed). México: McGraw Hill Interamericana.
Terry, G., & Franklin, S. (1986). Principles of Administration). México: Continental, S.A.
Van Wijnbergen, S. (1986). Exchange rate management and stabilization policies in developing countries.Journal of Development Economics,23(2), 227-247.
Received: 02-Mar-2022, Manuscript No. JMIDS-22-11427; Editor assigned: 04-Mar-2022, PreQC No. JMIDS-22-11427(PQ); Reviewed: 16-Mar-2022, QC No. JMIDS-22-11427; Revised: 21-Mar-2022, Manuscript No. JMIDS-22-11427(R); Published: 24-Mar-2022

