Research Article: 2022 Vol: 25 Issue: 4
Estimation of population mean using ratio type imputation technique with linear combination of two auxiliary variable under two-phase sampling
Deepjan Gohain, North Eastern Regional Institute of Science and Technology
Krishnajyoti Nath, North Eastern Regional Institute of Science and Technology
Singh BK, North Eastern Regional Institute of Science and Technology
Citation Information: Gohain, D., Nath, K., & Singh, B.K. (2022). Estimation of population mean using ratio type imputation technique with linear combination of two auxiliary variable under two-phase sampling. Journal of Management Information and Decision Sciences, 25(S5), 1-20.
Abstract
Present paper proposes four generalized classes of estimators for estimating population mean under the framework of two-phase sampling design by using auxiliary information and also the expressions for bias and mean square error are derived. These types of imputation techniques are used in different decision science related fields for better results. In addition, theoretical results showing the superiority of the proposed estimator over existing estimators from empirical studies based on different datasets from classical statistical literature are shown.
Keywords
Imputation; Bias; Mean Square Error (MSE); Missing Data; Large Sample Approximation; Simple Random Sampling without Replacement (SRSWOR).
Introduction
The sampling unit refuses to participate in the sample survey, cannot respond, cannot be contacted, or accidentally loses some of the information collected due to unexpected factors, resulting in incomplete survey responses. To deal with missing data effectively Kalton et al. (1981) and Sande (1979) suggested imputation methods that make an incomplete data set structurally complete and its analysis simple. Hyunshik Lee & Särndal (1994); and Lee et al. (1995) used the information on an auxiliary variable for the purpose of imputation. Later Singh and Horn (2000) introduced a compromised method of imputation based on auxiliary variables. Ahmed et al. (2006) discussed several new imputation based estimators that used the information on an auxiliary variate and compared their performance with the mean method of imputation.
Singh and Horn (2000); Wright & Capps (2011), Singh & Gogoi (2017); Singh & Nath (2018b; 2019) and Joyce et al. (2021) discussed designing mixed sampling plan based on IPD and some imputation methods of missing data for estimating the population mean using two-phase sampling scheme.
The objective of the present research work is to provide more efficient alternative estimators than the existing ones, when population parameter of auxiliary information is missing or unknown.
Notations
Let  be a finite population of size N and Y is the study variable and X, Z are the auxiliary variable where Y, X and Z are the population mean of the variable Y, X and Z respectively.
Consider a first phase sample  of size
  drawn from the population
  by using SRSWOR method and a second sample S of size
  drawn from
  or S1
or S1
Case-I: when second sample S is drawn from S1 i.e. second sample S is depends on first sample S1 (denoted by design I) as in Figure 1.
Case-II: when second sample S is drawn from  i.e. second sample S is independent of first sample S1 (denoted by design II) as in Figure 1.
Let the second sample S contains  responding units forming a sub space R and
  non-responding units with sub space Rc , such that
  For every unit
  is observed available. For every unit
  values are missing and imputed values are observed available. For every unit
  values are missing and imputed values are computed. The
  of auxiliary variables are used as a source of imputation for missing data when
  assuming that in S and S1 the data
  are known.


 population correlation coefficient between X and Y , Y and Z & Z and X respectively.
 the coefficient of variation of X, Y and Z respectively.
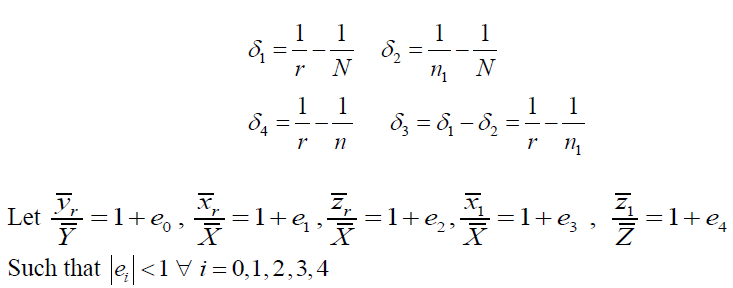
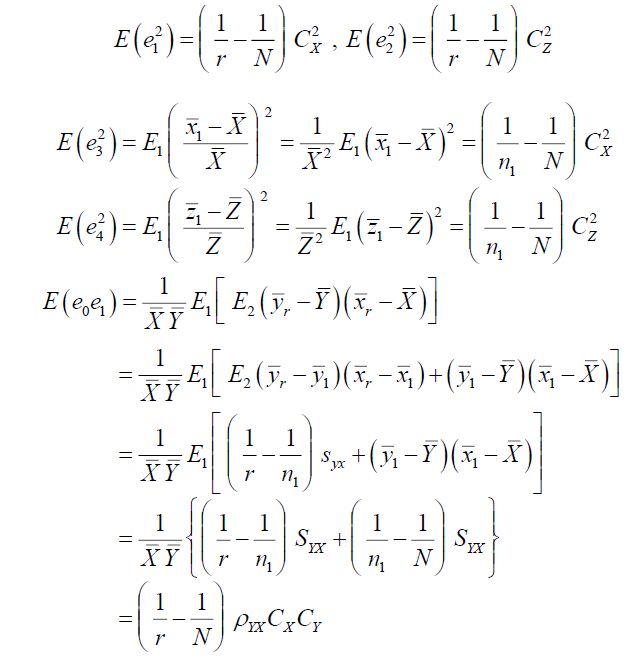
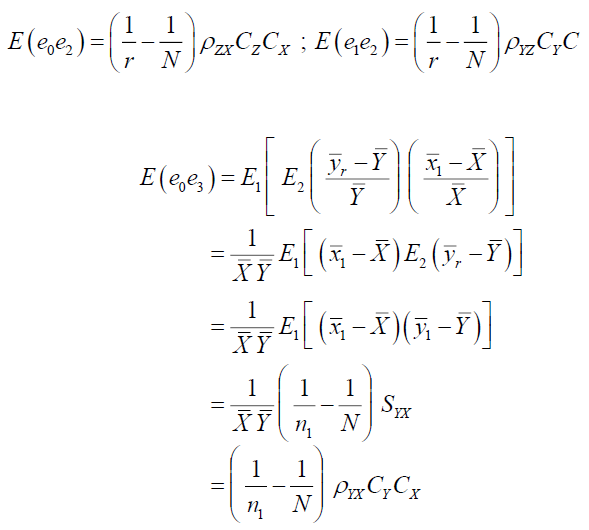
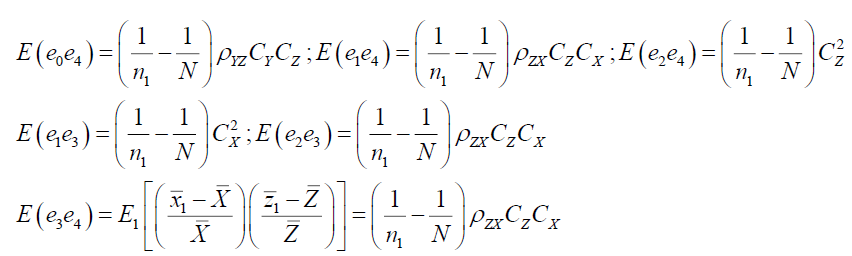
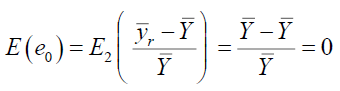
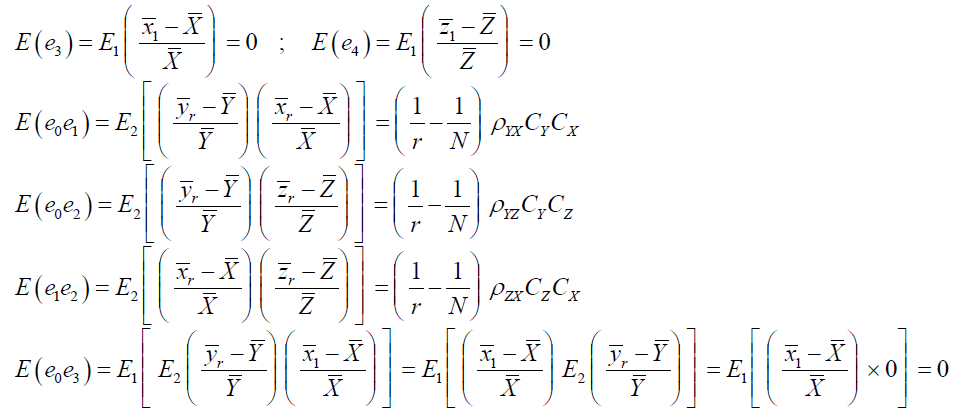
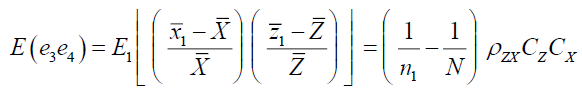
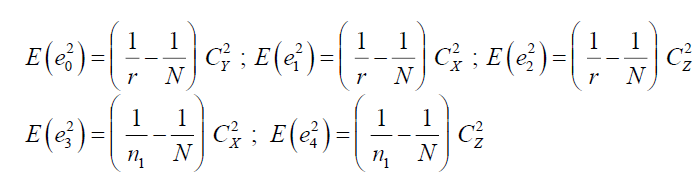
Now using the concept of two-phase sampling and denoting E1and E2 as the expectation over first phase and second phase respectively we have the following expected values.
Case I: when S is drawn from S1
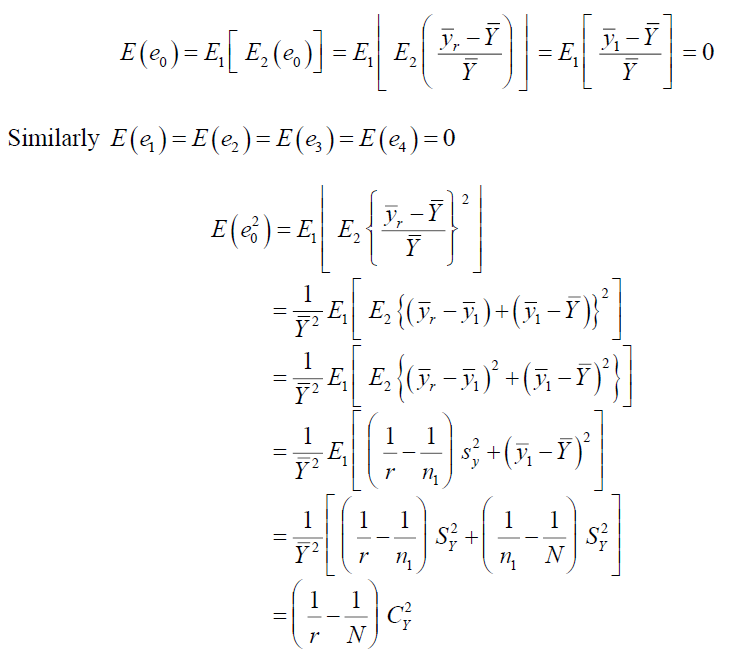
Similarly,
Similarly,
Similarly,
Case II: when S is drawn from 
Similarly 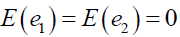
Similarly,

Similarly,
Some Existing Imputation Techniques
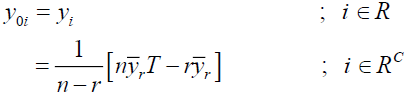
Mean Method of Imputation
Under Mean method of imputation
Using above the point estimator of population mean 
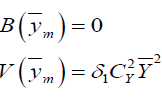
The bias and Variance are given by
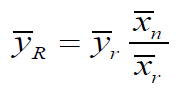
Ratio Method of Imputation (Hyunshik Lee & Särndal, 1994)
Under Ratio Method of Imputation
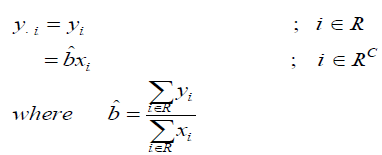
Using above the point estimator of population mean Y is
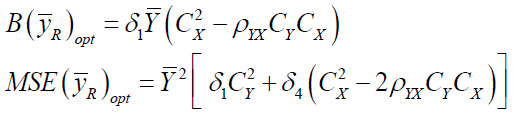
The bias and MSE are given by
Compromised Method of Imputation (Singh & Horn, 2000)
Under this method of imputation
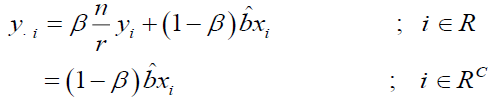
Using the above the point estimator of population mean Y is
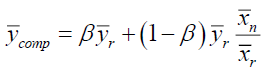
Where β is a constant to be determined such that MSE of ycomp is minimum.
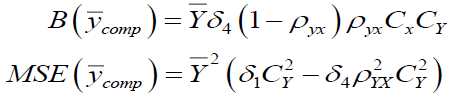
The optimum Bias and MSE are-
Exponential Ratio Method of Imputation in two-phase sampling (Pandey et al., 2015)
Under this method of imputation
Using above the point estimator of population mean Y is
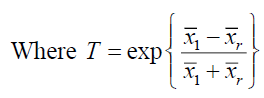
Where α is a drawn constant such that MSE of  is minimum.
The optimum Bias and MSE are given by
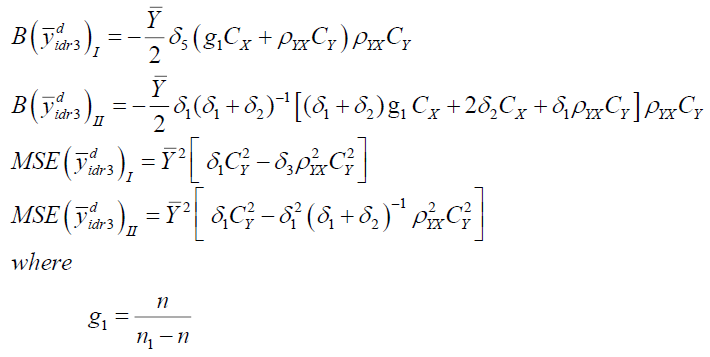
Dual to Ratio Method of Imputation in two-phase sampling (Singh & Nath, 2018a)
Under this method of imputation
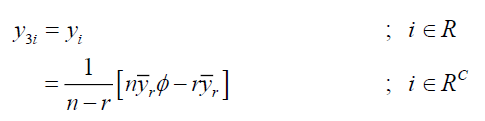
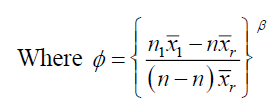
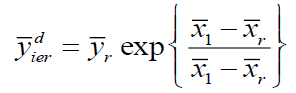
Using above the point estimator of population mean  is
is
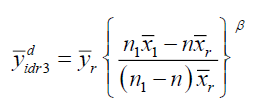
Where β is a drawn constant such that MSE of  is minimum.
The optimum Bias and MSE are given by
Proposed Imputation Strategies
Motivating the above imputation methods of population mean, we have proposed the following Multivariate Ratio type imputation methods of population mean in two-phase sampling.
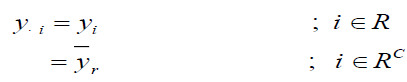
Imputation Method 
The imputation scheme is as follows:
Imputation Method 
The imputation scheme is as follows
Imputation Method 
The imputation scheme is as follows
Imputation Method 
The imputation scheme is as follows
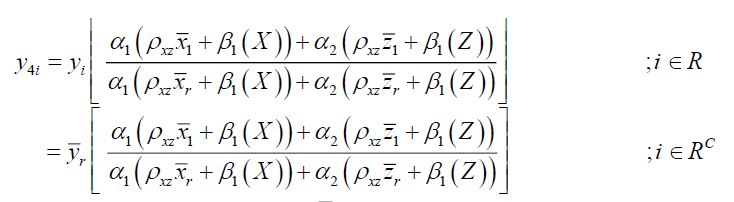
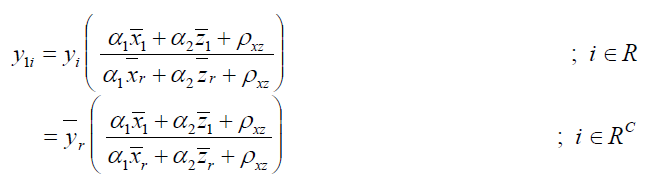
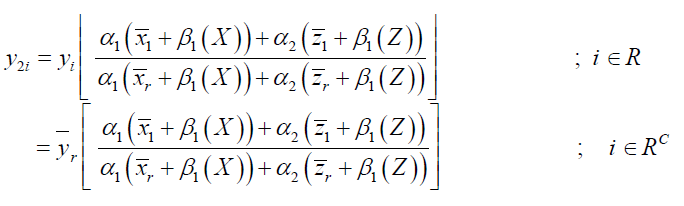
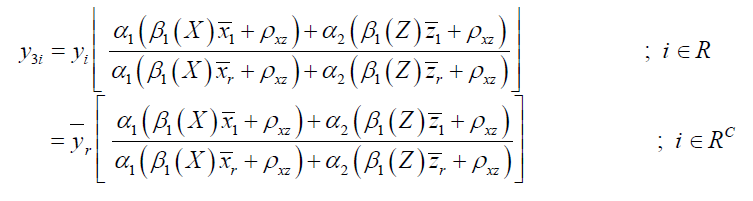
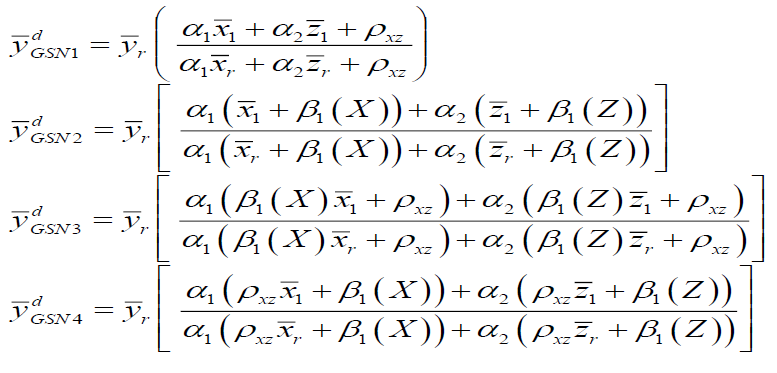
Point estimators for population mean  under the proposed four types of imputation methods
  can easily be deduced. We have the point estimators-
In general the above four imputation method can be defined as 
The imputation scheme is a follows
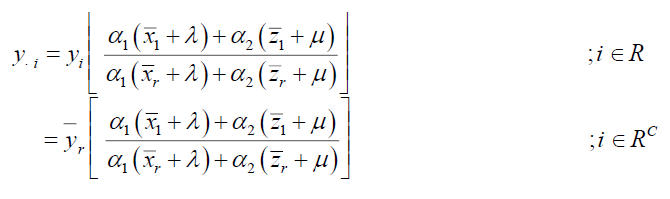
Point estimator for population mean 
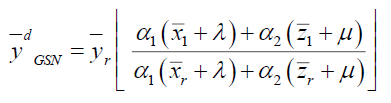
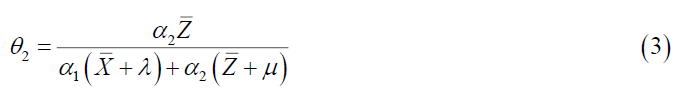
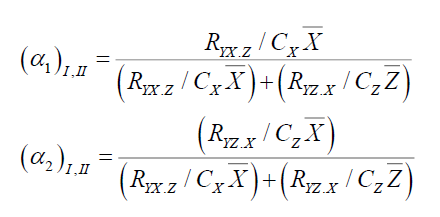
Where α1 and α2 are suitable chosen constants to be determined such that MSE of the point estimator has minimum and 
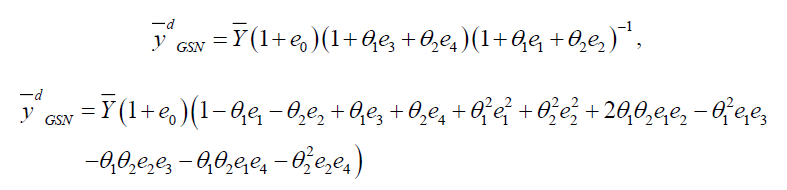
Expanding  in terms of
  retaining the terms upto first order approximate we have
Where,
Properties of Proposed Estimator
The bias, MSE and min MSE of the proposed point estimators have been derived in the following theorems.
Theorem 1
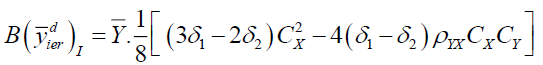
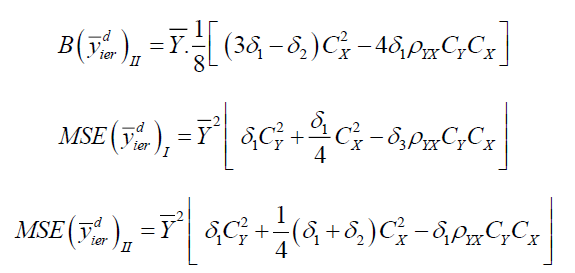
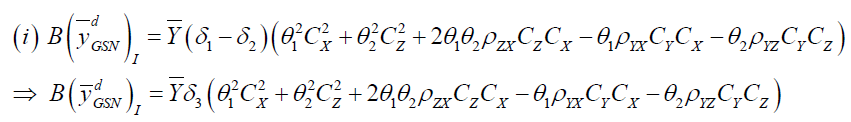
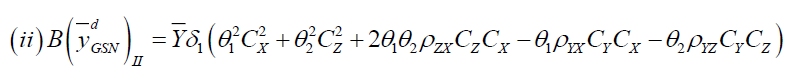
Bias of the estimators  under design I and design II upto first order of approximation are as:


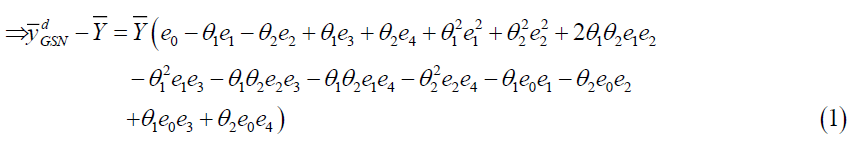
Proof: Taking expectation on both sides of equation (1) we have
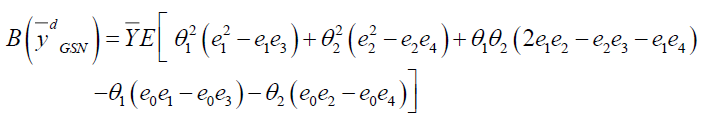
Putting the expected values under design I we have
Putting the expected values under design II we have
Theorem 2
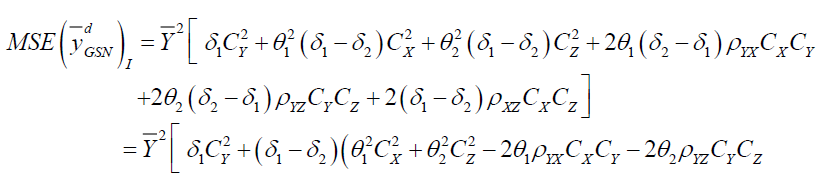
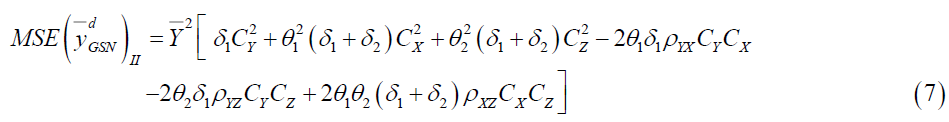
MSE of the estimators  under design I and design II upto first order approximation are as-
Proof: Taking expectation after squaring the both sides of (3) we have
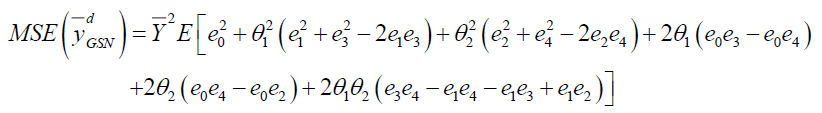
Putting the expected values under design I we have

Putting the expected values under design II we have
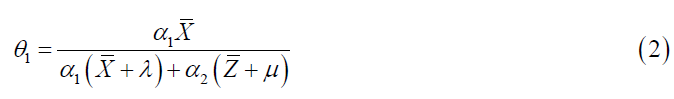
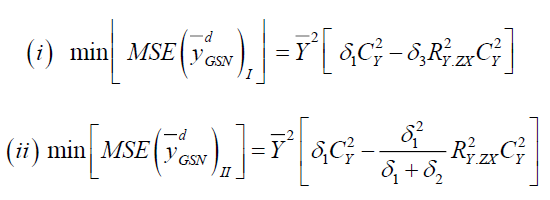
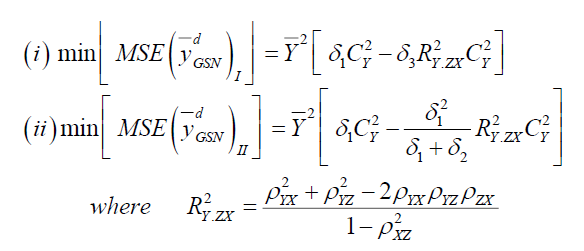
The optimum value of  is obtained by minimizing
 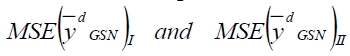 given in equation (6) and (7) by using the method of maxima and minima we have-
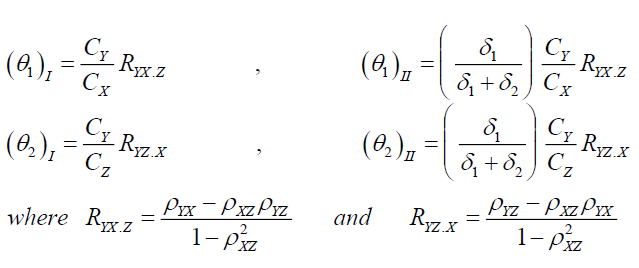
Putting the optimum values of  under the design I and design II in equation (2) and (3) and solving for
  we have
Putting the optimum values of  under design I and II in equation (4) & (5) we have
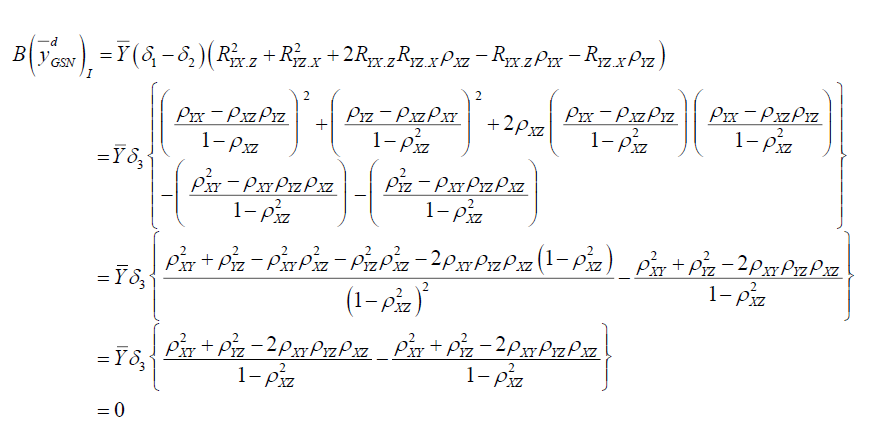
Theorem 3
The estimator  is unbiased for optimum values of
  under design I and II.
Proof: Putting the optimum values of  under design I in equation (6) we have
Similarly put ting the optimum values of  under design II in equation (7) we have
Comparison
In this section we divide the conditions under which the suggested estimator is superior to the existing estimators in design I and design II. To compare the different estimators we use the following theorem of multiple correlation coefficients.
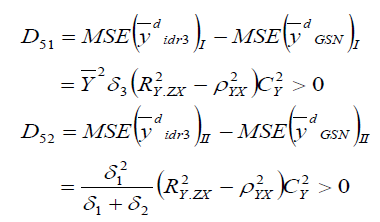
Comparison with Mean Method of Imputation
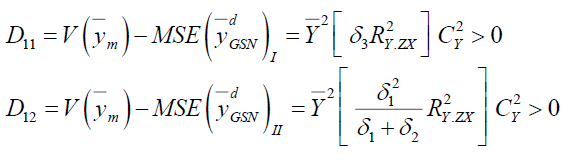
 is always efficient than
  in design I and design II.
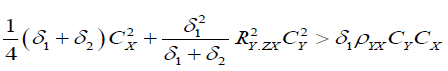
Comparison with Ratio Method of Imputation
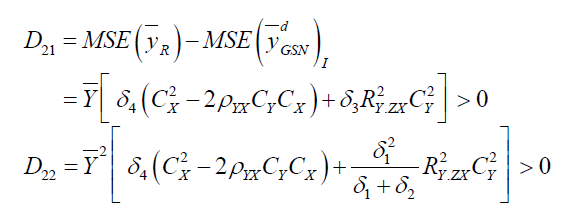
 is always efficient than
  in design I and design II.
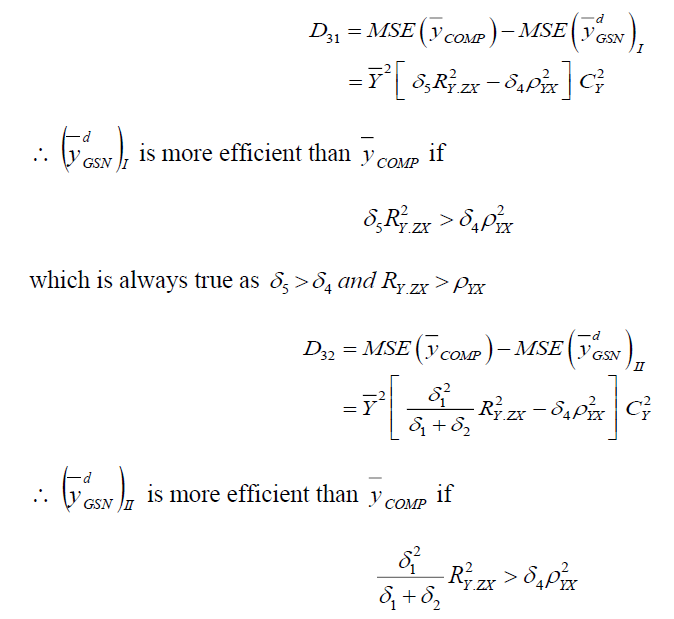
Comparison with Compromised Method of Imputation
Comparison with Exponential Ratio Method of Imputation
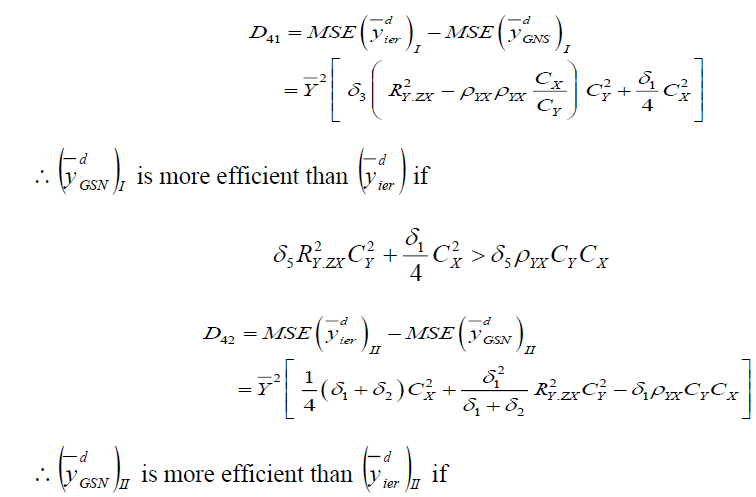
Comparison with dual to Ratio Method of Imputation
 is always efficient than
  in design I and design II.
Empirical Study
To examine the performance of the proposed estimator of the population mean in twophase sampling, we have considered the following three populations (Tables 1-10).
| Table 1 Mse of The Different Estimators Under Design I | |||
| Point Estimator | Population I | Population II | Population III |
 |
2.026693 | 2559.906609 | 10.369737 |
 |
1.875253 | 1631.420886 | .955755 |
 |
1.757726 | 1630.937426 | 8.752709 |
 |
1.324985 | 1084.832174 | 7.845193 |
 |
1.152552 | 448.613009 | 6.731424 |
 |
1.090778 | 446.556316 | 6.273775 |
| Table 2 Mse of The Different Estimators Under Design II | |||
| Point Estimator | Population I | Population II | Population III |
 |
2.026693 | 2559.906609 | 10.369737 |
 |
1.875253 | 1631.420886 | 8.955755 |
 |
1.757726 | 1630.937426 | 8.752709 |
 |
1.117529 | 828.239053 | 6.4115601 |
 |
1.117496 | 405.529871 | 6.356754 |
 |
1.053244 | 403.431209 | 5.851978 |
Table 3 Pre of The Different Estimators With Respect To  Under Design I Under Design I |
|||
| Point Estimator | Population I | Population II | Population III |
 |
100.000 | 100.000 | 100.000 |
 |
106.686 | 100.029 | 102.319 |
 |
141.530 | 150.385 | 114.156 |
 |
162.704 | 363.659 | 133.044 |
 |
171.918 | 365.334 | 142.749 |
Table 4 Pre of The Different Estimators With Respect To  Under Design Ii Under Design Ii |
|||
| Point Estimator | Population I | Population II | Population III |
 |
100.000 | 100.000 | 100.000 |
 |
106.686 | 100.029 | 102.319 |
 |
167.803 | 196.975 | 139.681 |
 |
167.808 | 402.294 | 140.886 |
 |
178.045 | 404.386 | 153.038 |
Table 5 Pre of The Different Estimators With Respect To  Under Design I Under Design I |
|||
| Point Estimator | Population I | Population II | Population III |
 |
100.000 | 100.000 | 100.000 |
 |
132.660 | 150.340 | 111.568 |
 |
152.507 | 363.551 | 130.027 |
 |
161.144 | 365.225 | 139.513 |
Table 6 Pre of The Different Estimators With Respect To  Under Design Ii Under Design Ii |
|||
| Point Estimator | Population I | Population II | Population III |
 |
100.000 | 100.000 | 100.000 |
 |
157.287 | 196.916 | 136.514 |
 |
157.292 | 402.174 | 137.691 |
 |
166.887 | 404.267 | 149.568 |
Table 7 Pre of The Different Estimators With Respect To  Under Design I Under Design I |
|||
| Point Estimator | Population I | Population II | Population III |
 |
100.000 | 100.000 | 100.000 |
 |
114.961 | 241.819 | 116.546 |
 |
121.472 | 242.933 | 125.047 |
Table 8 Pre of The Different Estimators With Respect To  Under Design Ii Under Design Ii |
|||
| Point Estimator | Population I | Population II | Population III |
 |
100.000 | 100.000 | 100.000 |
 |
100.003 | 204.236 | 100.086 |
 |
106.103 | 205.299 | 109.562 |
Table 9 Pre of The Different Estimators With Respect To  Under Design I Under Design I |
|||
| Point Estimator | Population I | Population II | Population III |
 |
100.000 | 100.000 | 100.000 |
 |
105.666 | 100.460 | 107.295 |
Table 10 Pre of The Different Estimators With Respect To  Under Design Ii Under Design Ii |
|||
| Point Estimator | Population I | Population II | Population III |
 |
100.000 | 100.000 | 100.000 |
 |
106.100 | 100.495 | 108.626 |
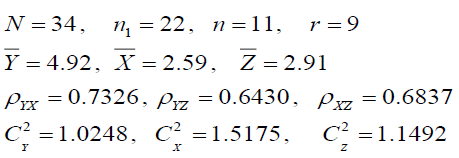
Population I (Cochran, 1977)
Y : Number of placebo children
X : Number of paralytic polio cases in the placebo group
Z :Number of paralytic polio cases in the ‘not inoculated group
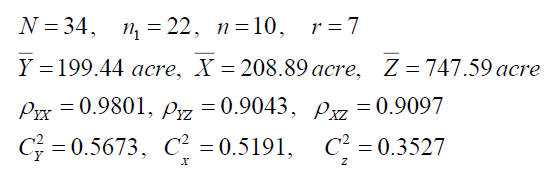
Population II (Murthy, 1967)
Y : Area under wheat in 1964
X : Area under wheat in 1963
Z :Cultivated area in 1961
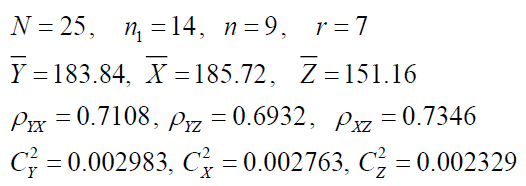
Population III (Anderson, 2003)
Y : Head length of second son
X : Head length of first son
Z :Head breathe of first son
Conclusion
From the above tables, it is obvious that the suggested have smaller Mean Square Error (MSE) than the MSE’s of the other existing estimators both theoretically as well as empirically under dependent and independent cases. Also the Bias of the proposed estimator vanishes at the optimum values of α1 and α2 . . Therefore it is concluded that the proposed estimator is preferable to use over other existing estimator.
References
Ahmed, M.S., Al-Titi, O., Al-Rawi, Z., & Abu-Dayyeh, W. (2006). Estimation of a population mean using different imputation methods. Statistics in Transition, 7(6), 1247-1264.
Anderson, T.W. (2003). An Introduction to Multivariate Statistical Analysis, 3rd edR John Wiley and Sons. New York.
Cochran, W.G. (1977). Sampling techniques. John Wiley & Sons.
Hyunshik Lee, E.R., & Särndal, C.E. (1994). Experiments with variance estimation from survey data with imputed values. Journal of official Statistics, 10(3), 231-243.
Joyce, V.J., Merlin, G.S., Edna, K.R.J., & Fenella, S. (2021). Designing Mixed Sampling Plan Based on IPD. Journal of Management Information and Decision Sciences, 24, 1-6.
Kalton, G., Kasprzyk, D., & Santos, R. (1981). Issues of nonresponse and imputation in the survey of income and program participation. In Current topics in survey sampling (pp. 455-480). Academic Press.
Indexed at, Google Scholar, Cross Ref
Lee, H., Rancourt, E., & Sarndal, C.E. (1995). Variance estimation in the presence of imputed data for the generalized estimation system. Proc. of the American Statist. Assoc.(Social Survey Research Methods Section), 384-389.
Murthy, M.N. (1967). Sampling: Theory and methods. Statistical Pub. Society.
Pandey, R., Thakur, N.S., & Yadav, K. (2015). Estimation of population mean using exponential ratio type imputation method under survey non-response. Journal of the Indian Statistical Association, 53(1), 89-107.
Sande, I.G. (1979). A personal view of hot deck approach to automatic edit and imputation. Journal Imputation Procedures. Survey Methodology, 5, 238-246.
Singh, B.K. & Nath K. (2018a). Estimation of population mean using ratio cum product compromised method of imputation in two-phase sampling scheme in sample survey. Asian Journal of Mathematics & Statistics, 11(1), 27-39.
Singh, B.K. & Nath K. (2019). Generalized class of dual to product cum dual to ratio estimator for population mean with imputation of missing data in two-phase sampling scheme. International Journal of Mathematics and Statistics (IJMS), 21, 86-96.
Singh, B.K., & Gogoi, U. (2017). Estimation of population mean using exponential dual to ratio type compromised imputation for missing data in survey sampling. J Stat Appl Pro, 3, 515-522.
Indexed at, Google Scholar, Cross Ref
Singh, B.K., & Nath, K. (2018b). Some Imputation Methods in Two-Phase Sampling Scheme for Estimation of Population Mean. Research & Reviews: Journal of Statistics (RRJoST), 7(1), 1-16.
Singh, S., & Horn, S. (2000). Compromised imputation in survey sampling. Metrika, 51(3), 267-276.
Indexed at, Google Scholar, Cross Ref
Wright, K., & Capps, C. (2011). A survey of information systems development project performance. Academy of Information and Management Sciences Journal, 14(1), 87-105.
Received: 10-Feb-2022, Manuscript No. JMIDS-22-11218; Editor assigned: 15-Feb-2022, PreQC No. JMIDS-22-11218(PQ); Reviewed: 07-Mar-2022, QC No. JMIDS-22-11218; Revised: 29-Mar-2022, Manuscript No. JMIDS-22-11218 (R); Published: 05-Apr-2022